CoinGlass: 2025 Cryptocurrency Derivatives Market Report
TechFlow Selected TechFlow Selected
CoinGlass: 2025 Cryptocurrency Derivatives Market Report
Looking ahead to 2026, the market's core competitiveness will center on whether trading infrastructure can maintain clearing resilience within extremely congested leverage chains, and whether capital can find the most efficient circulation path between compliance and decentralization.
Author: CoinGlass
Introduction
2025 marks a clear structural inflection point in the evolution of the cryptocurrency market. This year, crypto assets moved beyond their earlier phase dominated by fringe experimentation and became further embedded into the mainstream financial system, with structural shifts occurring in market participant composition, trading infrastructure, and regulatory environments.
The derivatives market saw significant expansion in 2025, with its structure becoming markedly more complex. The early model driven primarily by high-leverage retail speculation has been replaced by a more diversified set of institutional trading demands, ushering in a new era characterized by "institutional capital dominance, with compliant infrastructure and decentralized technology evolving in parallel." On one hand, traditional financial capital entered the market at larger scale and through clearer compliance pathways via BTC spot ETFs, options, regulated futures, and M&A integration. Hedging and basis trading demand gradually migrated toward on-exchange products, driving CME's structural rise: after surpassing Binance in 2024 to become the world’s largest BTC futures position platform, CME further solidified its dominance in BTC derivatives in 2025 and for the first time approached Binance’s retail-scale participation levels in ETH derivatives holdings and trading volume. On the other hand, on-chain derivatives, leveraging intent-centric architectures and high-performance application-specific chains, began forming functional alternatives to centralized derivatives in specific niche scenarios—particularly censorship-resistant trading and composable strategy execution—starting to exert real competitive pressure on CEXs in edge market shares.
Greater complexity and deeper leverage chains simultaneously heightened systemic tail risks. Extreme events during 2025 subjected existing margin mechanisms, liquidation rules, and cross-platform risk transmission paths to unprecedented stress tests, with impacts extending beyond individual assets or platforms, prompting a reassessment of the entire derivatives ecosystem’s resilience.
It should be emphasized that these changes represent only one slice of the broader market restructuring in 2025. Beyond macro narratives and extreme events, the rise of Perp DEXs, massive stablecoin expansion, institutional exploration of RWA, development of DAT architecture, iterations in on-chain prediction markets, and gradual implementation of regulatory frameworks across major jurisdictions collectively formed the multidimensional backdrop of the year. These internal structural evolutions intertwined with external shocks to shape the overall landscape and analytical starting point for the 2025 crypto derivatives market.
Market Overview
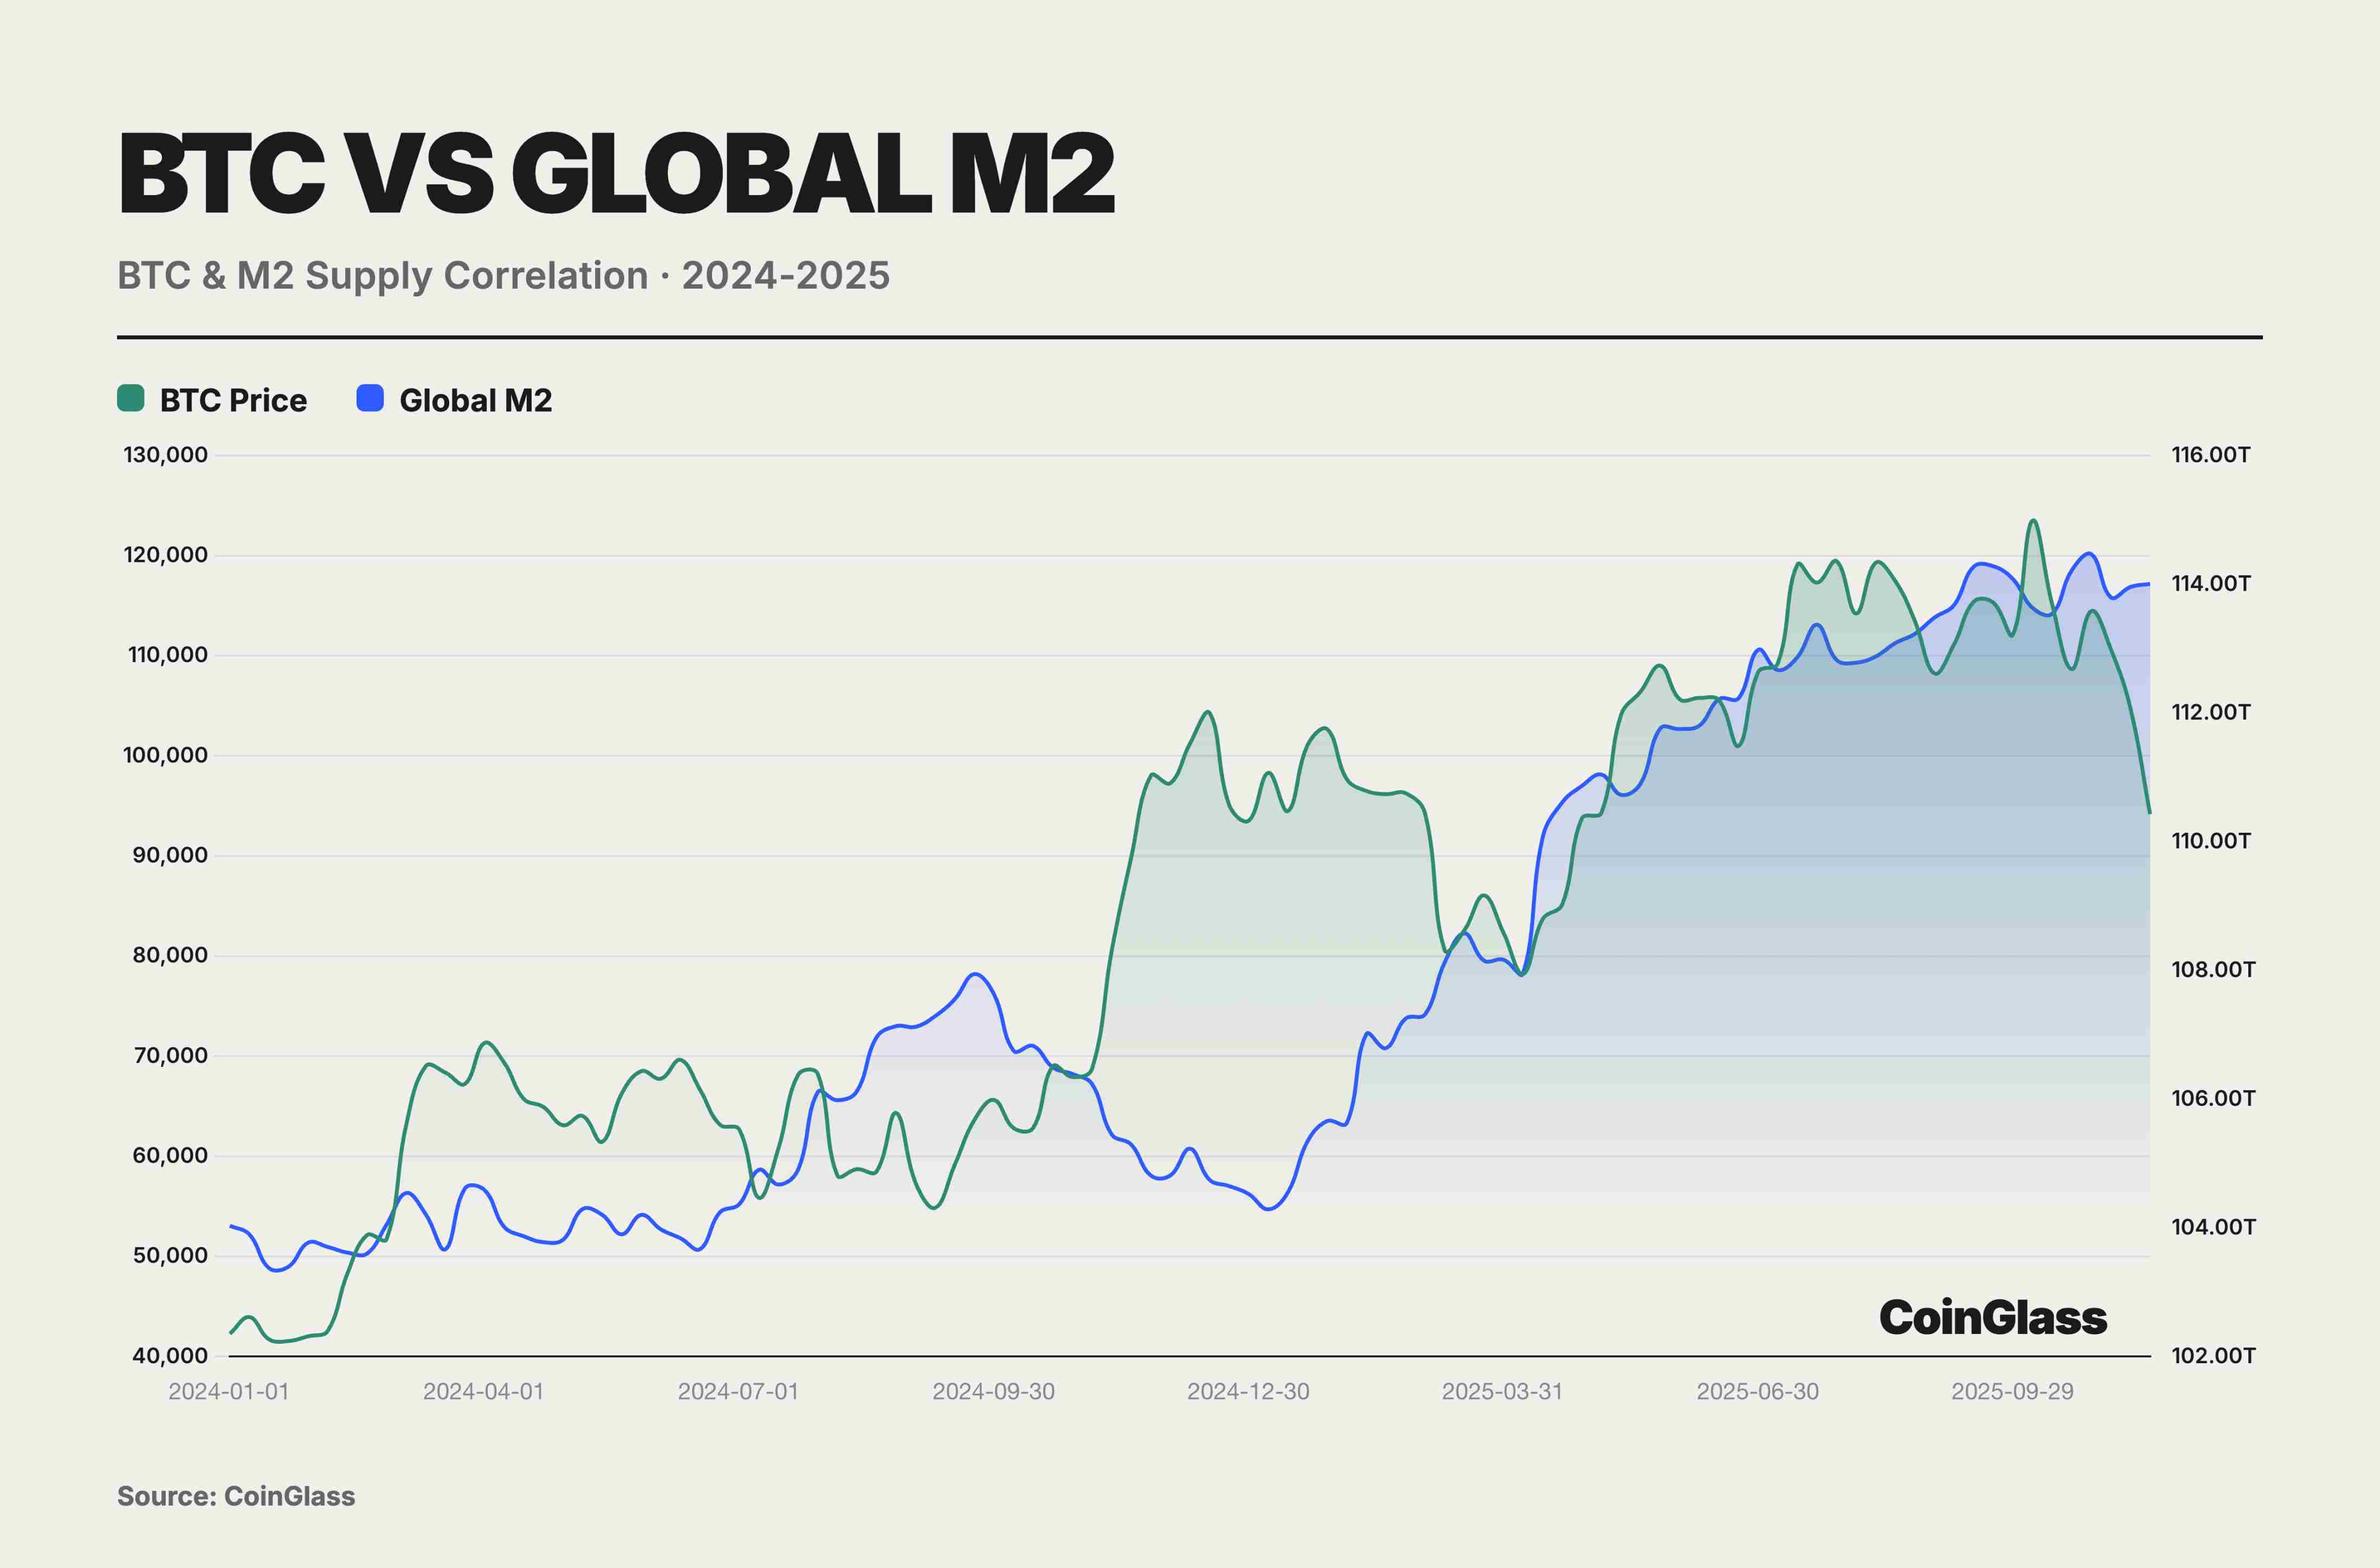
During the 2024–25 window of monetary easing and bull market conditions, BTC behaved more like a high-beta risk asset than an independent inflation hedge. Its annual correlation of 0.78 with global M2 masked structural decoupling in the second half, while the November downturn confirmed BTC’s essence as a high-beta risk asset. Buying BTC is not hedging against inflation—it is a bet on liquidity. Once liquidity tightens, BTC will be among the first assets sold off. Amid the Federal Reserve’s rate-cutting cycle and aggressive monetary easing by central banks globally, BTC surged from $40,000 to $126,000. This outsized return stemmed essentially from its beta coefficient of 2.5–3.0—a leveraged response to liquidity expansion—rather than independent value discovery.
Geopolitical and policy uncertainty emerged as key market drivers in 2025, with the complex macroeconomic environment providing exceptionally rich trading narratives for the derivatives market. Escalating U.S.-China trade tensions, the Fed’s delicate balancing act between rate cuts and recurring inflation, the Bank of Japan’s monetary normalization triggering a retreat in carry trades, and the new U.S. administration’s aggressive pro-crypto policies combined into a complex macro合力, injecting sustained volatility and deep strategic博弈 into the derivatives market. Overall, cryptocurrencies continued to behave predominantly as risk assets—specifically, high-beta risk assets—exhibiting extreme sensitivity to global liquidity conditions and central bank policy shifts throughout the year.
In 2025, major jurisdictions exhibited a pattern of “convergent direction, divergent paths” in regulating crypto derivatives. Under the new U.S. government, regulation shifted toward a legislative and licensing-based framework, integrating digital assets into national financial strategy and reducing prior uncertainties stemming from enforcement-driven oversight through legislation such as the GENIUS Act. The EU continued implementing its MiCA and MiFID frameworks, emphasizing consumer protection and leverage limits, imposing stricter access thresholds on high-leverage retail derivatives. Asia showed significant internal divergence: mainland China maintained strict suppression of crypto trading, while Hong Kong and Singapore positioned themselves as compliance testing grounds, competing for institutional pricing and settlement business via licensing systems and product whitelists. Notably, SGX launched BTC and ETH perpetual futures, signaling the integration of native crypto products into traditional financial infrastructure. The UAE accelerated its attraction of crypto firms and exchanges under a unified digital asset regulatory framework, positioning itself as a regional compliance hub. Overall, DeFi derivatives regulation gradually converged around the principle of “same business, same risk, same regulation,” indicating progressive alignment in compliance requirements between on-chain and off-chain markets.
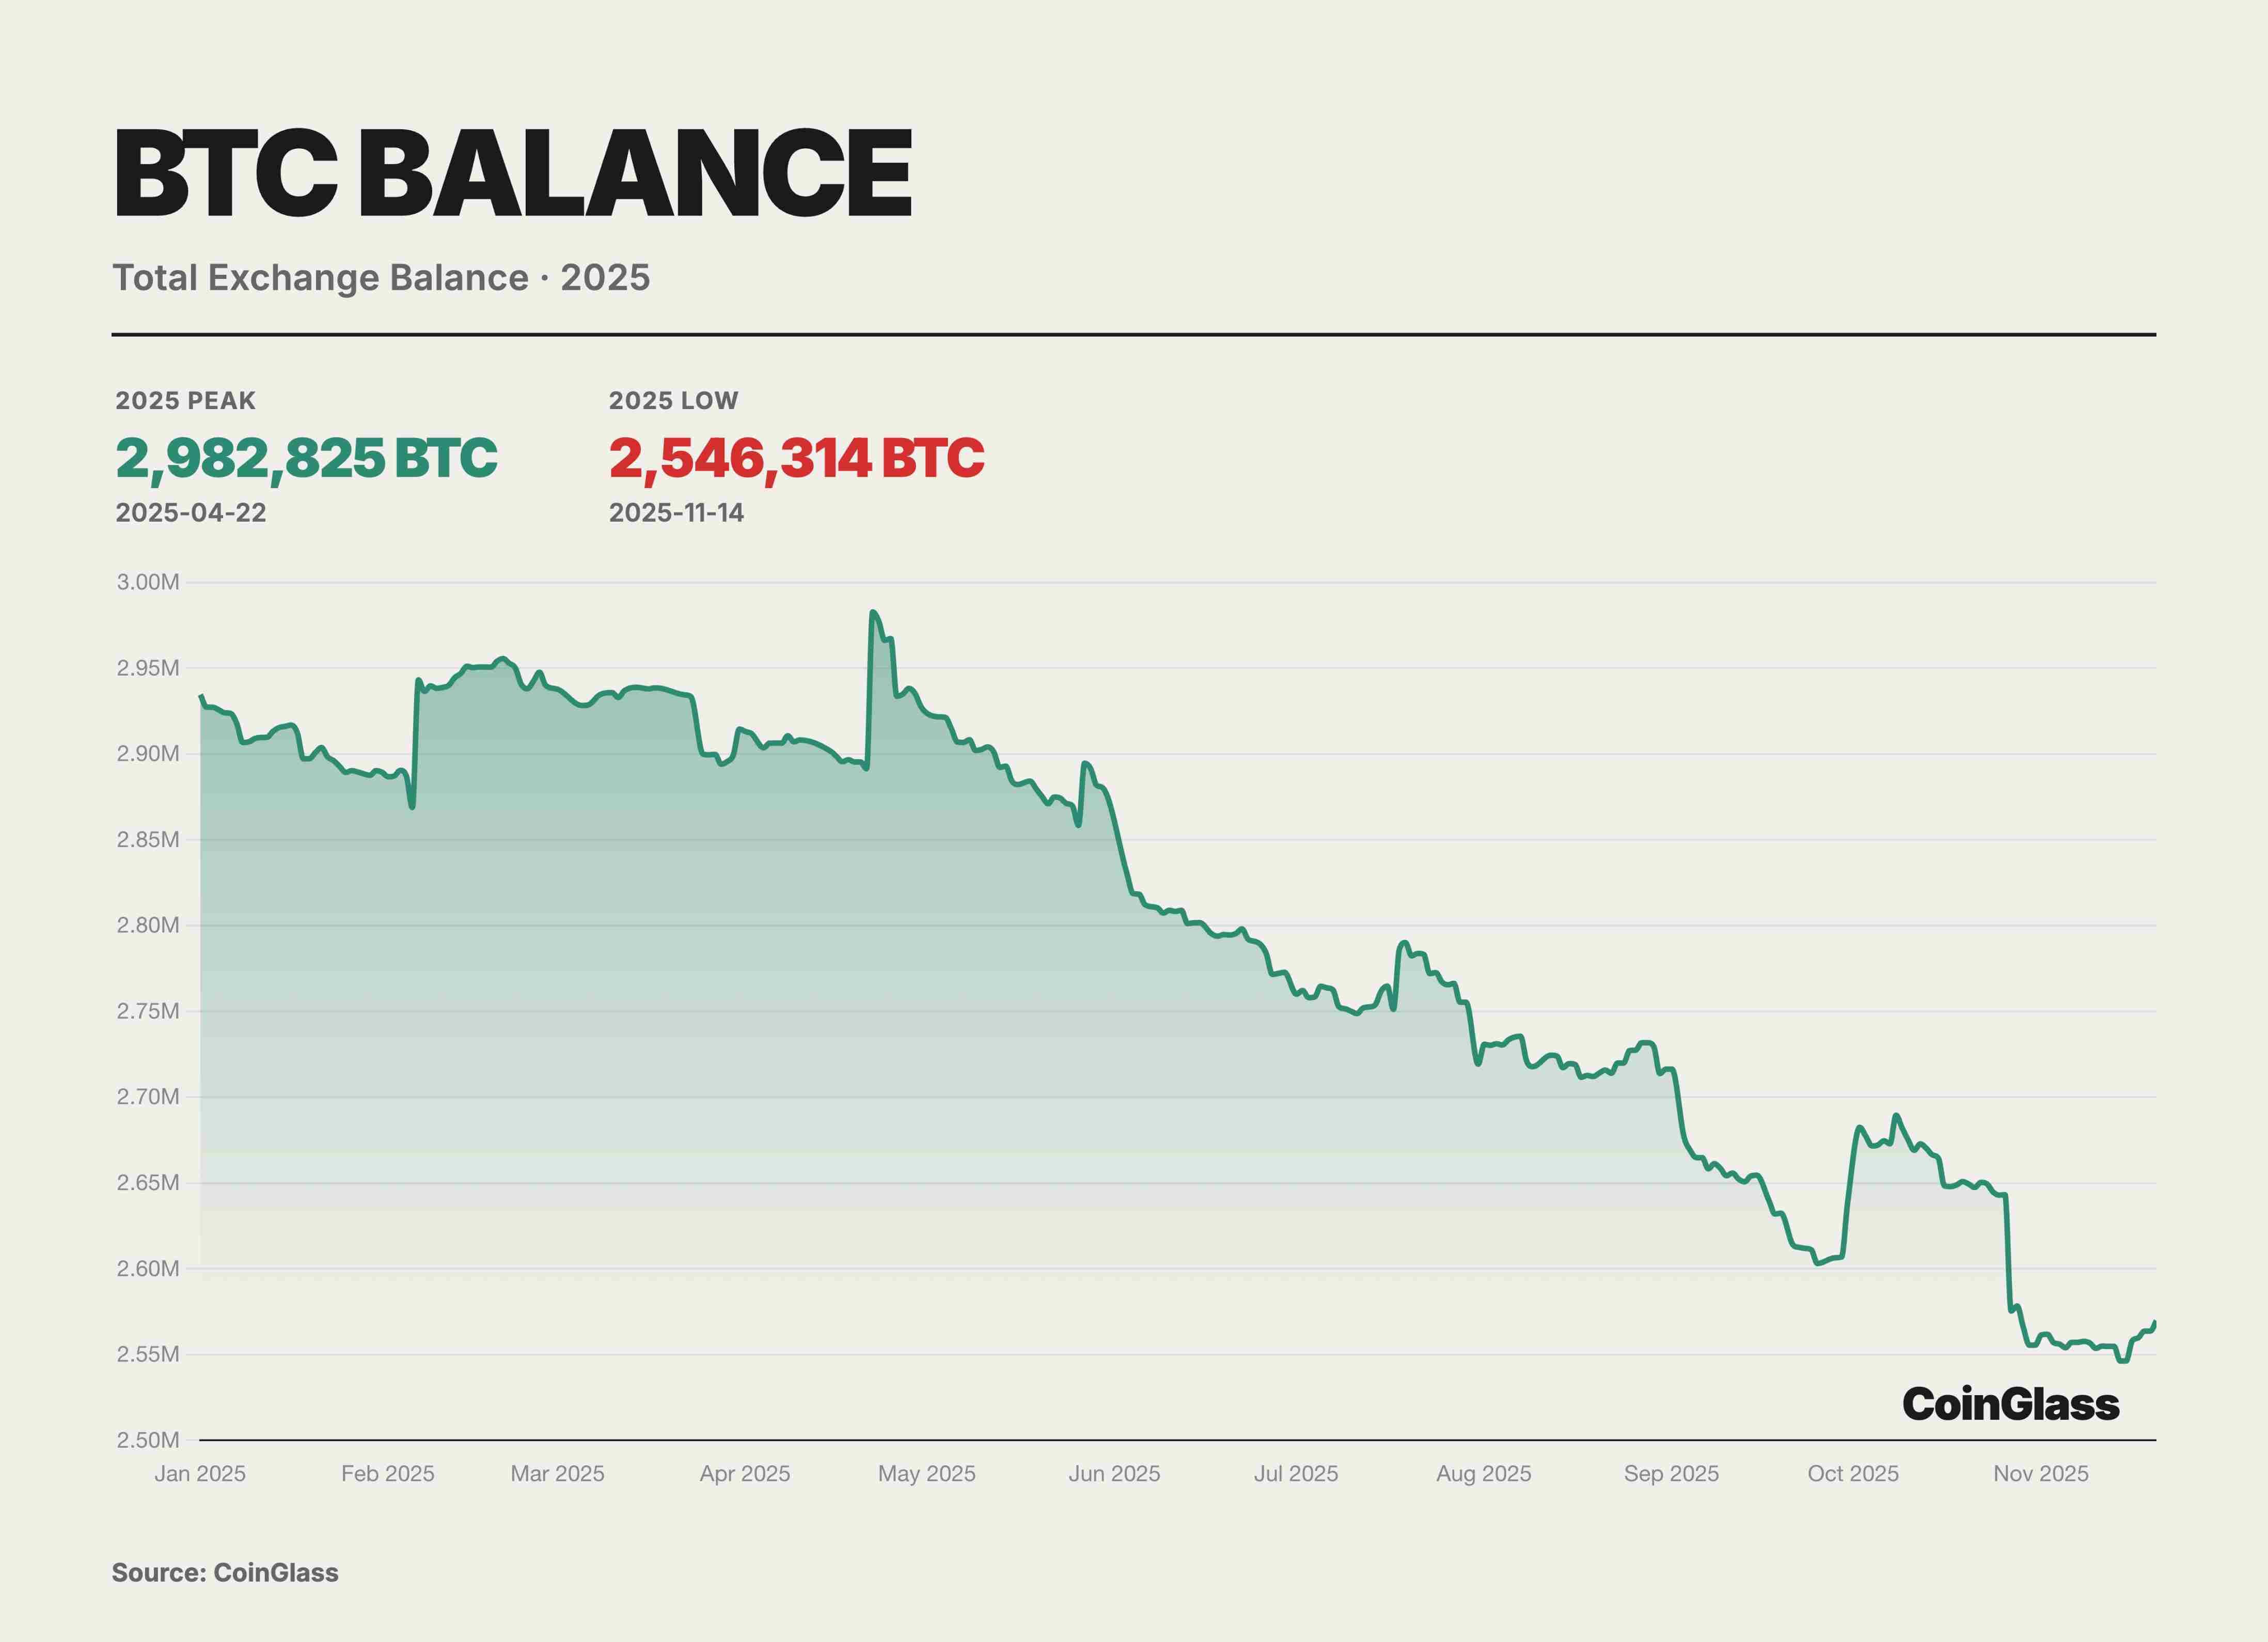
In 2025, BTC supply structure at the exchange level showed clear rebalancing, with total exchange balances stepping down and entering a sustained de-stocking phase from April highs. According to CoinGlass data, after reaching an annual peak of approximately 2.98 million BTC around April 22, exchange-held BTC reserves declined stepwise over subsequent months, falling to about 2.54 million BTC in mid-November—a net outflow of roughly 430,000 BTC, or a 15% decrease.
This de-stocking primarily reflected a migration of holdings from exchanges to self-custody addresses and a structural shift in trading demand toward “low turnover, long holding” behaviors, rather than merely reduced short-term selling pressure. As tradable supply continues to drain from exchanges, this dynamic helps elevate marginal prices and amplify procyclical gains during price rallies. However, it also implies that if macro expectations or price trends reverse, a concentrated return of previously withdrawn reserves could generate magnified sell-side pressure and volatility on thinner order books.
In 2025, stablecoins and DAT expanded in both scale and application, beginning to directly interface with traditional finance at the boundary layer. The total market cap of stablecoins briefly surpassed $230 billion, with annual on-chain settlement volume reaching approximately $1.5 trillion. Supported by legislation such as the GENIUS Act, stablecoins solidified their role as the foundational settlement layer for cross-border payments and on-chain finance. The DAT model provided traditional institutional investors with standardized access to crypto exposure through compliant equity or fund vehicles, with peak market value of BTC and ETH held exceeding $140 billion—an over threefold year-on-year increase. RWA served as a critical intermediary: anchoring real-world asset cash flows on one end, and connecting to the on-chain settlement and valuation systems of stablecoins and DAT on the other. A BCG–Ripple 2025 report projected that the tokenized asset market would grow from its current ~$600 billion at a compound annual rate of ~53%, reaching nearly $18.9 trillion by 2033, providing a scale assumption for this evolution.
2025 was also the turning point when decentralized derivatives transitioned from concept validation to actual market share competition. Leading on-chain derivatives protocols made substantial progress in technical architecture, product design, and user experience, offering increasingly viable alternatives to CEX trading and listing advantages. High-performance application-specific chain architectures, exemplified by Hyperliquid, demonstrated that decentralized infrastructure could directly compete with centralized matching platforms in throughput, latency, and capital efficiency within specific use cases. Intent-centric architecture emerged as the core paradigm for DeFi user experience upgrades in 2025: users specify only their desired end state, and Solvers or AI agents competitively search for optimal execution paths off-chain before submitting them collectively for on-chain settlement—significantly lowering the barrier to complex transactions.
In 2025, RWA onboarding became a significant milestone marking crypto’s move toward the mainstream. Growth momentum came from two sources: first, a marginally looser regulatory environment, with the U.S. aiming to reclaim leadership in crypto finance, leading Treasuries and U.S. equities to become core assets for tokenization; second, strong real demand—many global investors lack direct, convenient access to U.S. stock markets, and tokenization reduces nationality- and geography-based entry barriers. Token Terminal data showed a 2695% year-on-year increase in stock token market cap in 2025.
Meanwhile, brand effects of leading issuance and trading platforms began to emerge: Ondo, xStocks, and others, focusing on blockchain-accessible traditional financial assets, became representative players in the RWA narrative; mainstream exchanges like Bitget and Bybit continued investing resources in launching, trading, and providing liquidity for related assets. Combined with experiential advantages such as simplified account opening and 24/7 trading, stock tokens became a significantly more prominent market focus in 2025. A Bitget report showed that during Q3 2025, its stock contract trading volume increased 4468% quarter-on-quarter, cumulatively exceeding $10 billion.
Amid gradually clarifying macro narratives and regulatory frameworks—and converging uncertainty—more complex trading structures and strategic spaces opened up. Against this macro and institutional backdrop, the second section turns to empirical analysis of centralized trading infrastructure: by quantitatively tracking spot and derivatives trading volumes, market share shifts across major CEXs, and fund flows in BTC spot ETFs, we map out capital allocation paths of various participants in 2025, structural reallocations among trading platforms, and how institutional inflows reshaped overall market liquidity and price discovery mechanisms.
Centralized Derivatives Exchanges
CEX Derivatives Trading Volume
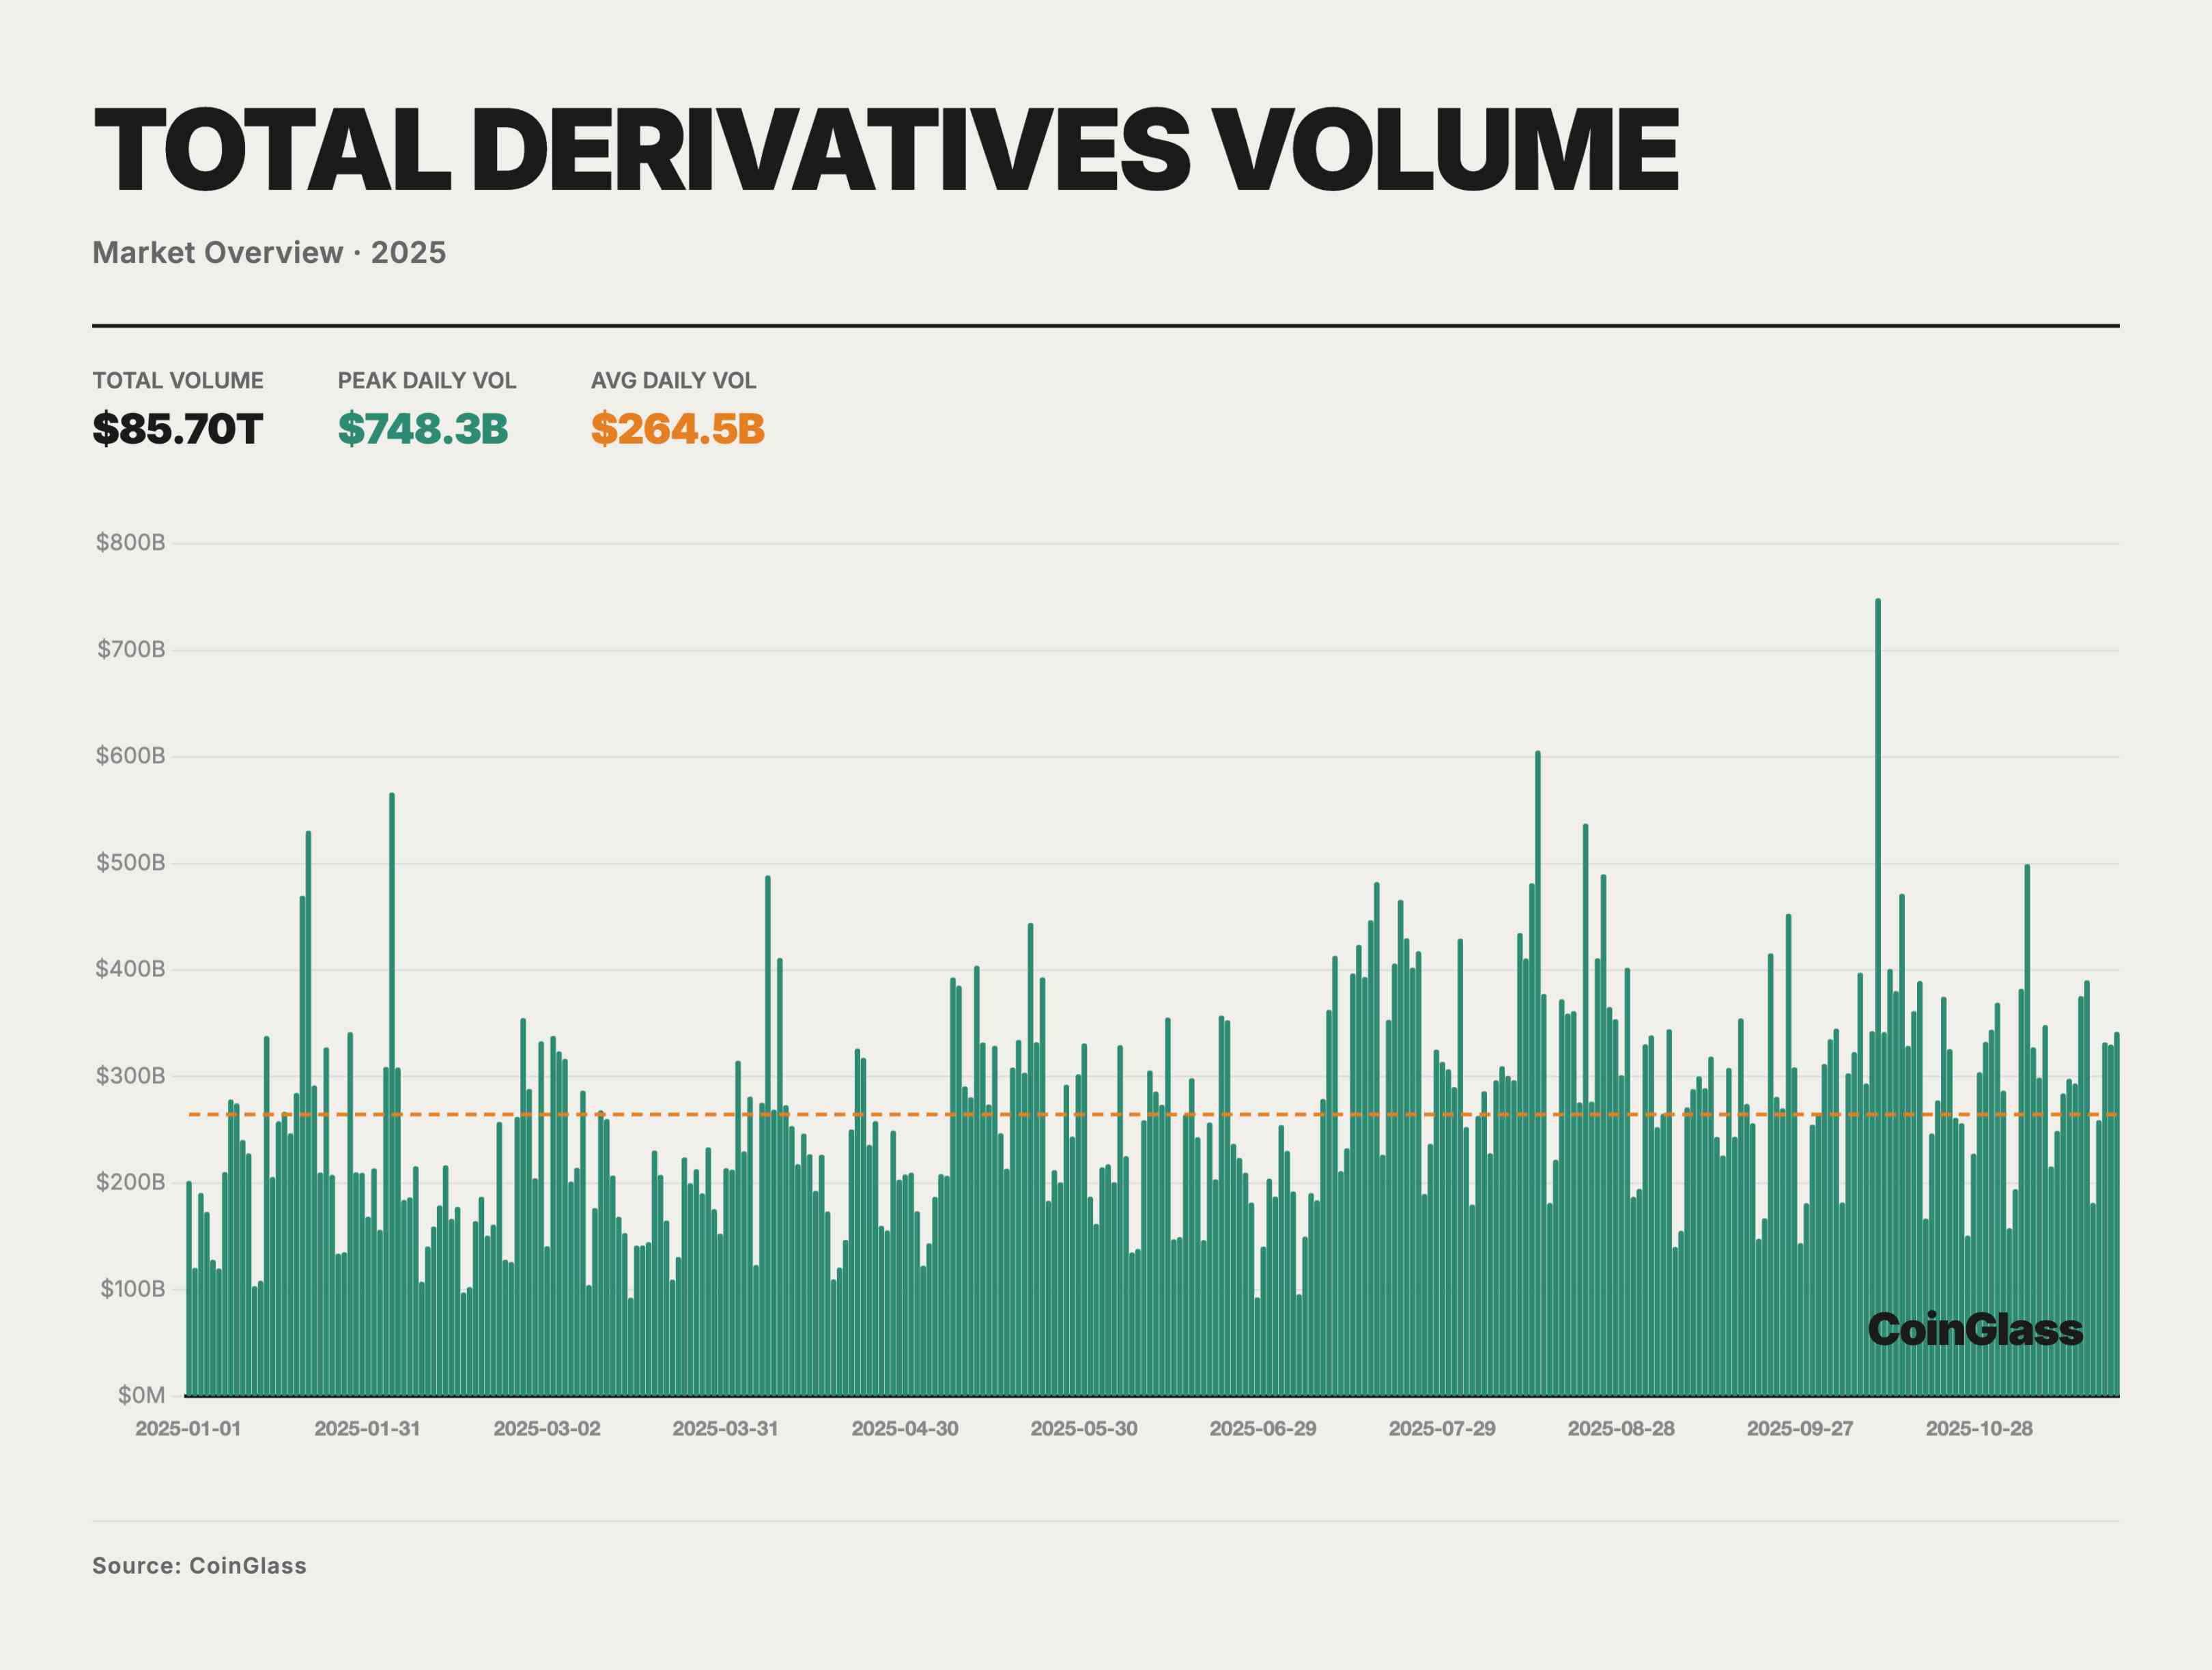
In 2025, the total trading volume of the crypto derivatives market was approximately $85.70 trillion, averaging about $264.5 billion per day. Amid a macro liquidity environment still relatively tight but with periodic recovery in risk appetite, overall trading activity followed a “low-to-high, oscillating upward” trajectory. Today, derivatives have become the primary venue for price formation and risk management for most major assets. Above the mean (shown as the orange dashed line), numerous high-volume days occurred, including a single-day peak of ~$748 billion on October 10—significantly above normal levels—highlighting derivatives as the core battleground for price discovery and leveraged betting during accelerating market phases. On a monthly basis, average daily volume stayed around $200 billion in Q1, gradually rising from Q2 onward, exceeding $300 billion per day in July–August and October.
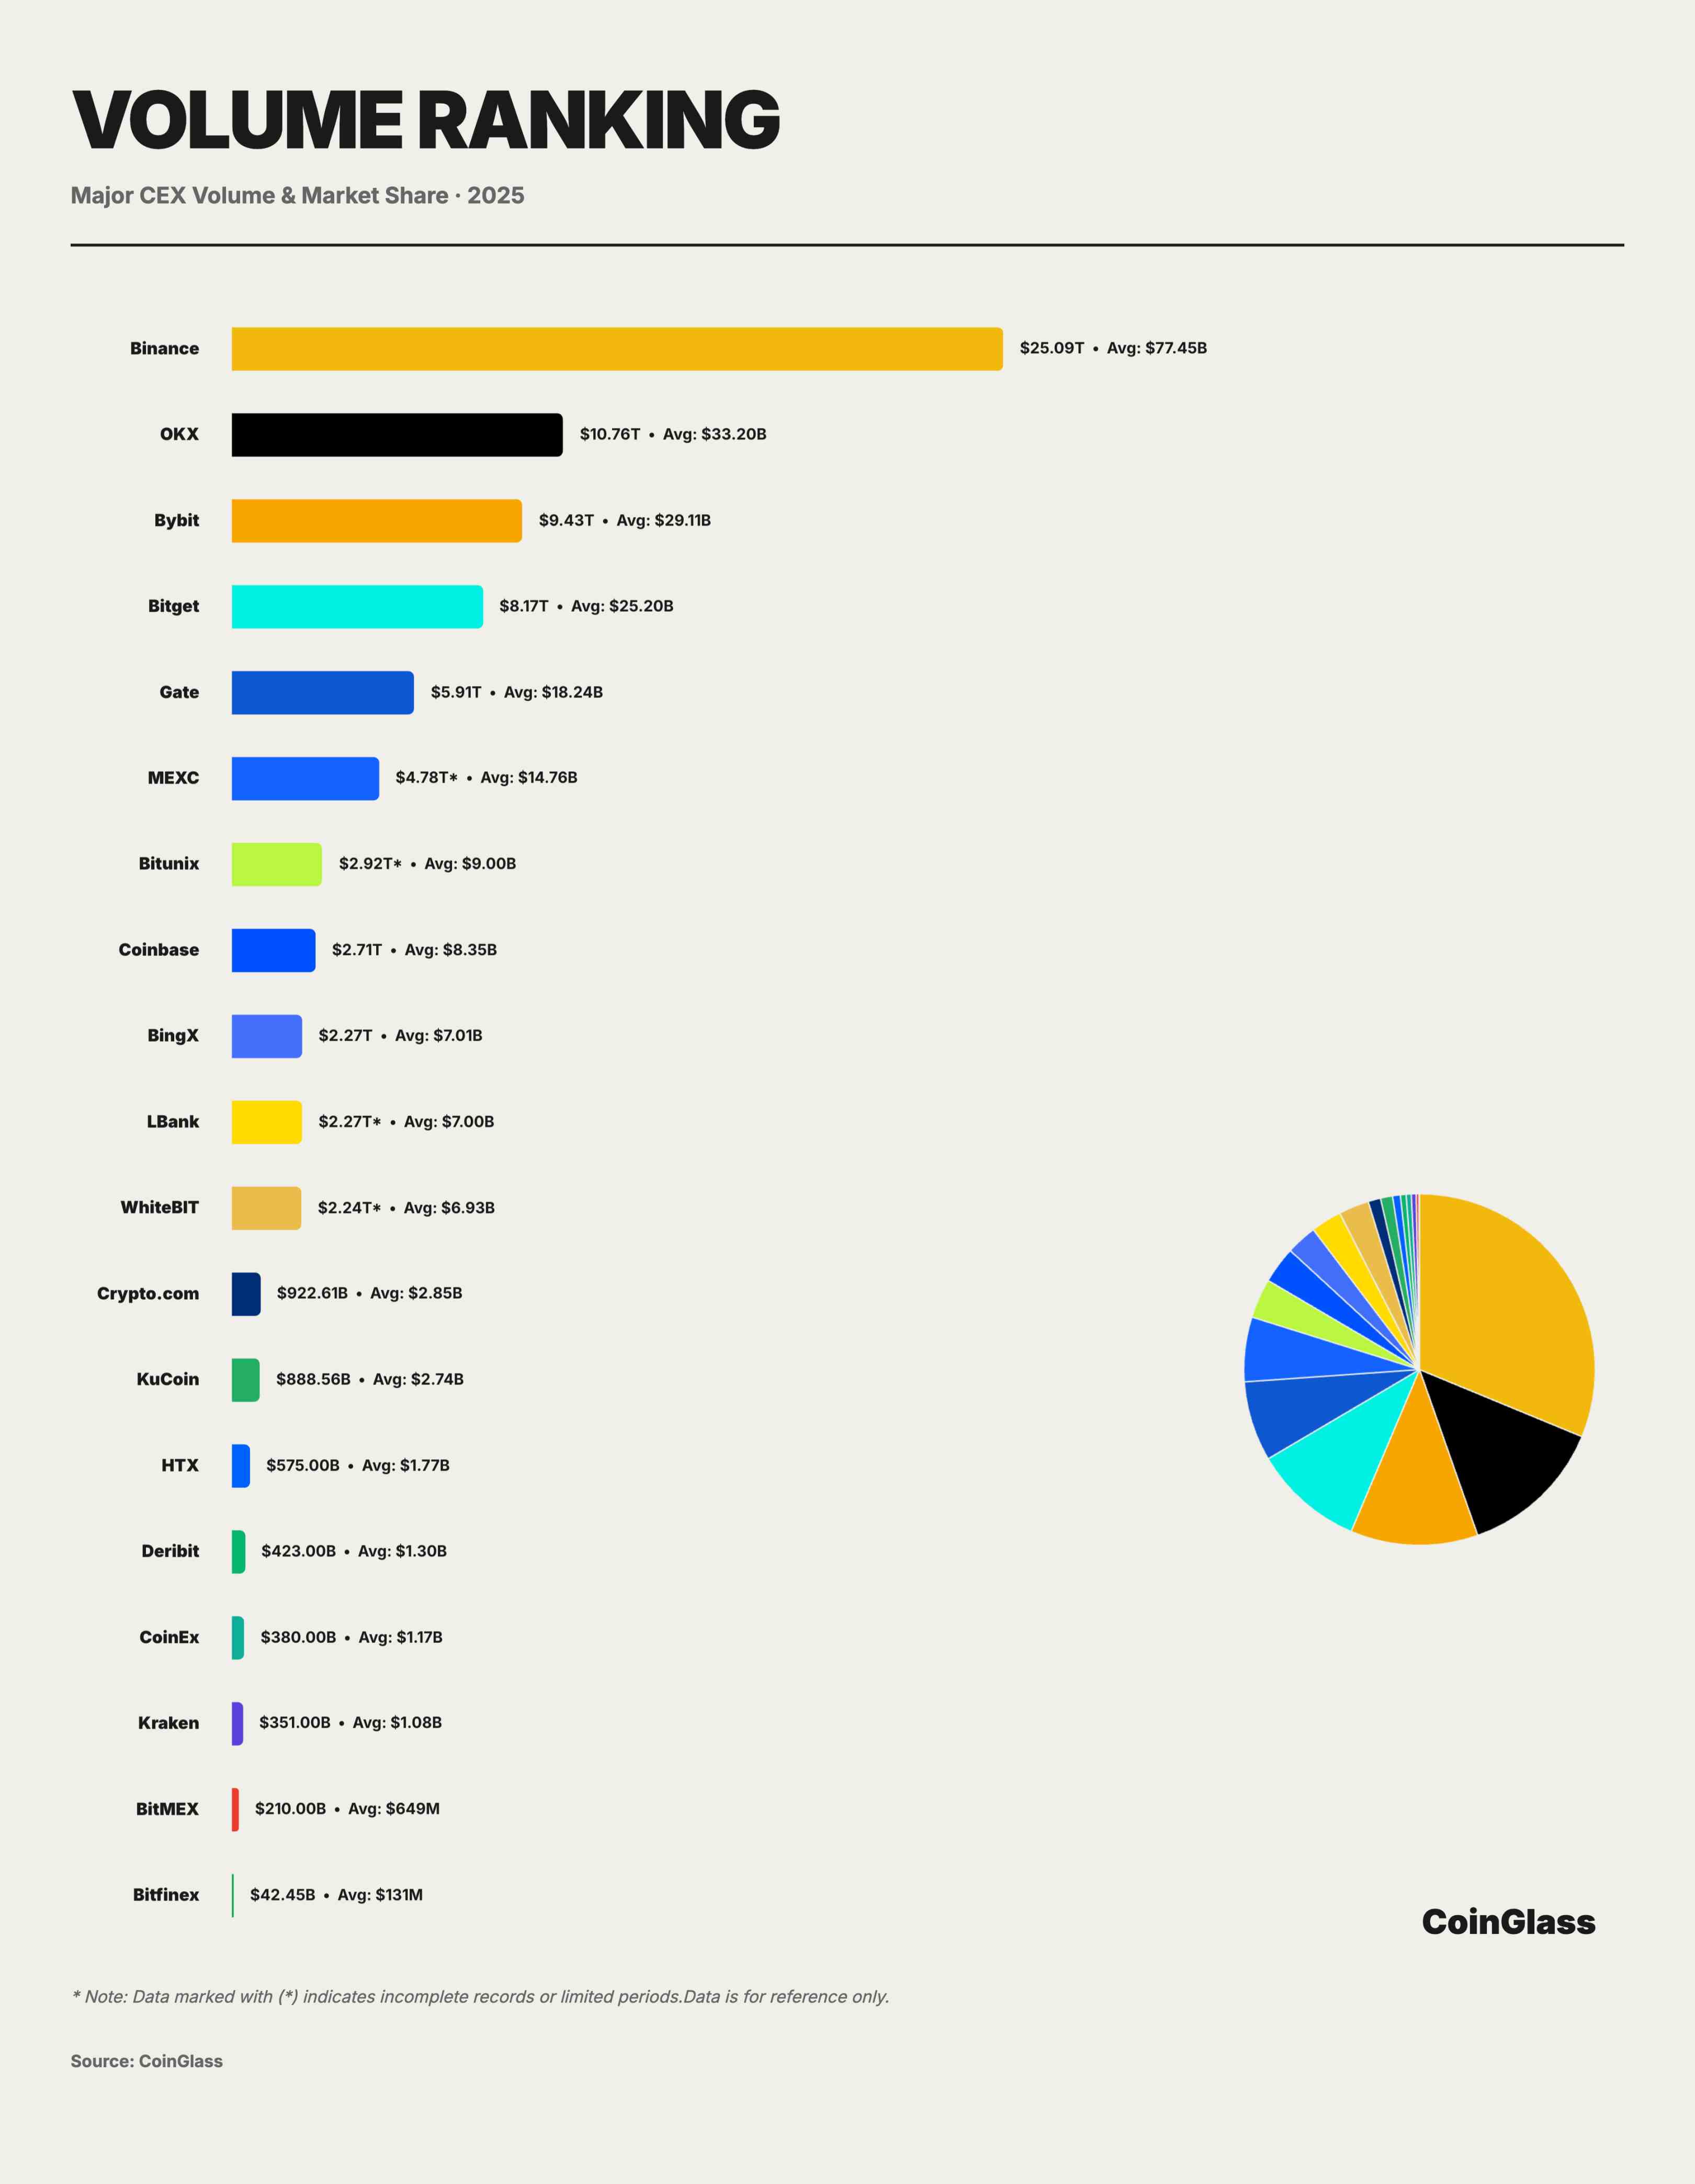
Beneath the $85.70T total volume and $264.5B daily average, market share distribution showed a highly concentrated structure. Binance firmly led the market with $25.09T in cumulative volume and $77.45B in daily average, capturing about 29.3% market share—meaning that for every $100 traded globally in derivatives, roughly $30 occurred on Binance.
The competitive landscape of the second tier showed distinct differentiation. OKX, Bybit, and Bitget followed closely, with cumulative volumes ranging from $8.2T to $10.8T and daily averages between $25B and $33B. Together with Binance, they accounted for about 62.3% of total market share. OKX ranked second with $10.76T total volume and $33.20B daily average, holding about 12.5% market share. Bybit followed with $9.43T total and $29.11B daily average, representing about 11%. Bitget ranked fourth with $8.17T total and $25.20B daily average, claiming about 9.5% market share.
Gate.io ranked fifth with $5.91T total and $18.24B daily average, bringing its market share down to about 6.9%. Despite being an established exchange, Gate’s gap with the top three is widening. More notably, a cliff exists after Gate: BingX’s $2.27T is less than 40% of Gate’s volume, while Crypto.com and KuCoin fell into the hundreds of billions ($922.61B and $888.56B), amounting to just 3–4% of Binance’s volume. Platforms like Crypto.com and KuCoin, as long-tail players, each hold around 1% market share, serving more regional or niche customer segments, with significantly weaker pricing power and liquidity stickiness compared to leaders. In terms of YoY and QoQ growth rates, Bitunix led in both metrics with the steepest growth curve, making it one of the fastest-growing platforms in trading volume.
This cliff-like distribution reveals the Matthew effect in platform economies, where leading platforms reinforce their dominance through liquidity advantages. For smaller platforms, establishing differentiated positioning in niche markets is essential; otherwise, they face ongoing market share erosion.
CEX Derivatives Open Interest
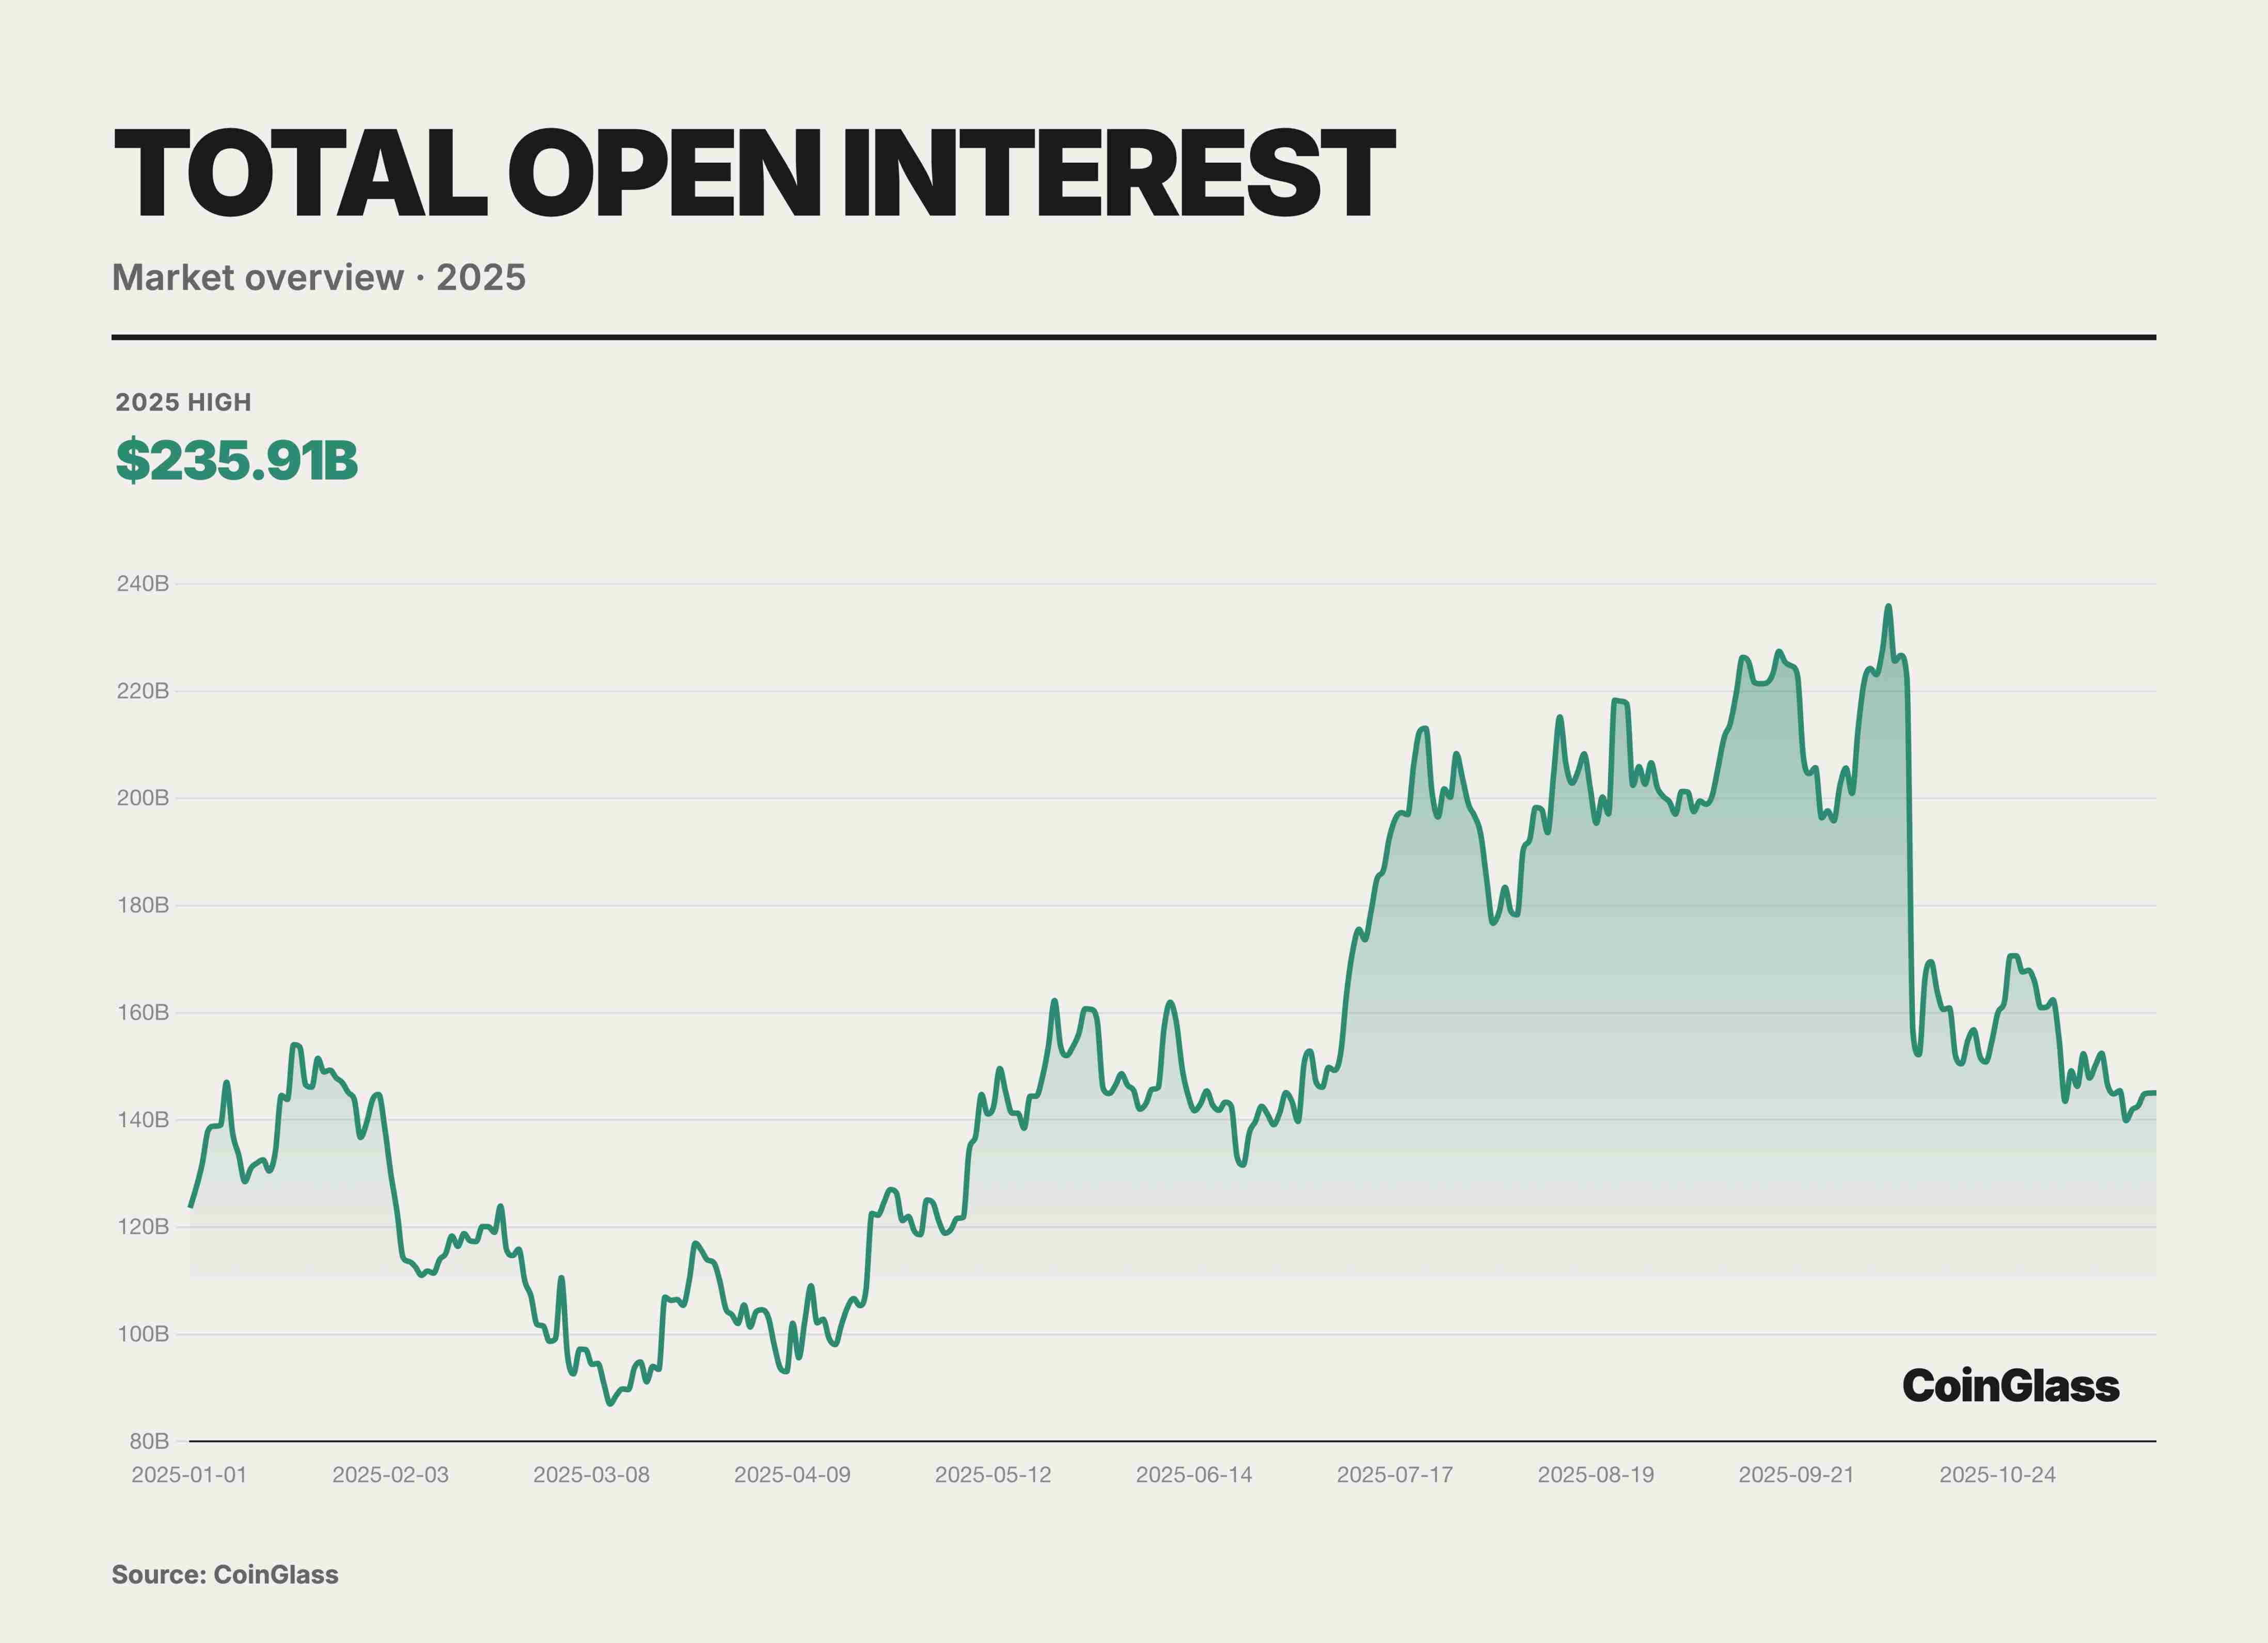
In 2025, global crypto derivatives open interest (OI) followed a volatile path—initially suppressed, then sharply rebounding before a sudden plunge. The market experienced deep deleveraging in Q1, with OI hitting a yearly low of $87 billion amid panic. However, it quickly showed strong resilience in Q2, rebuilding confidence from cautious probing to moderate position building. This recovery turned into an almost frenzied accumulation of leverage in Q3, with capital inflows pushing OI steadily higher until it reached a record high of $235.9 billion on October 7. The highly crowded trade structure significantly increased the probability and severity of market correction. In early Q4, a flash deleveraging event wiped out over $70 billion in positions—about one-third of total OI—in just one day. Nevertheless, the remaining OI of $145.1 billion was still 17% higher than年初 levels, with second-half capital deployment significantly exceeding the first half.
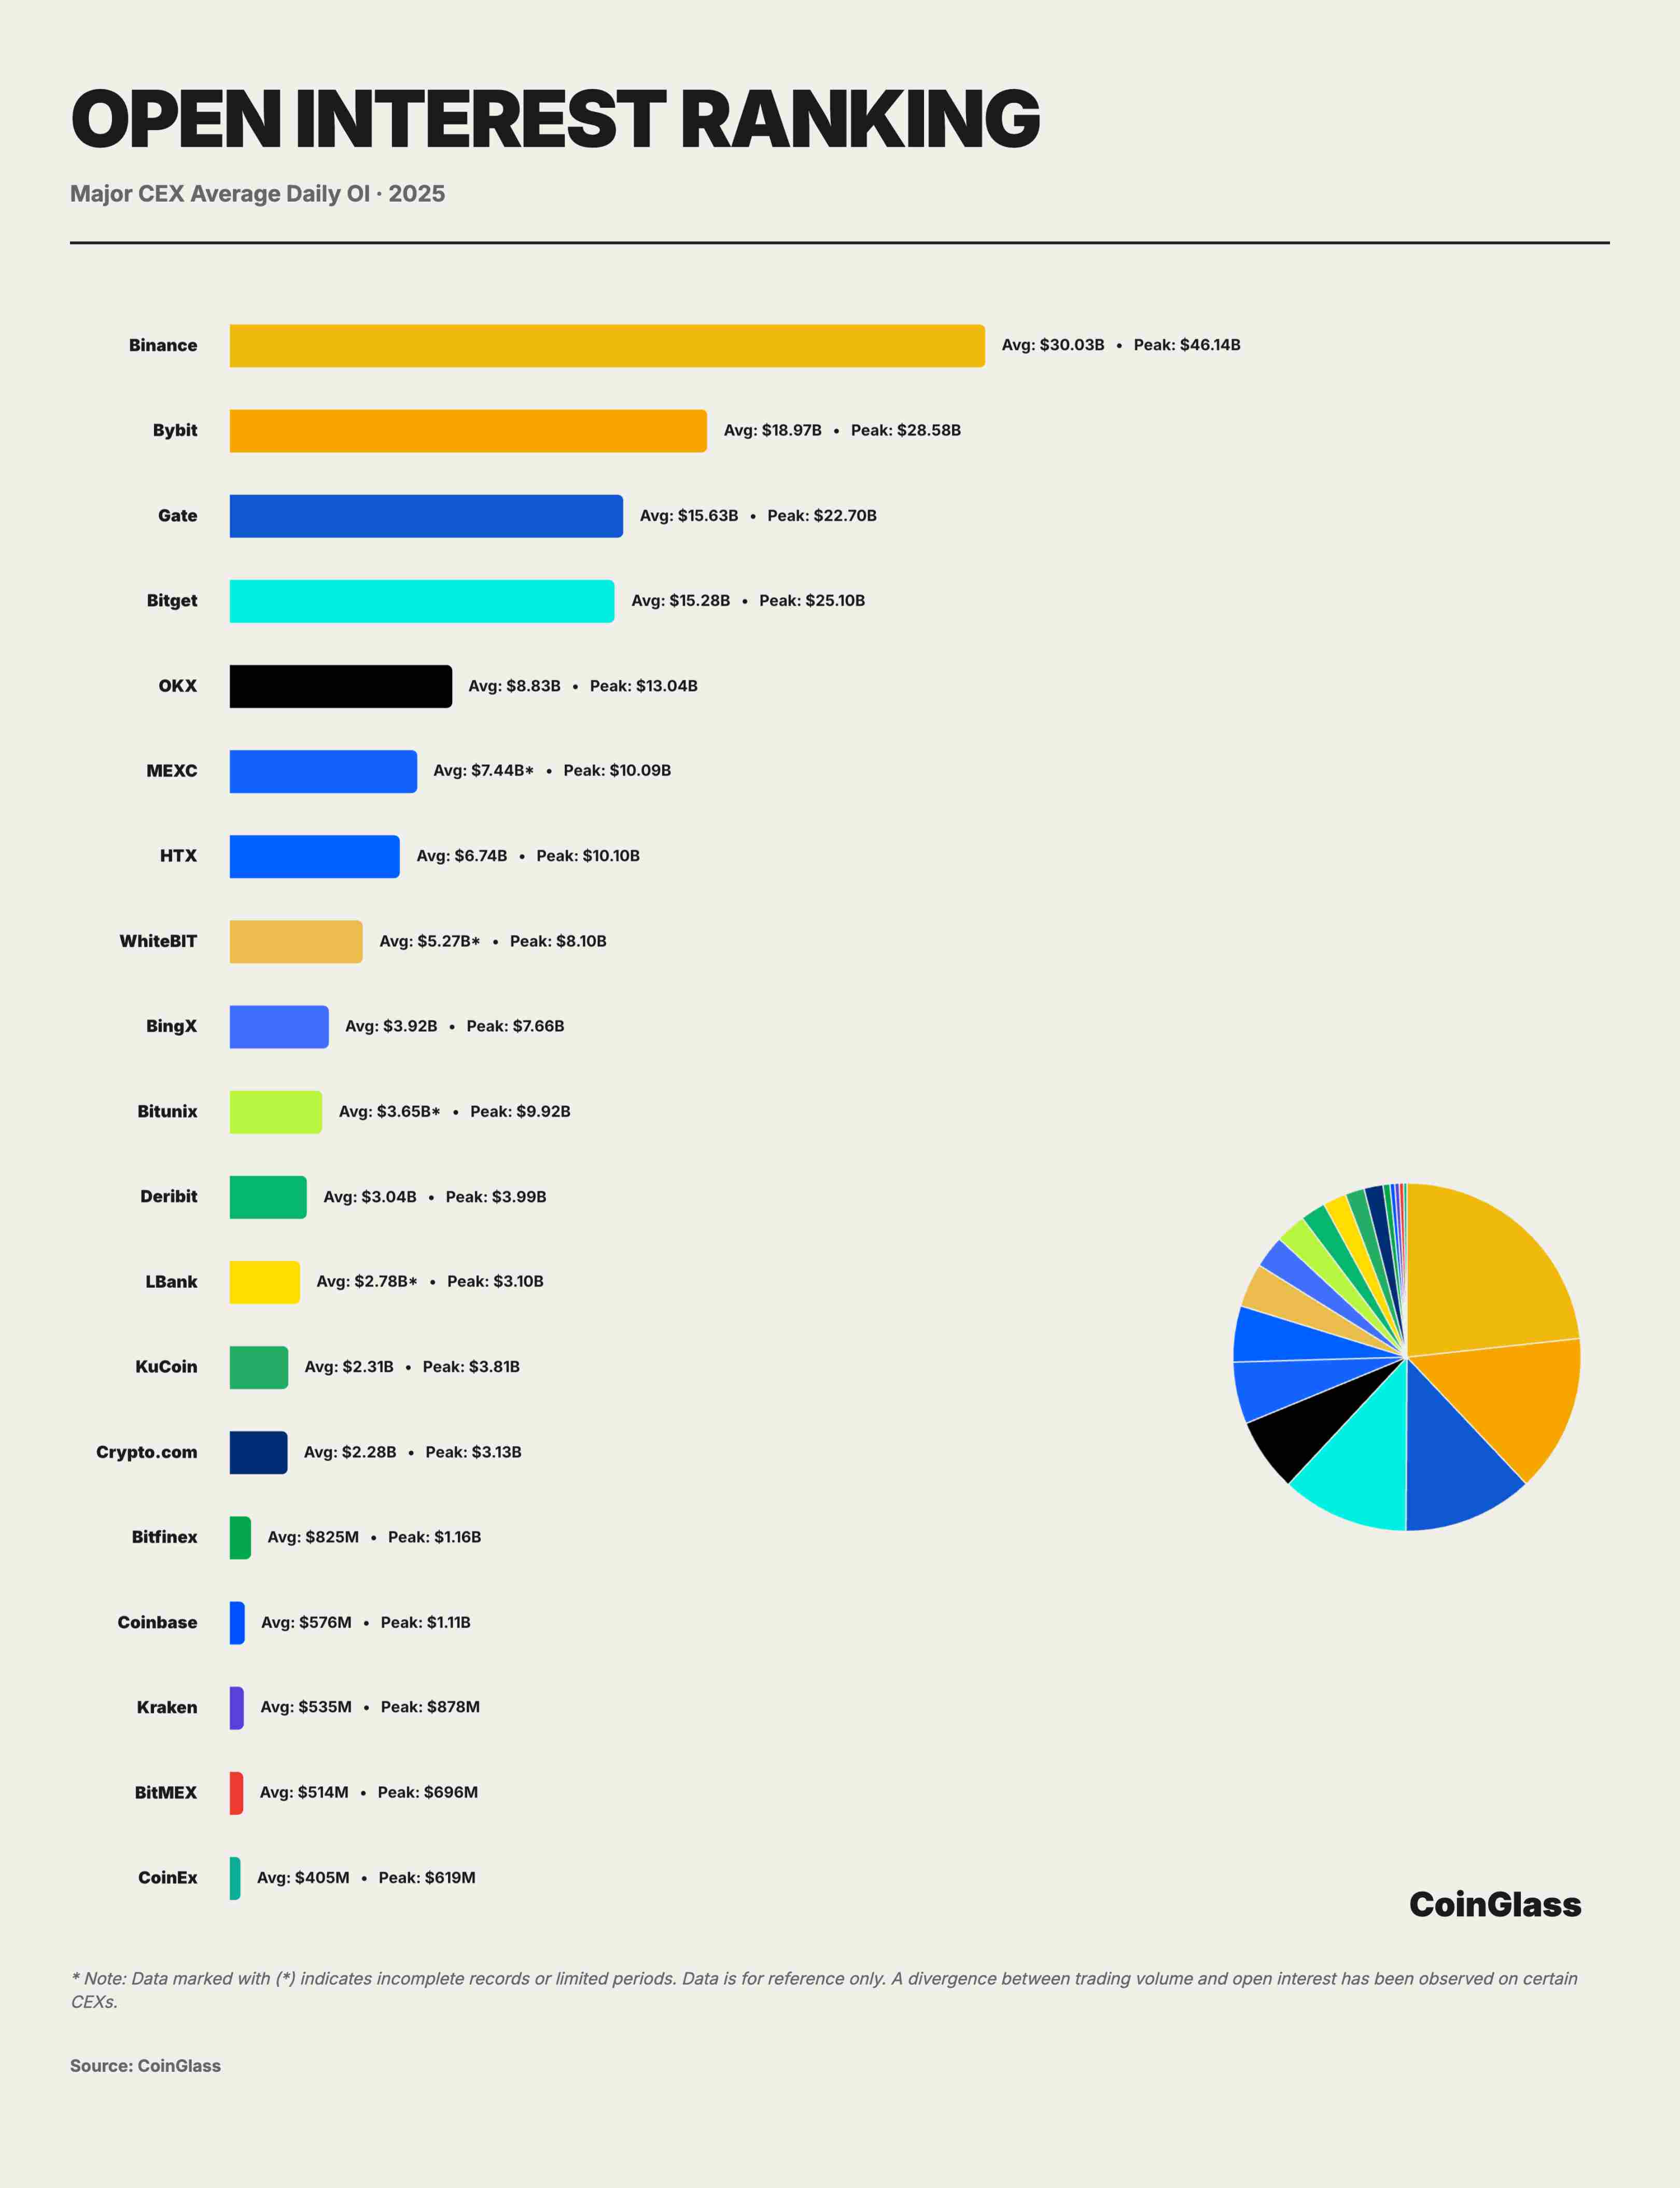
Based on 2025 daily average OI data from major CEXs, the global derivatives market has solidified into a clearly stratified oligopoly. The top ten centralized exchanges held a combined OI of about $108.3 billion. Binance led with ~$30 billion in daily average OI (~28%), followed by Bybit, Gate, and Bitget at ~$19B, ~$15.6B, and ~$15.3B respectively. Together, the top four controlled about 73% of all tradable leveraged positions. Adding OKX, the top five accounted for over 80% market share—indicating extremely high concentration. Binance established a dominant lead with ~$30 billion in average OI, nearly equal to the sum of second and third places, playing a decisive role as the cornerstone of market liquidity. Behind it, Bybit, Gate, and Bitget formed a second-tier group, each maintaining daily average OI between $15B and $19B, collectively controlling half the market. Gate and Bitget were particularly close, differing by only ~$300 million on average, reflecting intense competition for market share.
OKX’s lower OI figure stems partly from its product architecture offering higher capital utilization, enabling rapid rotation of funds across spot, wealth management, staking, and other non-trading modules. Thus, OI fails to fully reflect true capital depth. Additionally, some platforms show divergence between trading volume and OI. Investors should pay closer attention to trade structure and capital distribution rather than relying solely on OI metrics.
CEX Liquidity Depth
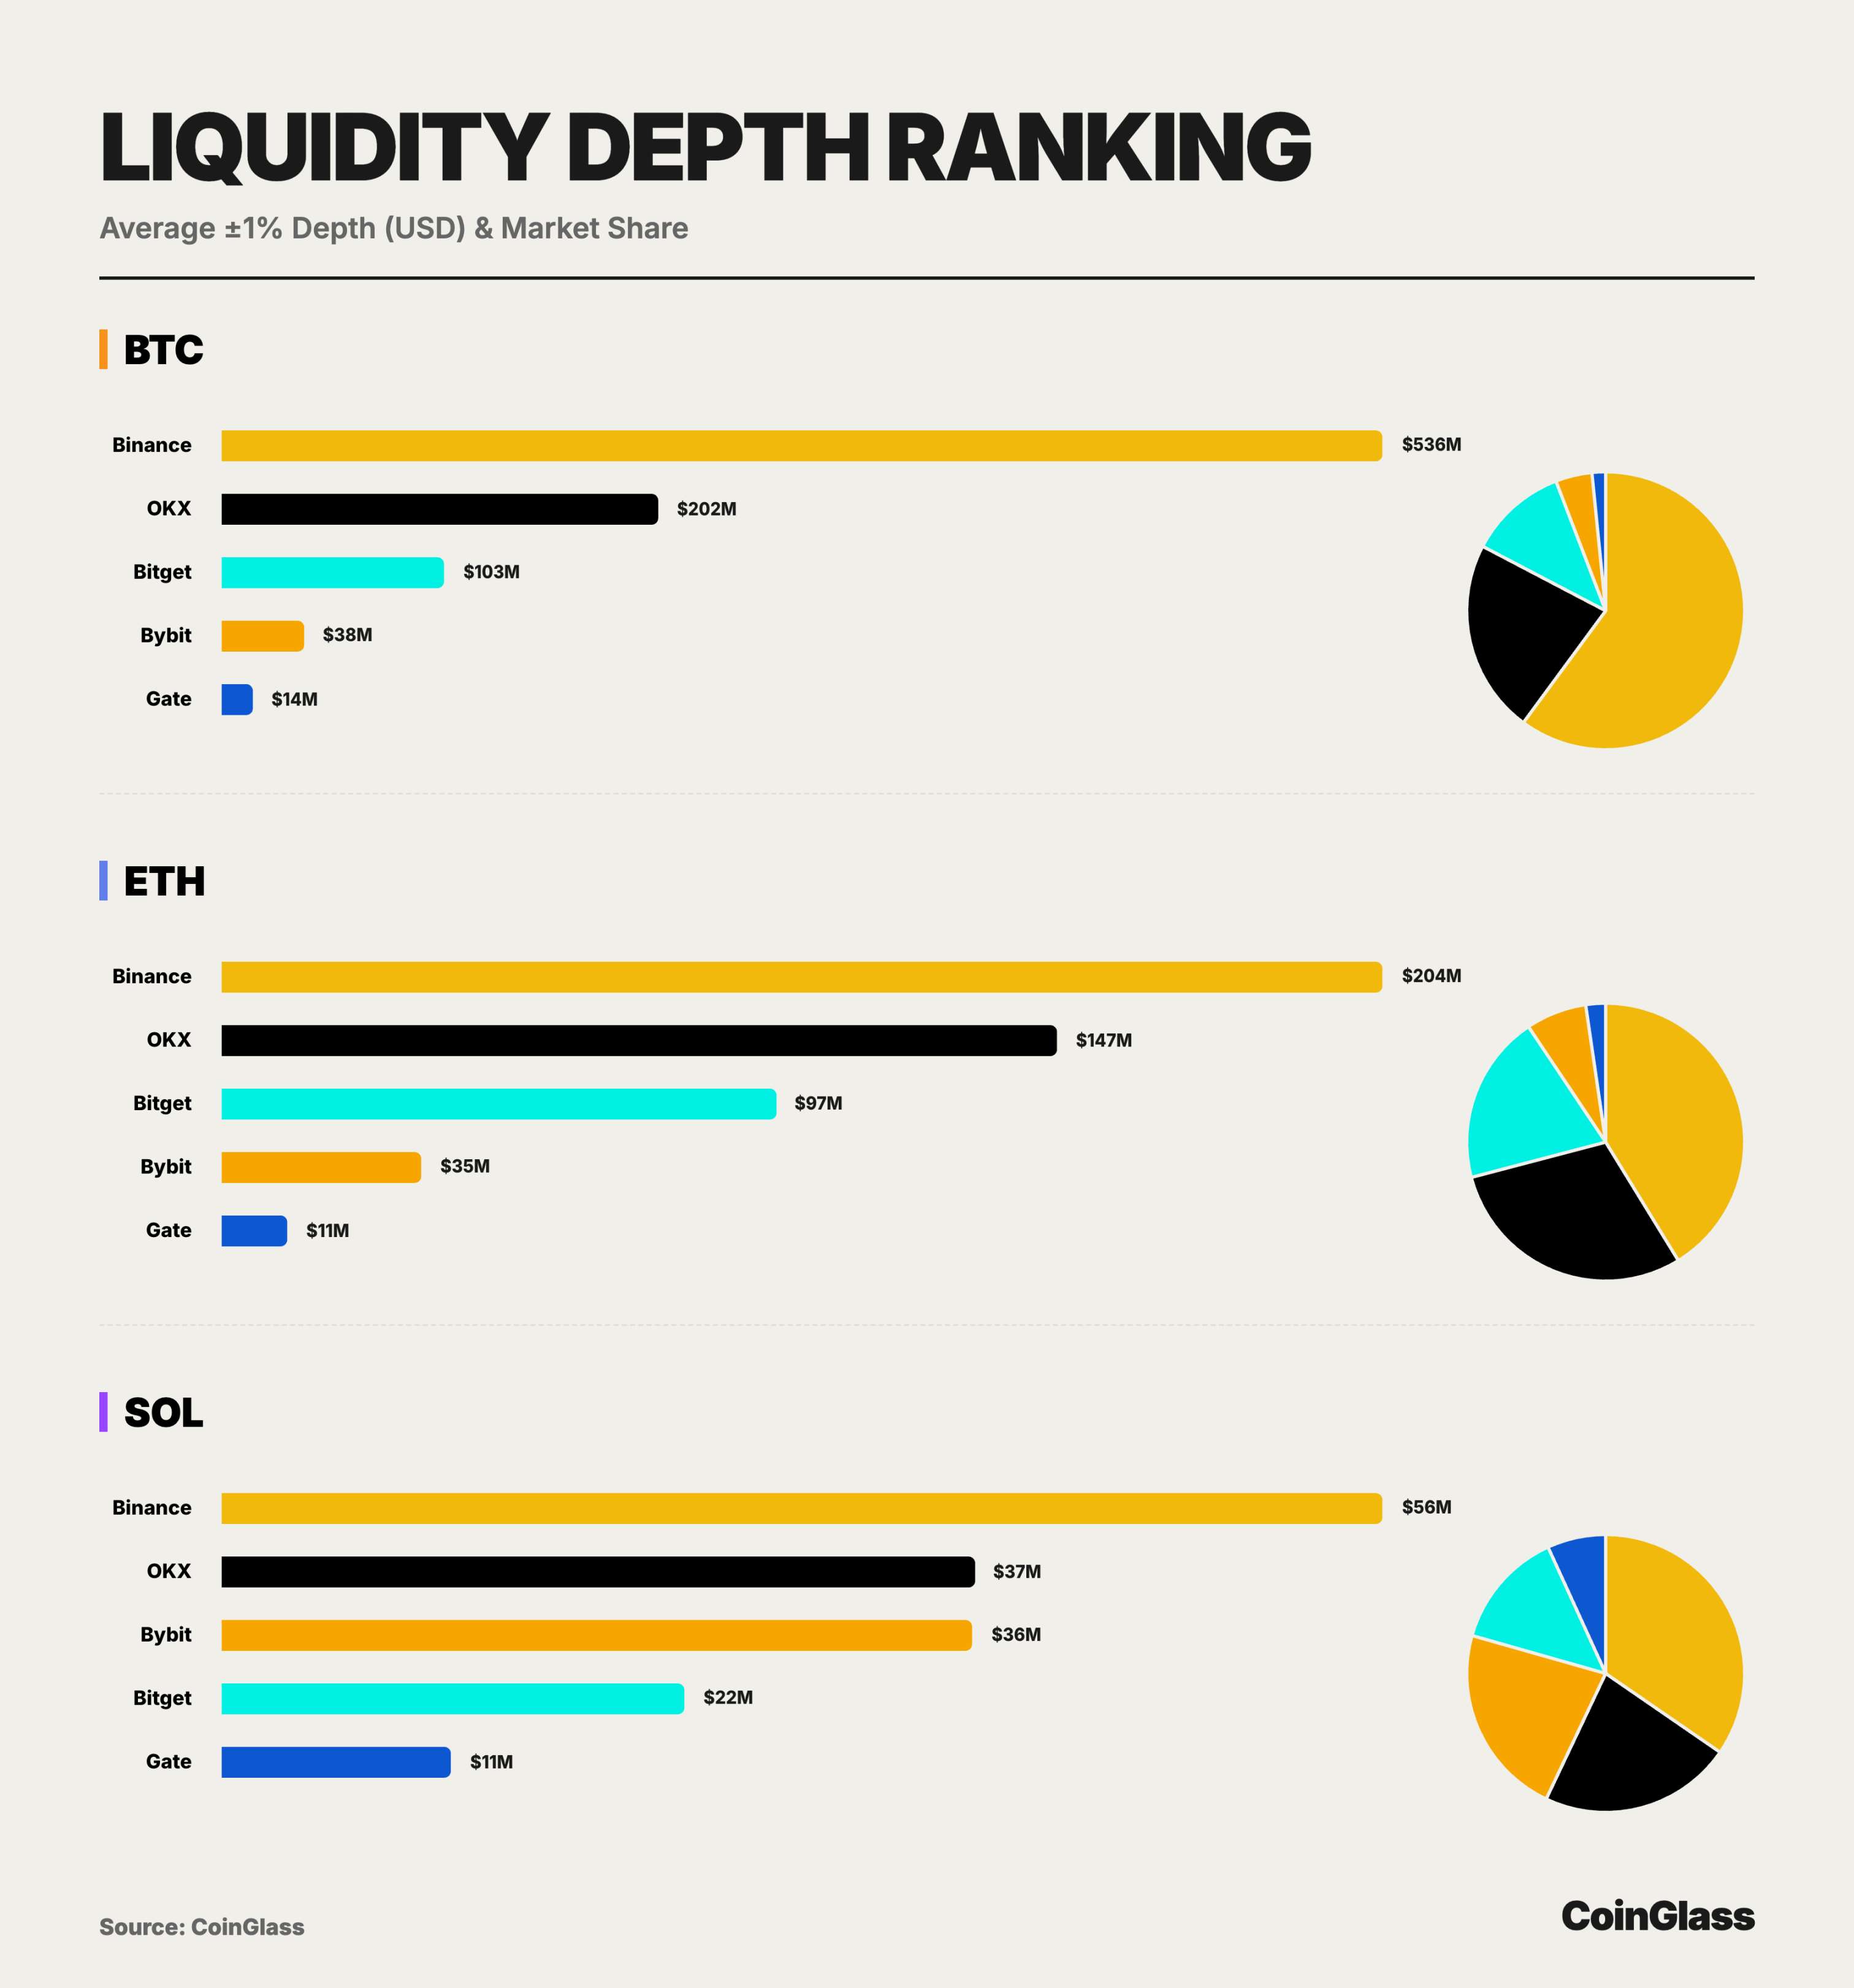
Based on bilateral liquidity depth data for major assets (BTC/ETH/SOL) in 2025, the market structure diverged significantly from OI patterns. Binance dominated unchallenged, with $536 million in BTC depth—2.6x that of the second-place platform and nearly equal to the combined depth of the next four platforms—establishing its absolute status as the global liquidity hub for crypto derivatives. OKX demonstrated strong capability in handling large orders with $202 million BTC depth and $147 million ETH depth, confirming its position as the preferred choice for institutions and whales after Binance.
For BTC, Bitget ranked third with ~$103 million in bilateral depth—about 2.7x Bybit’s and 7x Gate’s—contributing nearly 11.5% to total market BTC depth. For ETH, Bitget’s ±1% depth reached ~$97.48 million, approaching 70% of OKX’s level and far exceeding Bybit and Gate, contributing nearly 20% to total ETH depth. This resulted in a liquidity structure where Binance leads decisively, OKX holds a firm second place, and Bitget consistently occupies a core position in the second tier. Even in SOL, which has relatively weaker overall liquidity, Bitget provided over $22.42 million in ±1% depth—about 60% of OKX and Bybit’s levels—accounting for ~14% of total SOL market depth, demonstrating considerable order absorption capacity even in volatile, longer-tail mainstream assets.
CEX User Asset Deposits
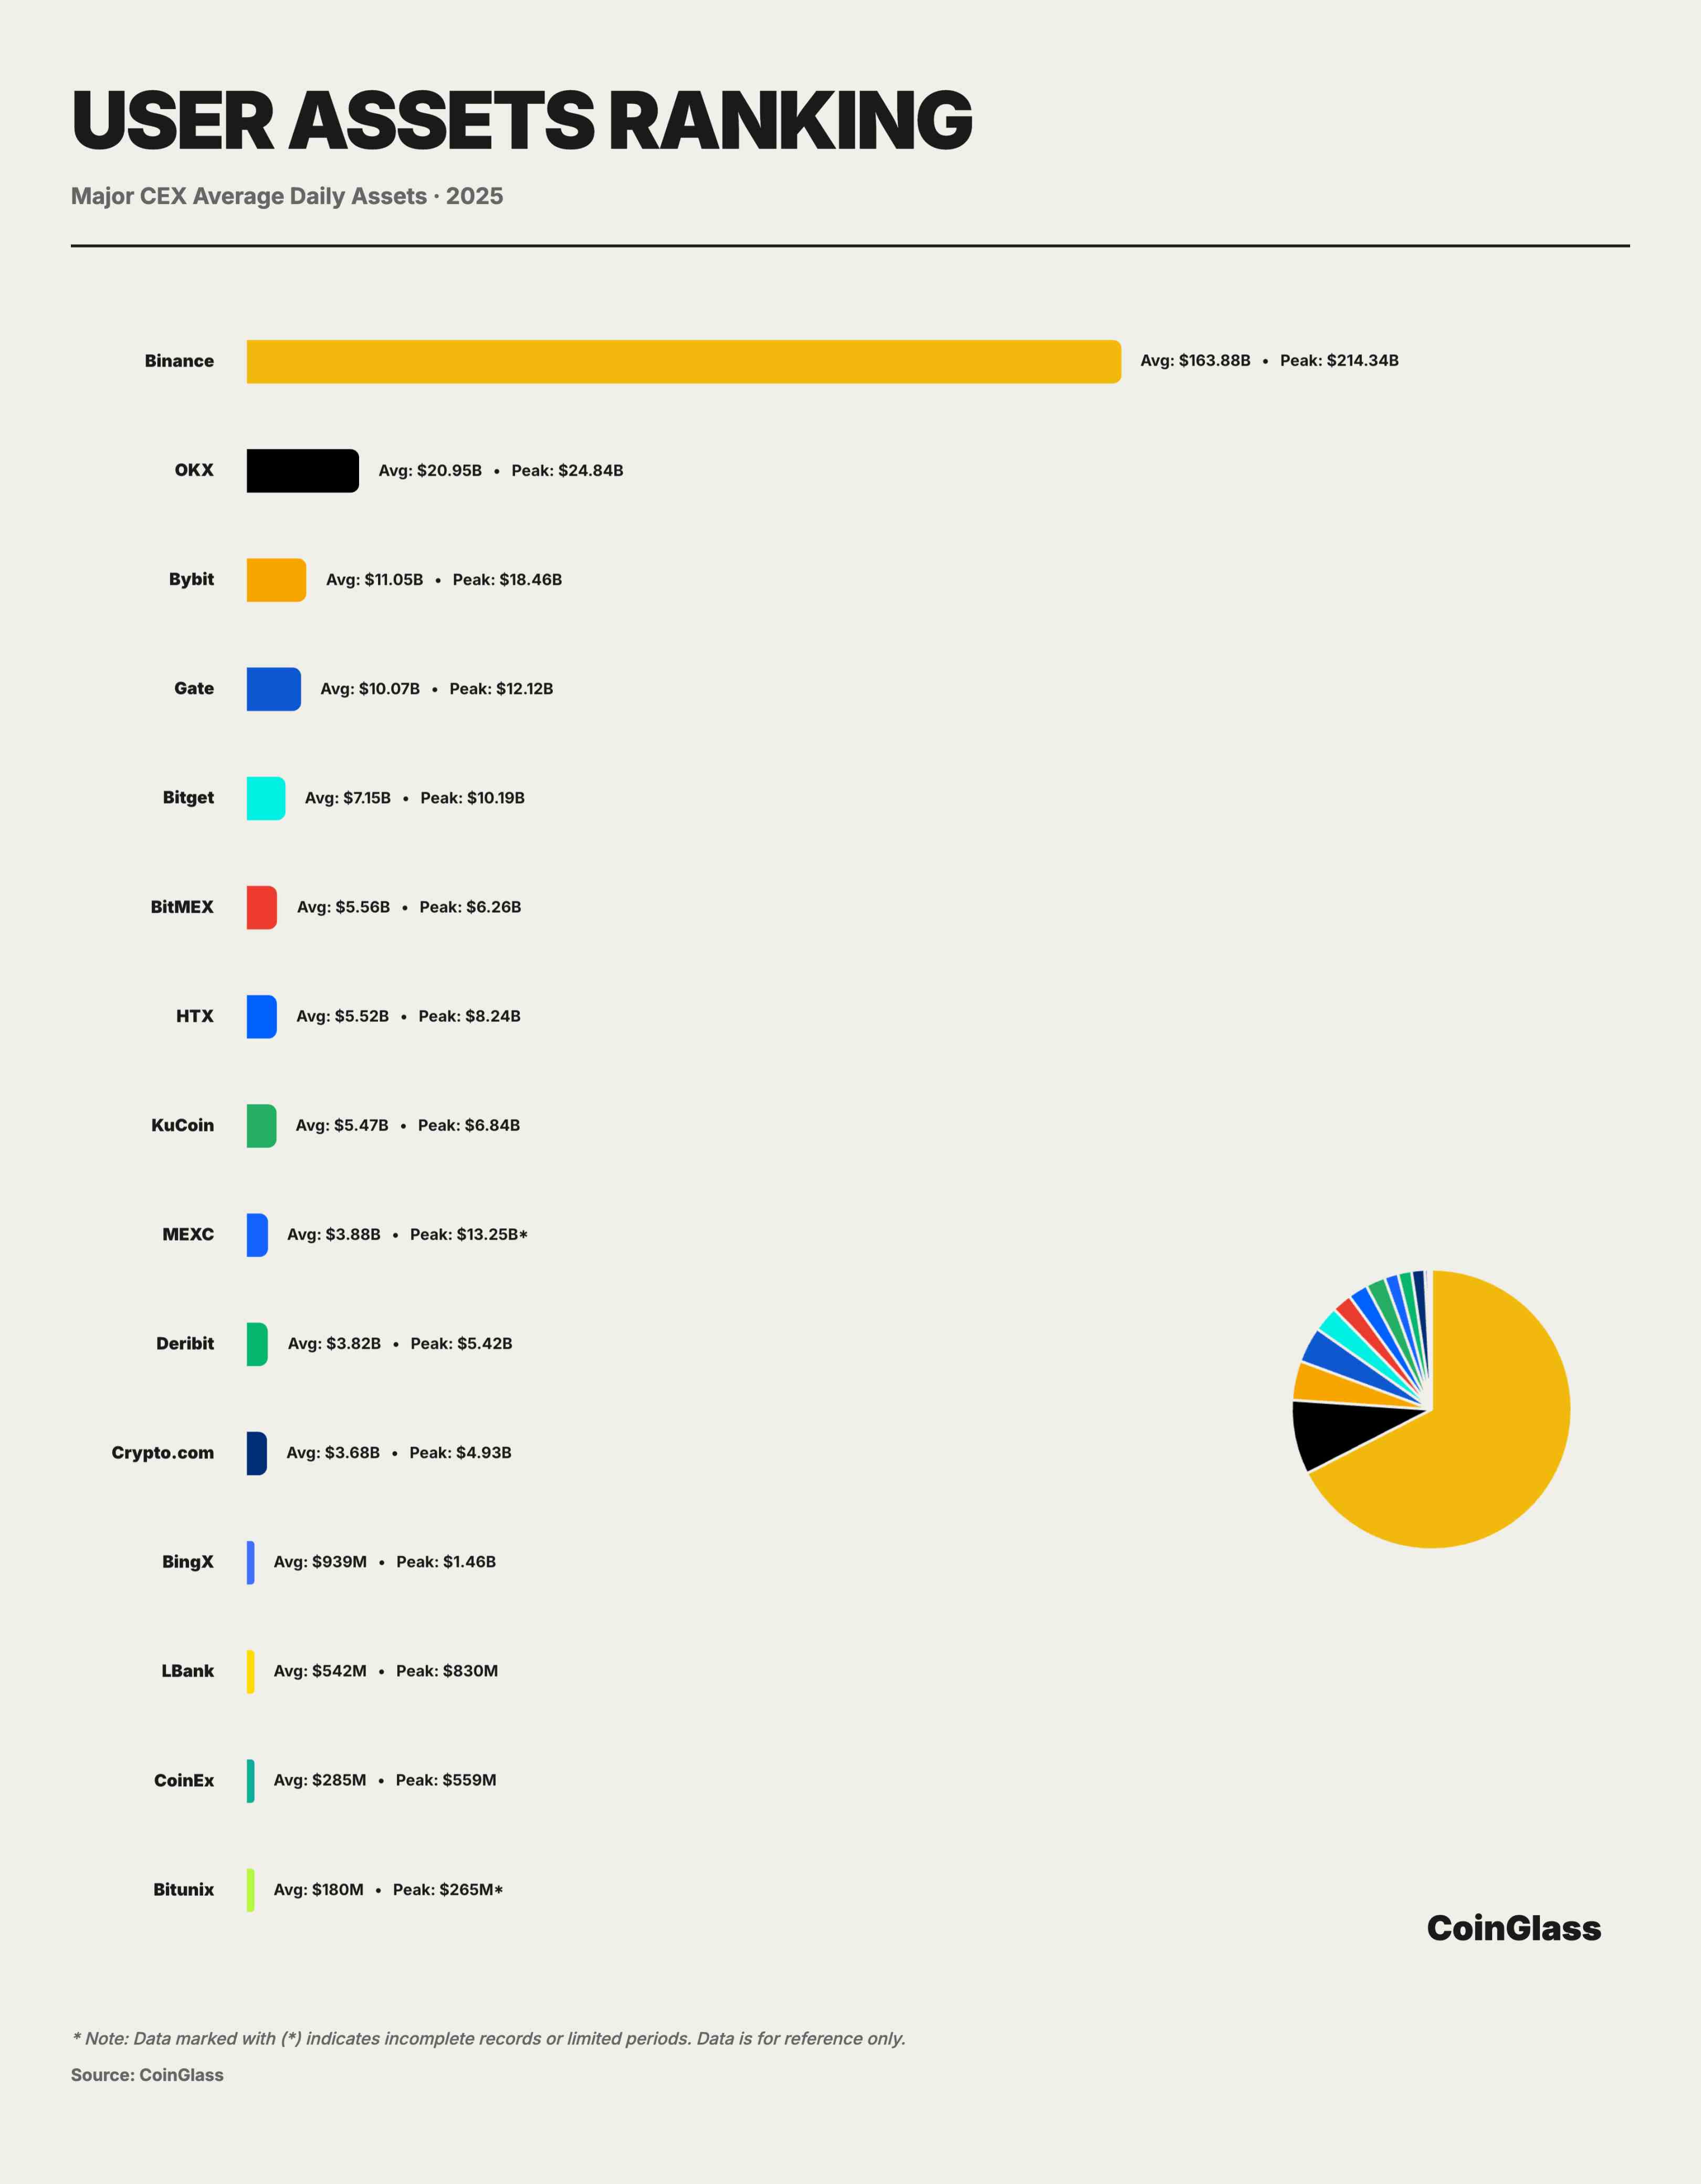
Based on 2025 user asset deposit data, the crypto market exhibits a highly concentrated unipolar structure in custody. Calculated using the Herfindahl-Hirschman Index, CEX asset concentration reached 5352 in 2025, indicating an extremely oligopolistic state. Binance alone dominates, holding over 72% market share. Its average daily custodied assets reached ~$163.9 billion, peaking at ~$214.3 billion—over 2.5x the combined assets of the next seven major platforms. This degree of concentration means Binance effectively functions as a “systemic infrastructure,” with its operational and compliance status having amplified effects on the entire crypto market’s stability.
OKX ranked second with ~$21 billion in average daily assets and a peak of $24.8 billion, about twice the size of third-place Bybit, highlighting its strength in user fund retention and medium-to-long-term asset accumulation. However, this bipolar plus mid-tier structure concentrates custody risks heavily in the top two platforms. A tail event at either platform—due to compliance, technical, or operational failure—would have spillover effects far exceeding their standalone market shares. After the second tier, the market enters a fiercely competitive hundred-billion-dollar range. Bybit, Gate, and Bitget held average daily assets of ~$110.5B, ~$100.7B, and ~$71.5B respectively, forming a secondary asset-holding layer. The top five platforms collectively absorbed over 90% of user assets, showing extreme concentration.
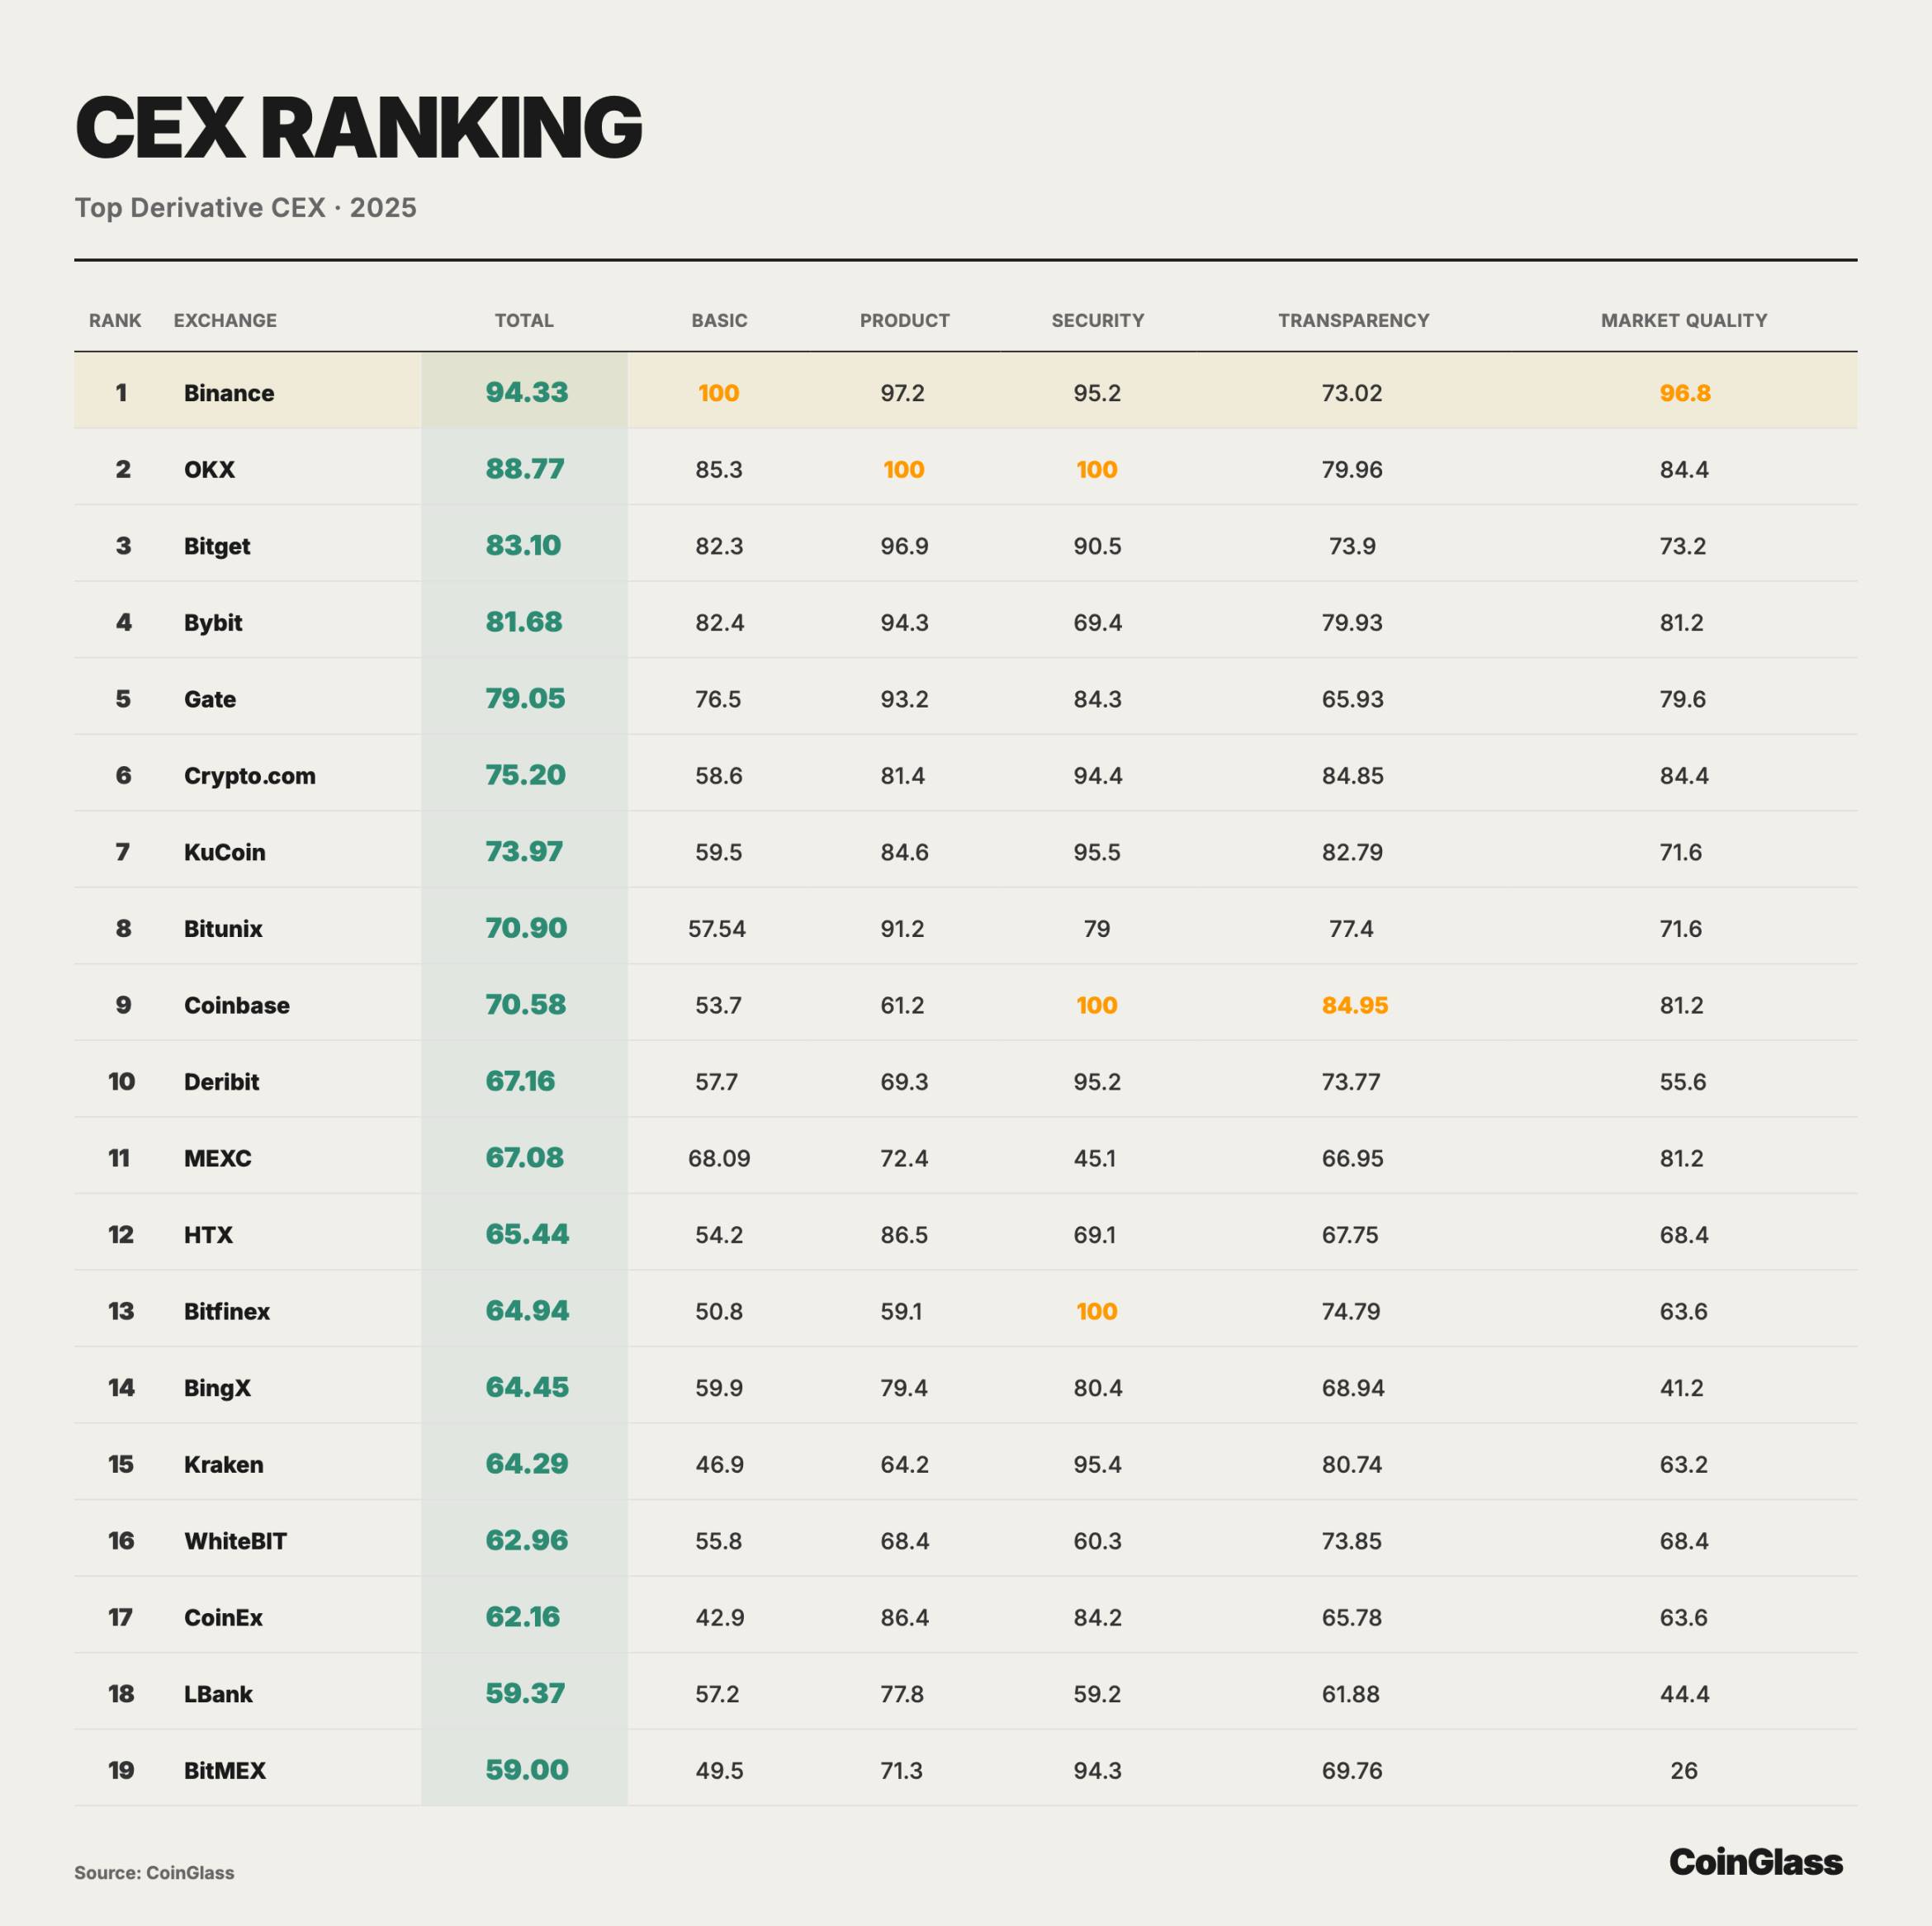
CEX Rankings
To evaluate the quality dimensions behind the volume-based dominance of CEX derivatives, CoinGlass conducted a comprehensive scoring and ranking of major derivatives CEXs. The following chart uses core trading data as primary weights and provides sub-scores and weighted totals across dimensions such as product offerings, security, transparency, and market quality, visually presenting structural differences among platforms in liquidity capacity, risk control constraints, and information disclosure.
Liquidation Data
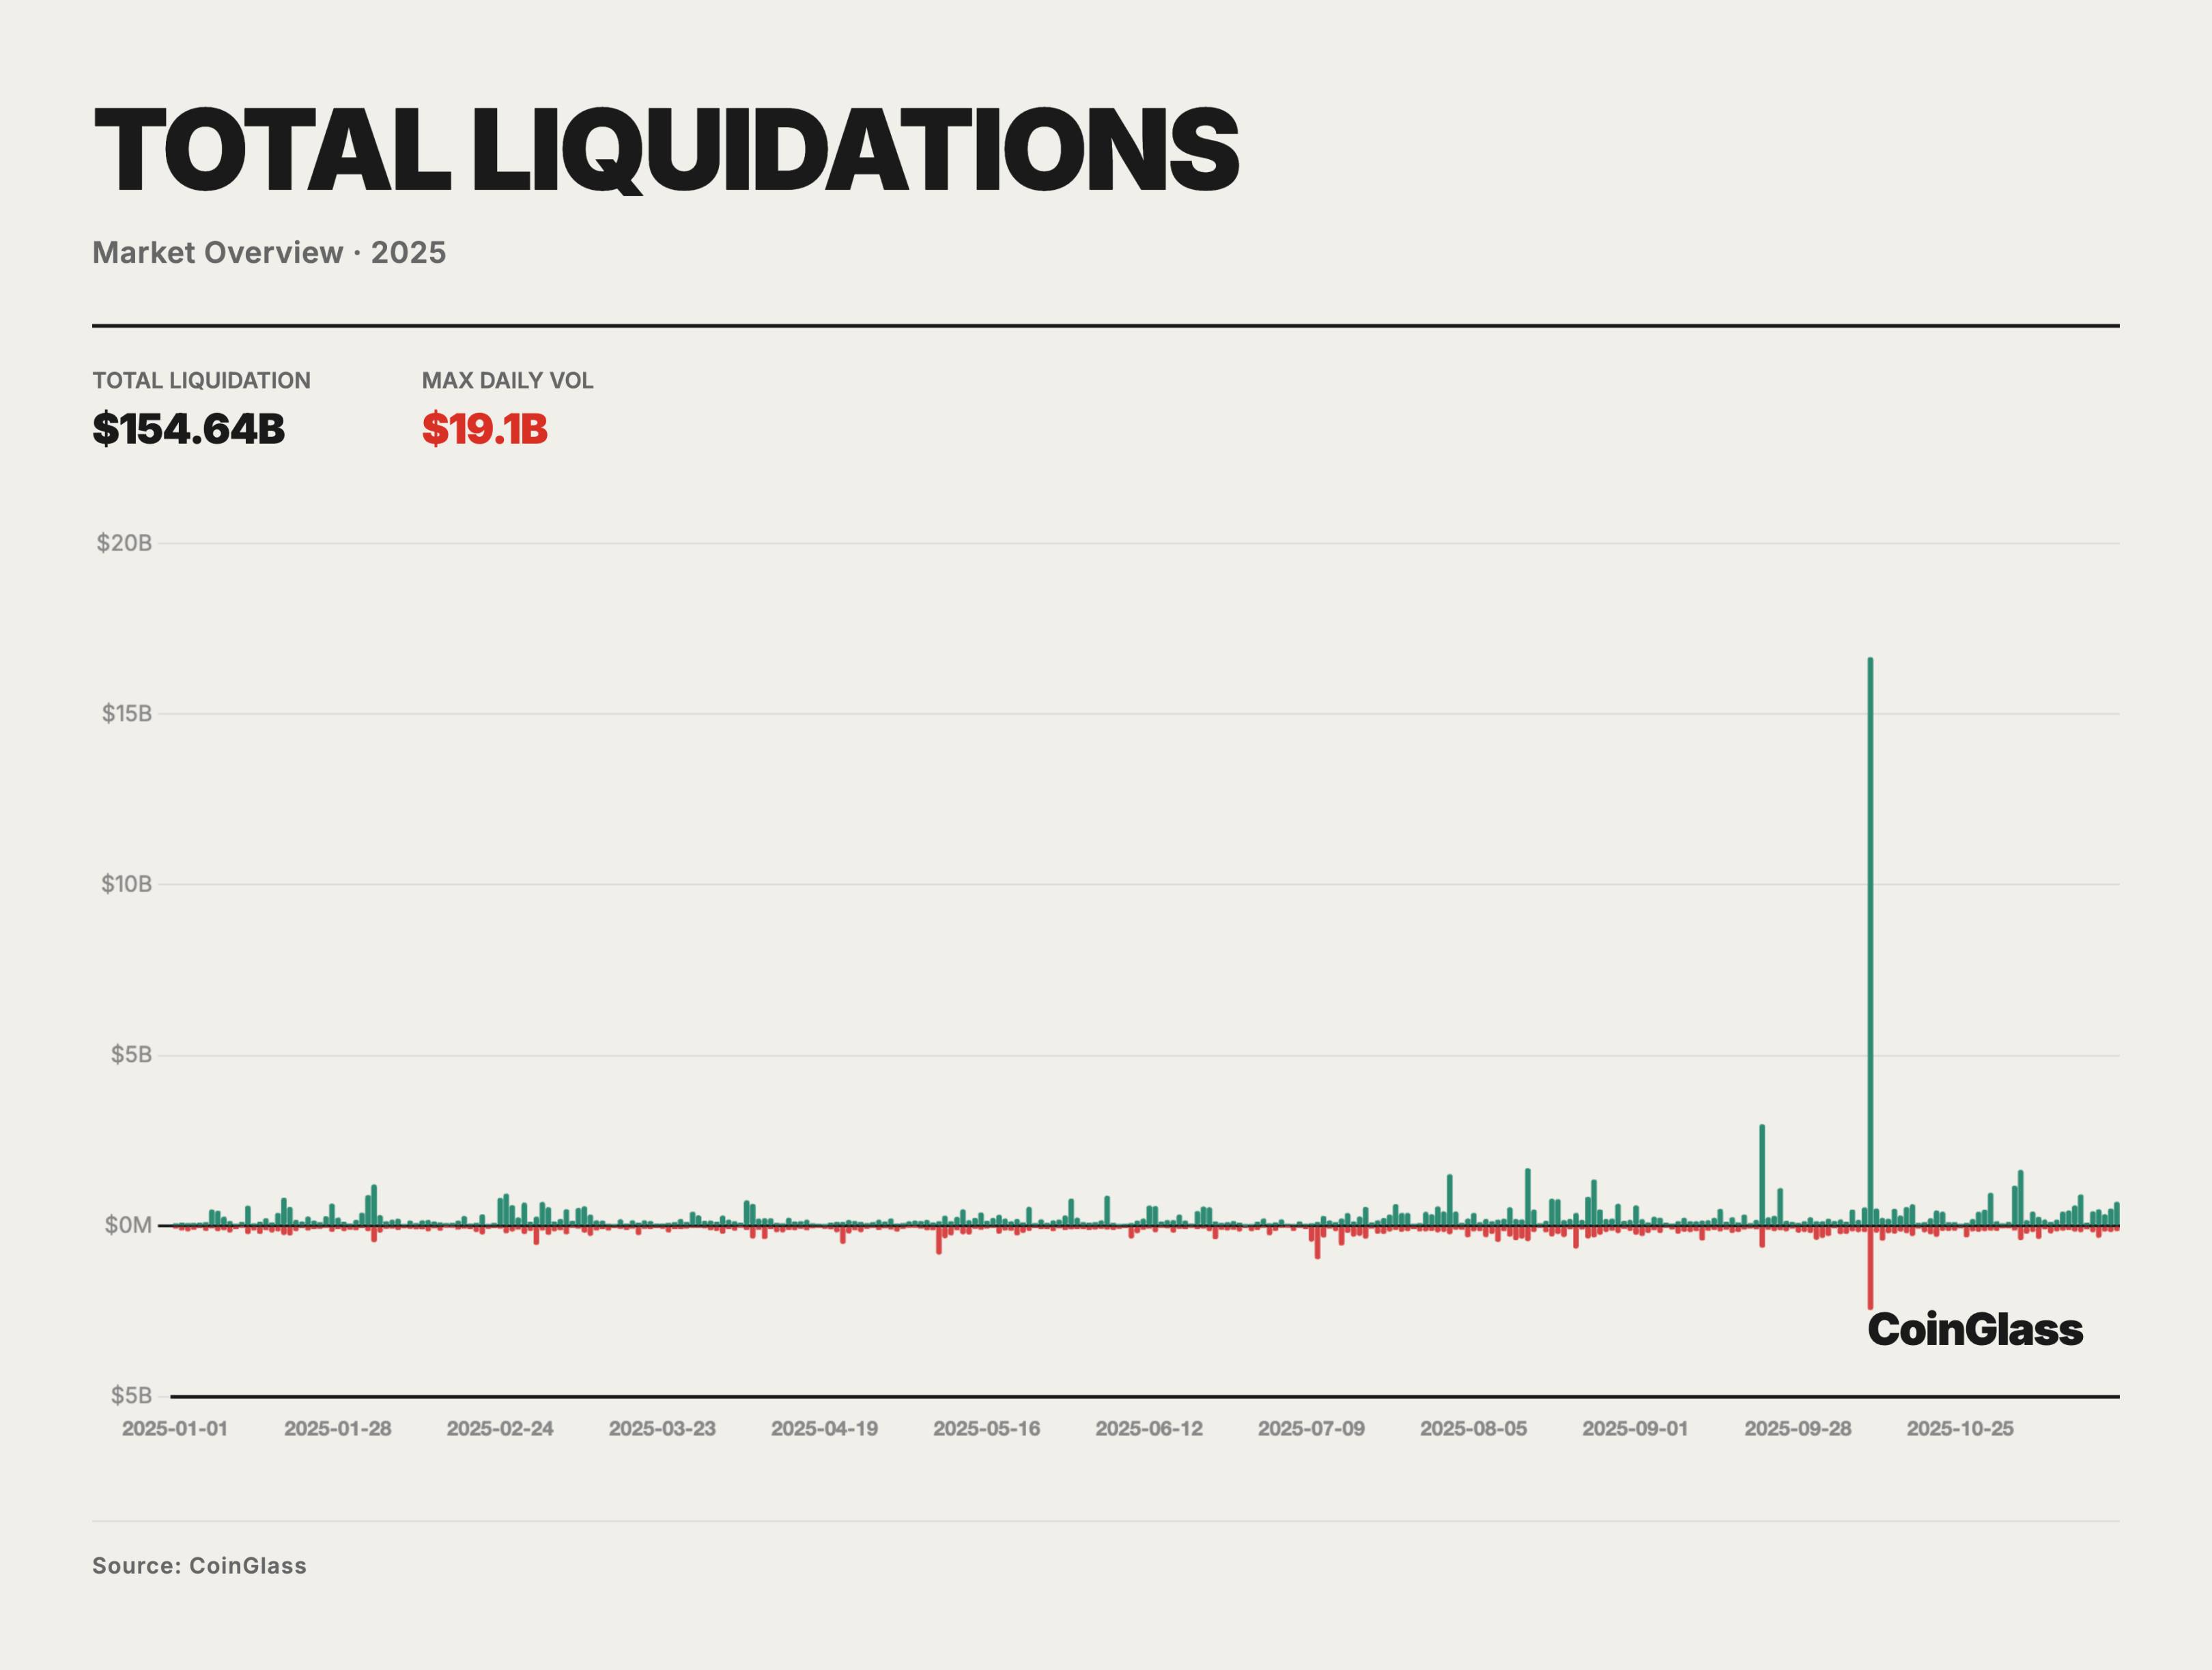
In 2025, the total notional value of forced liquidations across long and short positions was approximately $150 billion, averaging about $400–500 million per day in routine leverage resets. On most days, liquidation sizes remained in the tens of millions to hundreds of millions, reflecting regular margin adjustments and short-term position unwinding under high leverage, with limited long-term impact on price and structure. Systemically significant stress was concentrated in a few extreme event windows, with the October 10–11 deleveraging episode being the most representative.
On October 10, 2025, the market saw an extreme peak in liquidation volume, with total long and short liquidations exceeding $19 billion—far surpassing previous single-day highs. Based on partial platform disclosure timing and market maker feedback, the actual nominal liquidation scale may have approached $30–40 billion, several times larger than the previous cycle’s second-highest event. Structurally, liquidations were heavily skewed toward longs, accounting for about 85–90%, indicating that BTC and related derivatives markets were in an extremely crowded long-leveraged state prior to the event.
Causally, the 10·10–10·11 event was triggered by an exogenous macro shock. On October 10, President Trump announced a 100% tariff on Chinese imports effective November 1 and plans to restrict exports of critical software, sharply raising expectations of a new high-intensity trade war. Global risk assets immediately shifted into a clear risk-off mode. Prior to this, BTC had already hit a record high of ~$126,000 in 2025, driven by loose monetary expectations and expanding risk appetite. Derivatives markets exhibited high long leverage utilization, elevated spot-futures basis, and the entire system was effectively in a fragile state of high valuation and high leverage. The arrival of negative macro news acted as the direct spark igniting the concentrated liquidation chain.
What truly determined the magnitude of the impact was the pre-existing leverage and product structure, along with the design of liquidation mechanisms. Compared to three or four years ago, 2025 featured many more perpetual contracts with high open interest, more small-cap assets, and more large platforms—leading to significantly higher nominal leverage. Simultaneously, many institutions employed complex strategies involving long-short hedging, cross-asset, and cross-tenor positions, appearing “risk-neutral” on the surface but heavily reliant on orderly operation of liquidation engines and ADL mechanisms under extreme conditions—tail risks were inadequately managed. Once liquidation and risk management mechanisms deviated from ideal trajectories under stress, offsetting hedges could be mechanically dismantled, forcing combinations built as neutral or low-net-exposure into high-net-directional positions.
After prices breached key margin thresholds on October 10, standard mark-to-market liquidation logic initiated first, dumping numerous undercollateralized longs into the order book for market-price liquidation, triggering the first wave of concentrated deleveraging. As order book liquidity rapidly depleted, some platforms’ insurance funds struggled to absorb losses, forcing rarely activated auto-deleveraging (ADL) mechanisms into action. Designed as a last resort when insurance funds are insufficient, ADL aims to forcibly reduce short positions to prevent prices from collapsing to extreme levels due to liquidation pressure, thus avoiding insolvency. However, in this event, ADL execution showed significant deviations in price transparency and execution path: some positions were forcibly closed at prices vastly divergent from market rates, causing top market makers like Wintermute to have their short positions passively closed far from fair value, leaving them unable to hedge losses normally. Meanwhile, ADL triggers concentrated on illiquid altcoins and long-tail contracts rather than mainstream assets like BTC/ETH, causing institutions using structured strategies such as short BTC / long Alt to lose their short hedges abruptly, exposing them to severe downside risk in minor coins.
The deviation in liquidation and ADL execution, combined with infrastructural issues, amplified the stress. During extreme conditions, multiple centralized platforms and on-chain channels experienced withdrawal and asset transfer congestion. Cross-platform funding routes partially failed at critical moments, preventing typical arbitrage strategies from executing smoothly. As a result, even if market makers intended to take the other side, they couldn’t timely hedge risks elsewhere. Under these circumstances, professional liquidity providers, for risk control, were forced to tighten quotes or temporarily withdraw. Price discovery thus fell increasingly under the automated logic of liquidation engines and ADL. Meanwhile, under high load, some CEXs experienced matching engine lag, API glitches, or brief outages. Unlike traditional stock and futures markets with clear circuit breakers and call auction mechanisms, crypto markets lacked such safeguards, forcing prices to continue sliding on order books dominated by passive liquidations—further amplifying tail-end volatility.
In outcome, the event’s impact varied greatly across assets and platforms. We believe its long-term implications have been highly underestimated. Major assets like BTC and ETH saw maximum drawdowns in the 10–15% range, while many altcoins and long-tail assets suffered 80% declines or near-zero collapses—reflecting the most severe price distortions in the least liquid instruments due to liquidation chains and ADL execution. Compared to the 2022 Terra/3AC episode, this event did not trigger widespread institutional defaults. Market makers like Wintermute incurred partial losses from ADL mechanics but retained sufficient capital. Risks were more localized to specific strategies and assets, without spreading systemically through complex market structures.
Exchange-Traded Derivatives and DAT
Exchange-Traded Derivatives
The 2025 fiscal year was not only a watershed moment in digital asset history but also the pivotal year when CME cemented its role as the global pricing and risk transfer center for crypto. If 2024 was the debut year for spot ETFs, 2025 was the deepening year for exchange-traded derivatives. This year witnessed institutional capital shifting from passive allocation to active management using complex derivatives strategies, fundamentally restructuring the liquidity moat between compliant onshore markets and unregulated offshore ones.
The most disruptive product innovation in 2025 was the launch and adoption of Spot-Quoted Futures (codes QBTC and QETH). Unlike traditional futures, these contracts aim to achieve tighter pegging to spot prices through special settlement mechanisms, drastically reducing basis risk and roll costs.
With the launch of real-time data for the CME BTC Volatility Index (BVX), 2026 is likely to see tradable volatility futures. Institutional investors will gain direct tools to hedge unknown risks without needing complex options portfolios.
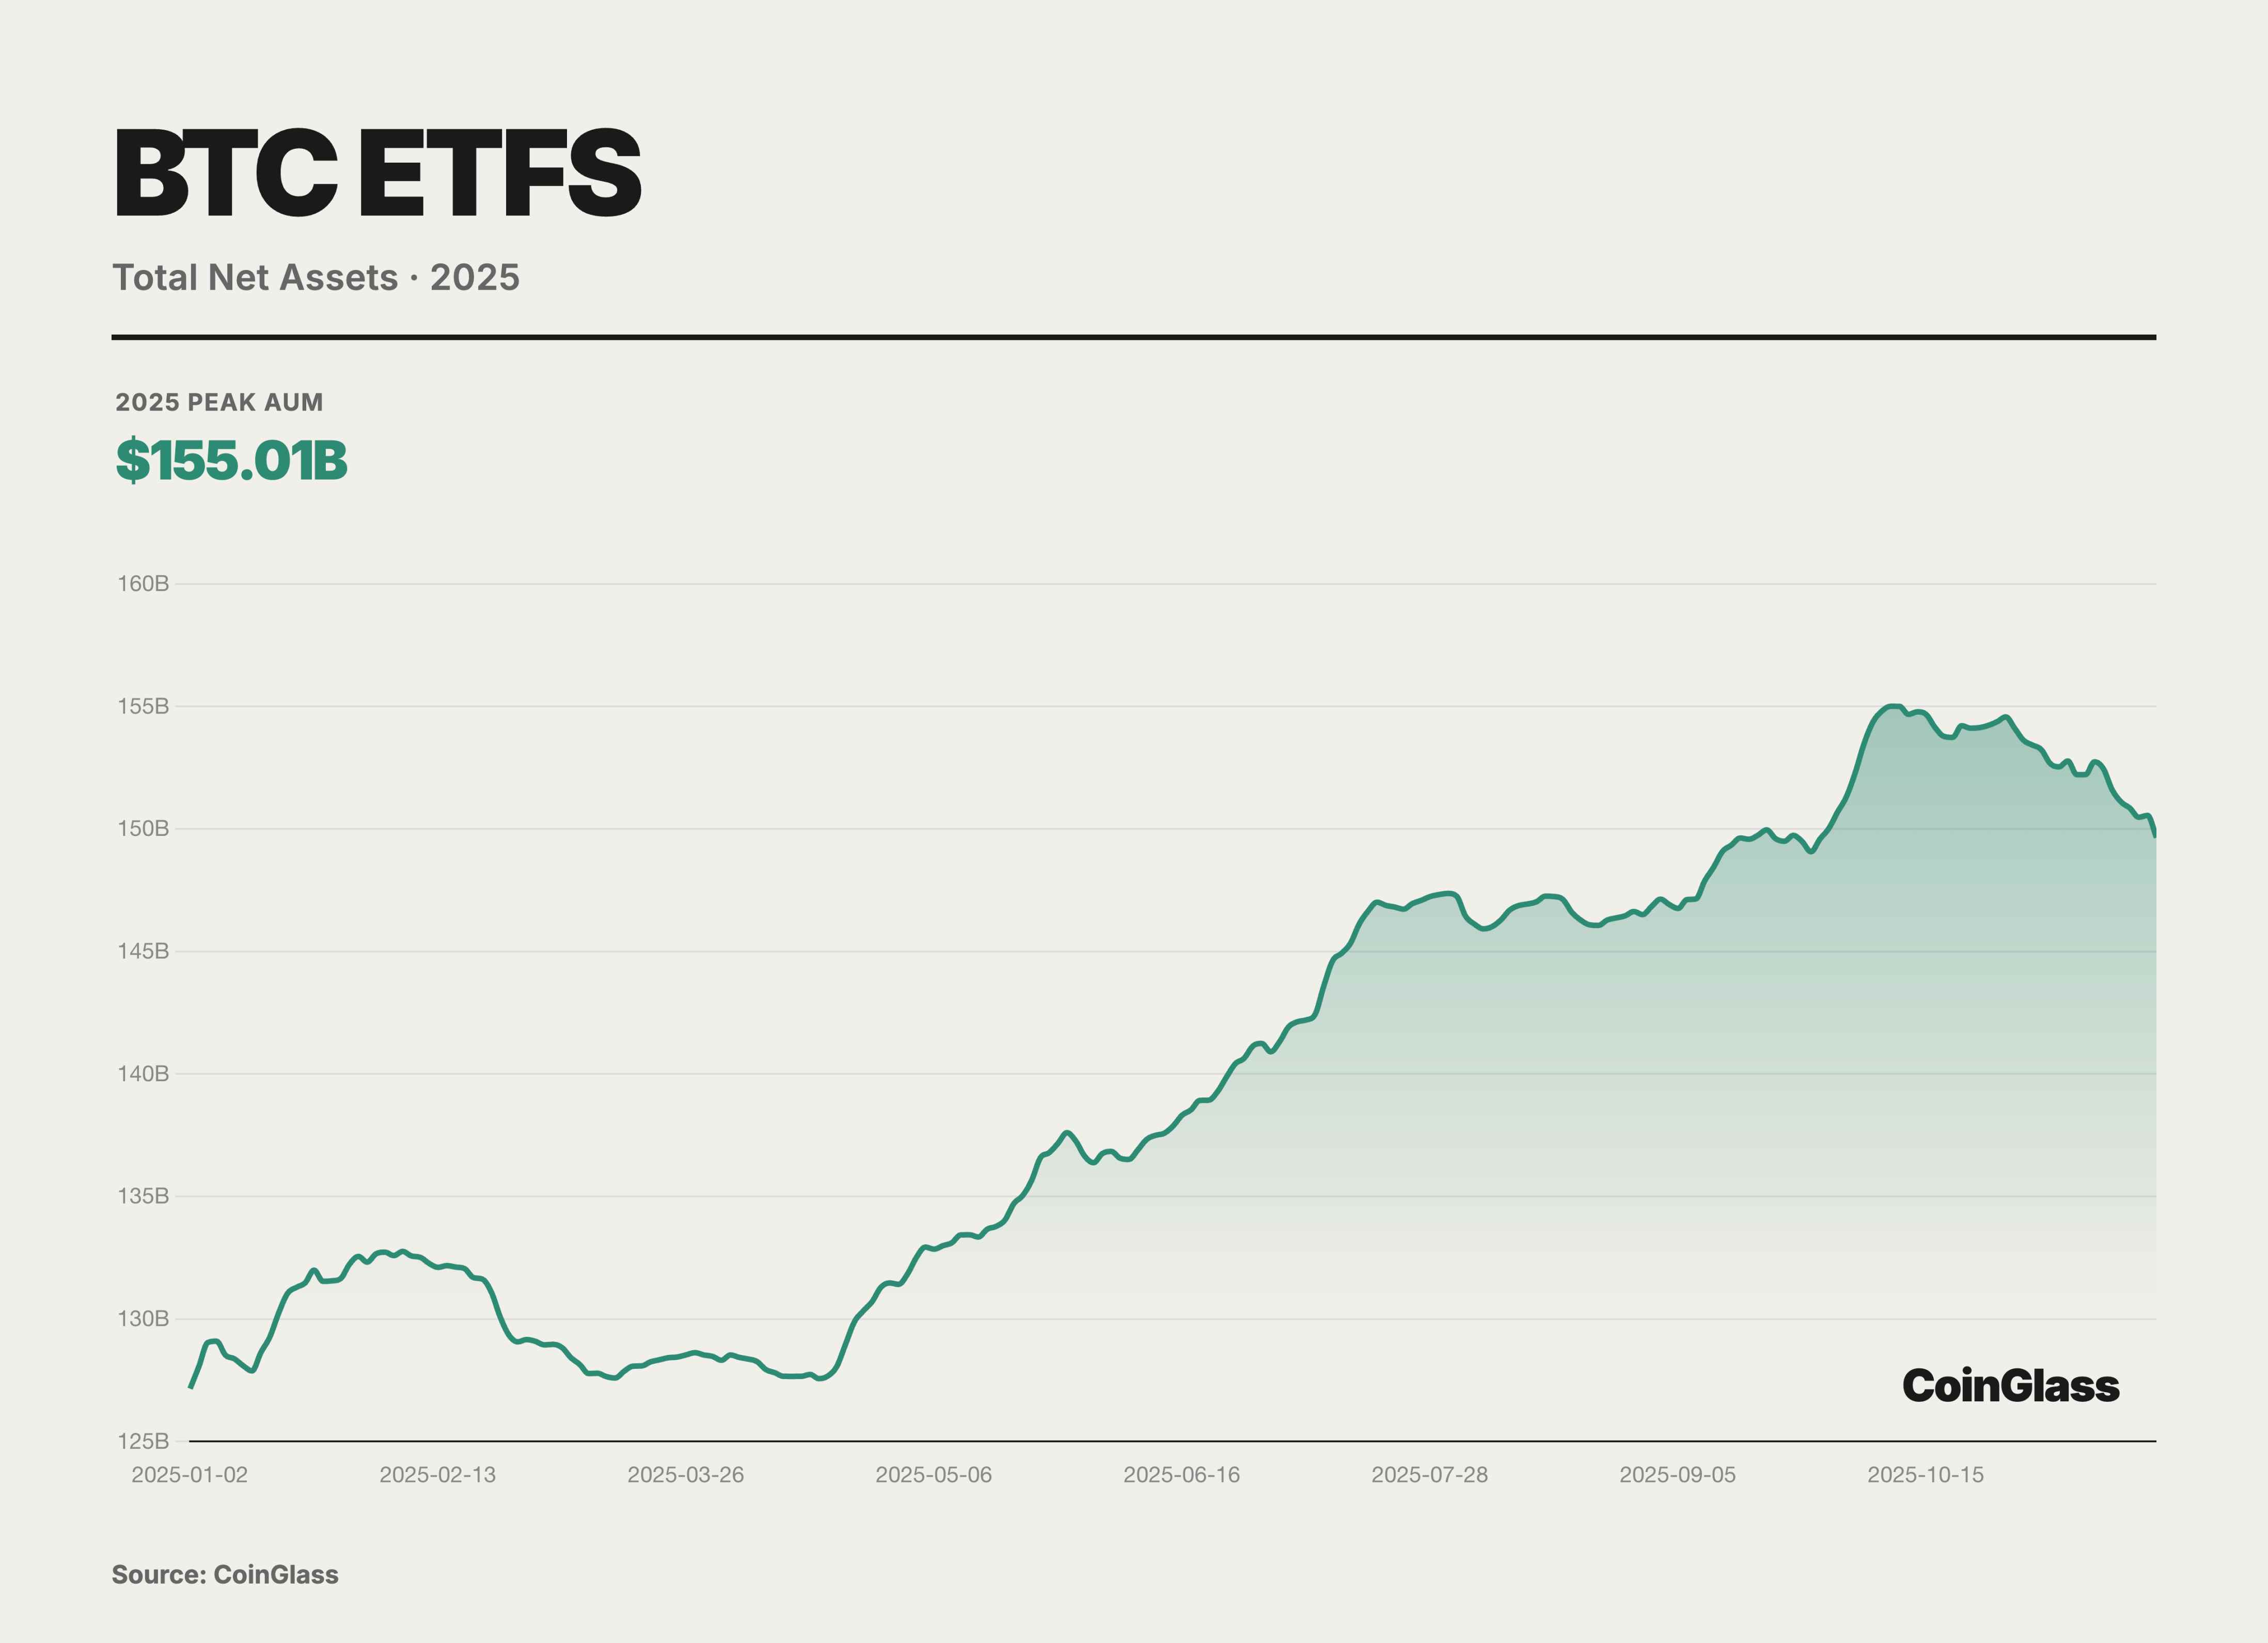
In 2025, basis trading became normalized and scaled up. As AUM of spot ETFs grew exponentially, using CME futures for cash-and-carry arbitrage became not only a mainstream hedge fund strategy but also a crucial link between traditional financial rates and native crypto yields.
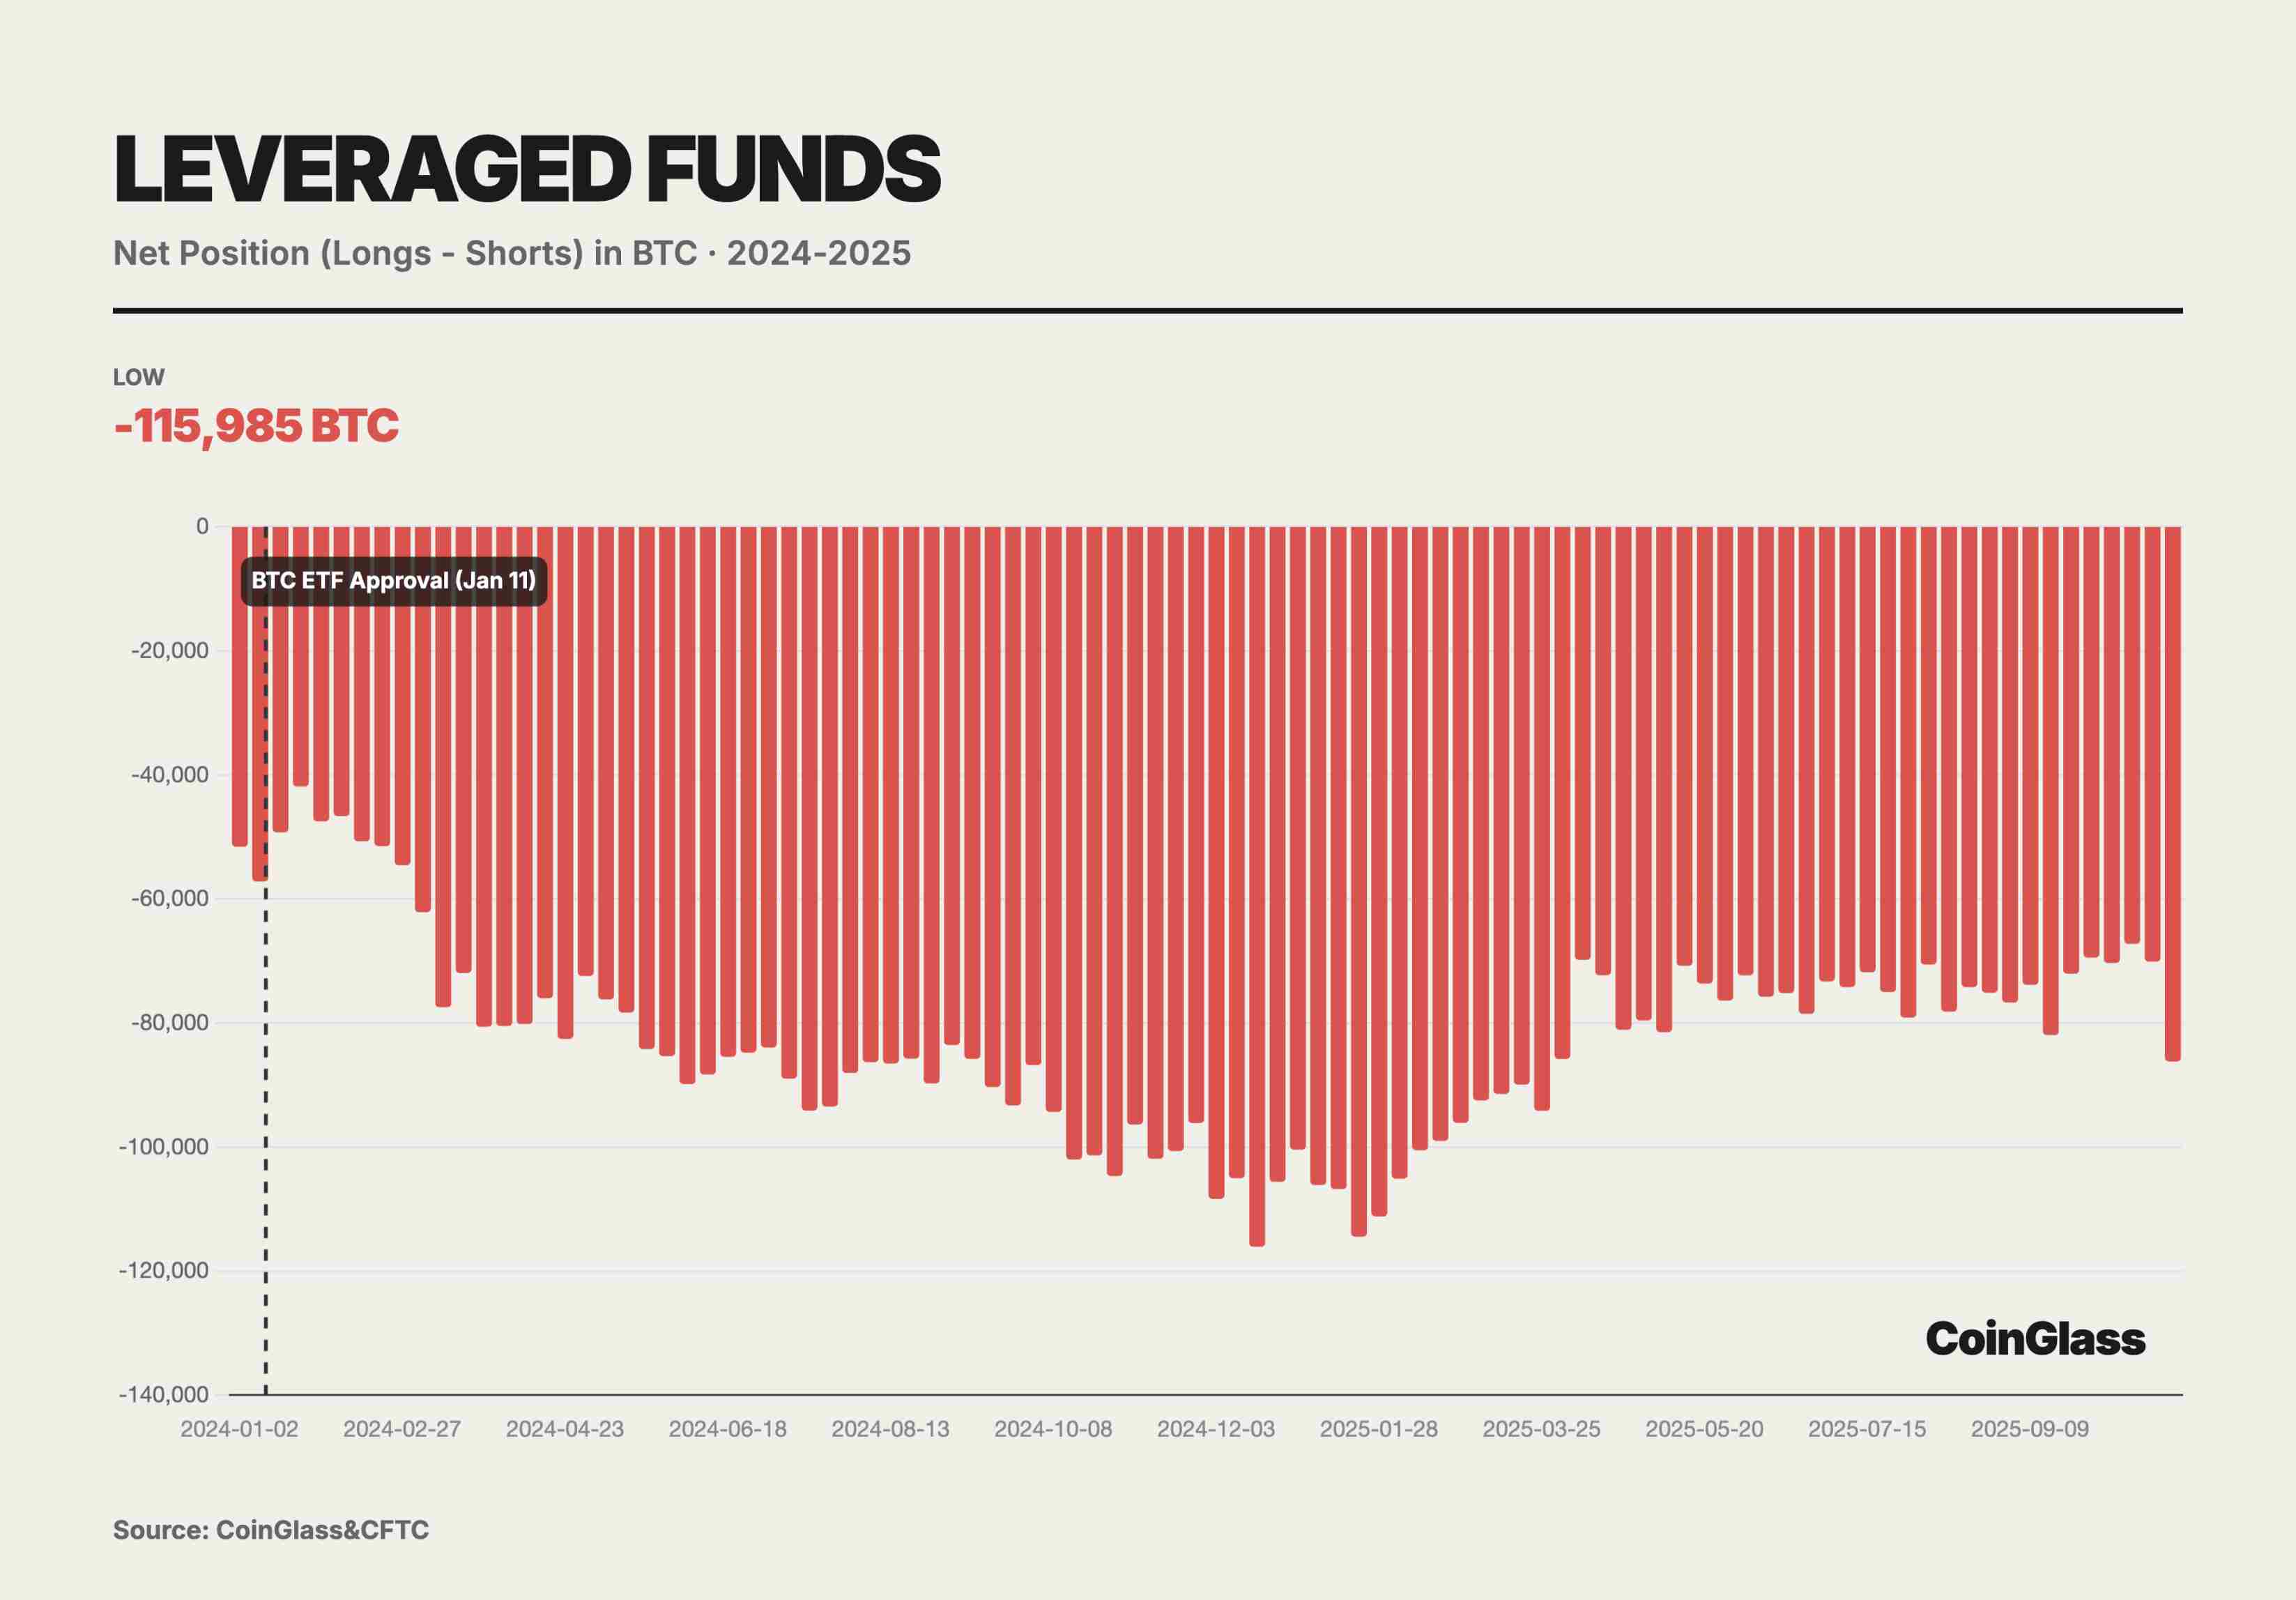
Currently, leveraged funds hold a net short position of up to 140,000 contracts. Deep analysis shows this is a direct result of basis trades. Leveraged funds buy BTC in the spot market or via ETFs while simultaneously selling equivalent amounts of futures on CME. This combination is delta-neutral, aiming to profit from the basis premium when futures trade above spot prices. As spot ETF inflows increase, leveraged funds' short positions rise correspondingly. This proves that short positions are not directional bets but hedges against long inventory brought by spot ETFs. At its peak, leveraged funds held net shorts equivalent to 115,985 BTC—making them the primary liquidity providers and movers for spot ETF flows.
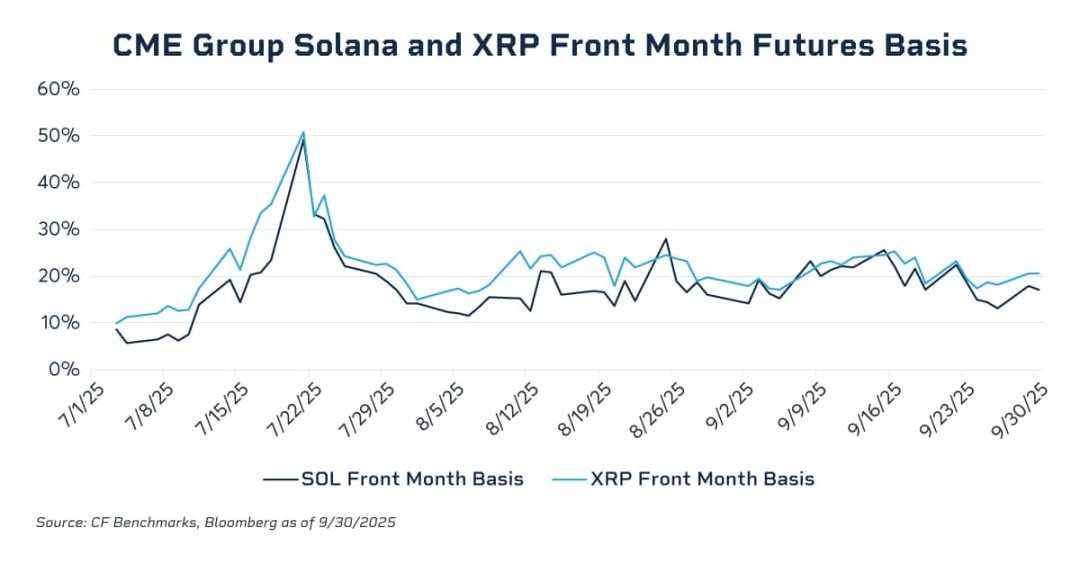
Data shows that the annualized basis of front-month contracts surged to 20–25% during the November 2024 bull run, compressing to near zero during Q1 deleveraging. In July 2025, the annualized basis of near-month SOL and XRP futures briefly approached 50%, far exceeding typical BTC futures levels—clearly exposing a lack of effective cross-market arbitrage forces in those markets. Without high-liquidity, regulated spot investment vehicles, institutional capital cannot scale cash-and-carry arbitrage structures (short futures / long spot), failing to sustainably suppress excessive basis premiums. With the launch of SOL and XRP spot ETFs under general listing frameworks, this structural gap was partially filled, providing compliant institutions with necessary spot vehicles and liquidity to enter the market and compress futures basis through arbitrage. With CFTC approval for spot trading, margin offsetting between spot and futures is highly likely in 2026. This will free up billions in idle capital, greatly enhancing market leverage efficiency. Friction costs in basis trading will drop to historic lows, potentially bringing basis levels closer to those of traditional commodities.
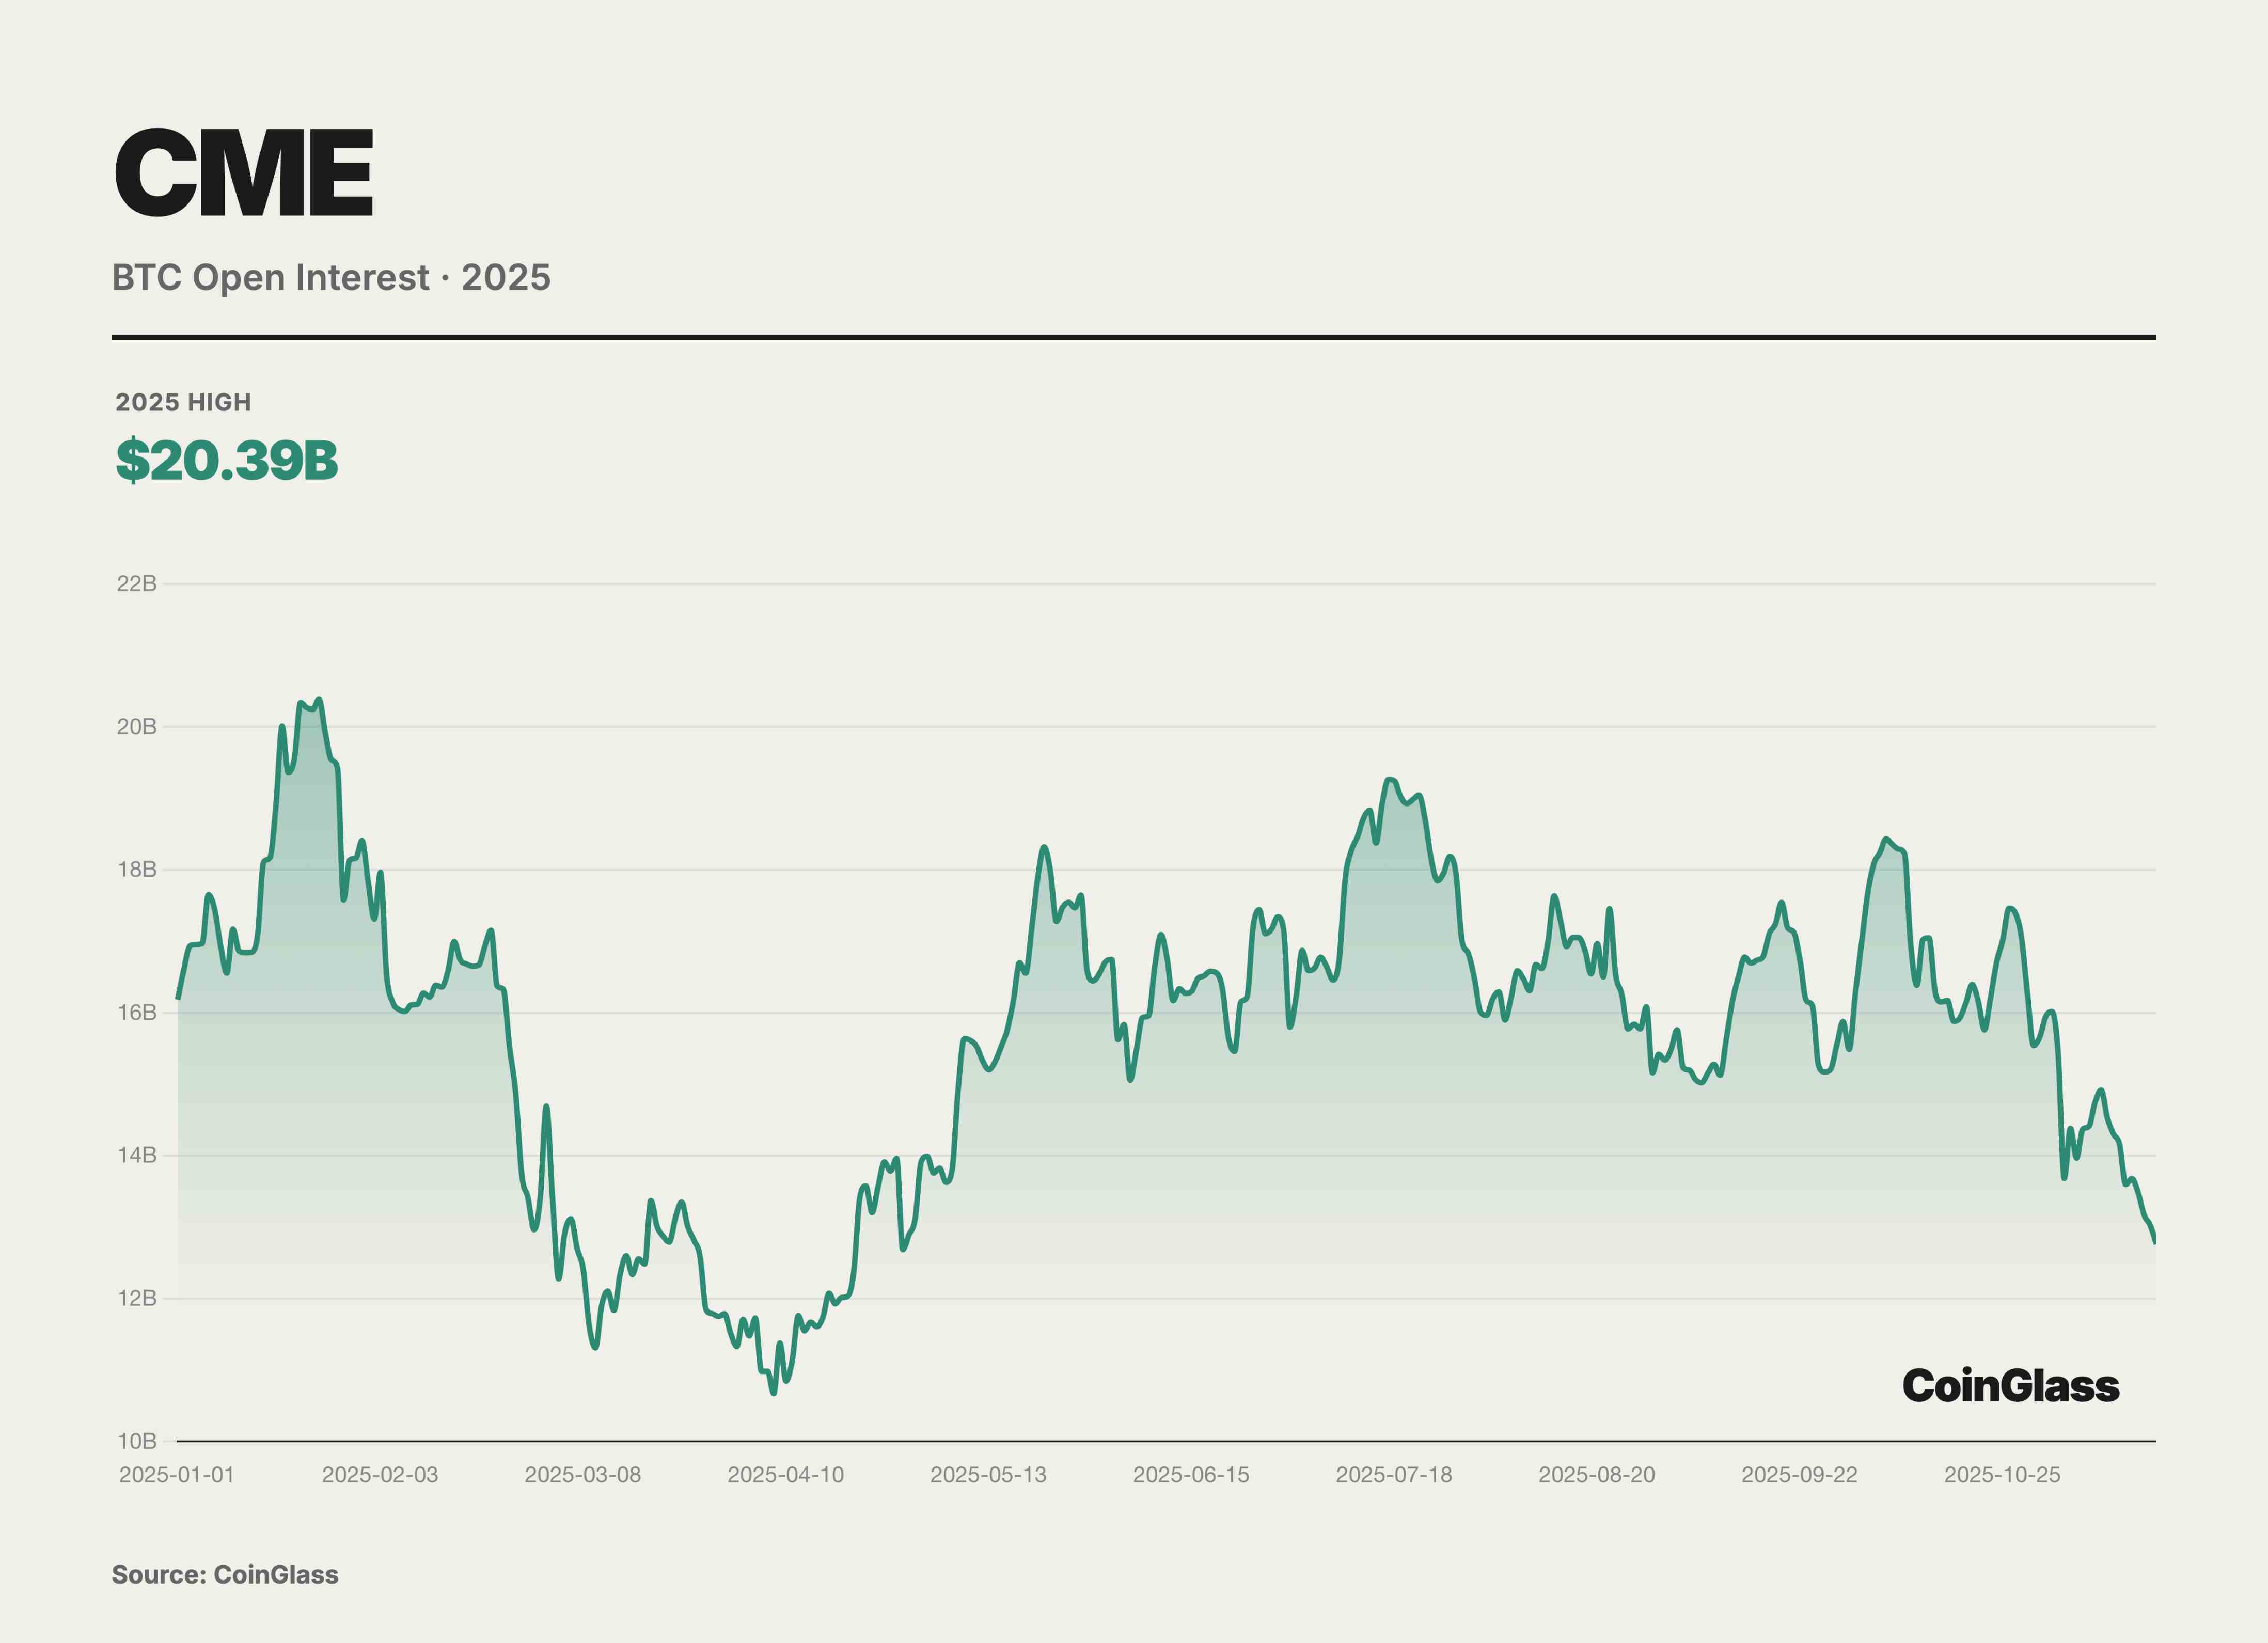
In November 2025, CME’s crypto segment achieved a record daily average of 424,000 contracts traded, with a notional value of $13.2 billion—up 78% YoY. This exceeded any monthly performance in 2024 and approached levels seen during the 2021 bull peak, but with a healthier composition—driven more by institutional hedging and arbitrage than retail speculation.
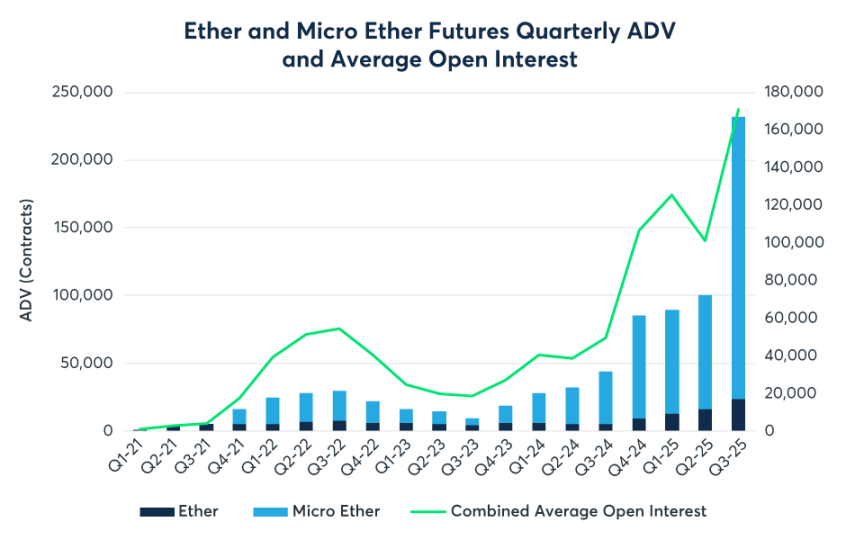
While BTC maintains absolute dominance in nominal OI, 2025 was the breakout year for ETH derivatives liquidity. Data shows Q3 ETH futures daily trading volume surged 355% YoY—far outpacing BTC. The passage of the GENIUS Act in July 2025 removed the final compliance barrier for traditional financial institutions, directly driving CME’s crypto complex to set a record $31.3 billion in daily OI during Q3. Micro contracts continued to serve as the liquidity foundation. Q3 ADV for micro ETH futures (MET) reached an astonishing 208,000 contracts. Broker data indicates many mid-sized hedge funds and family offices prefer micro contracts for position sizing, allowing finer alignment with their spot portfolios and avoiding the granularity issues of standard contracts (5 BTC / 50 ETH).
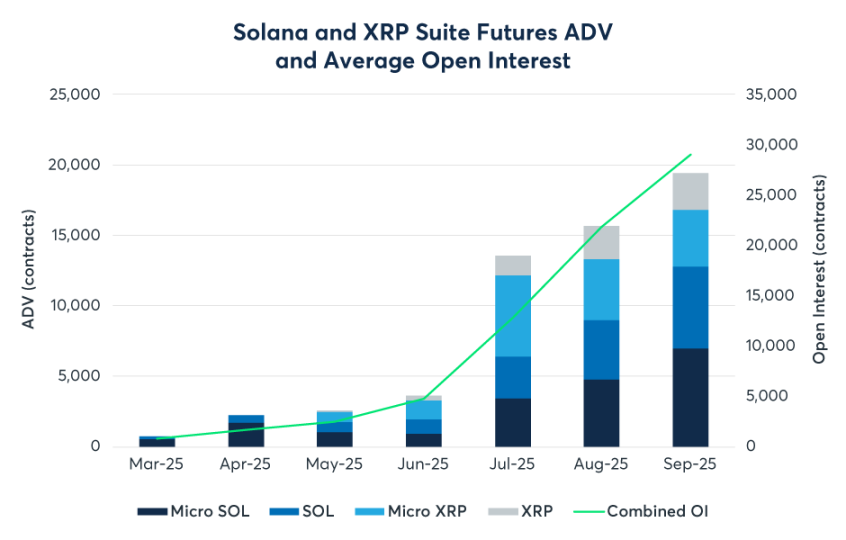
For years, CME was a duopoly of BTC and ETH. But in 2025, that changed. With the launch of SOL and XRP futures and options, CME officially entered a multi-asset era. As a strong contender for third-largest asset, SOL futures performed impressively since their March launch. By Q3, cumulative trading volume reached 730,000 contracts, with a notional value of $34 billion. More importantly, SOL futures OI rapidly surpassed $2.1 billion in September, setting the fastest doubling record for a new contract. Meanwhile, XRP futures traded 476,000 contracts since May. The launch of XRP options on October 13 marked the first CFTC-regulated product of its kind. This signals that institutions no longer equate crypto solely with BTC. For assets like SOL and XRP with different risk-return profiles, institutions are now seeking compliant hedging channels—foreshadowing more active multi-strategy crypto hedge funds on CME.
DAT
At the start of the 2025 fiscal year, ASU 2023-08 issued by the U.S. Financial Accounting Standards Board (FASB) took effect. This accounting change was foundational to the explosive financial performance seen in the DAT sector this year. The new rule mandates enterprises to apply fair value measurement to certain crypto assets, with changes in fair value directly recognized in current net income. Digital Asset Treasury (DAT) refers to public companies systematically migrating most of their treasury reserves—far exceeding ordinary operating needs—from cash and short-term debt to digital assets like BTC, ETH, and SOL. They treat crypto as a core balance sheet allocation, not a marginal speculative position. Unlike spot ETFs, DATs are not passive tracking instruments but corporate entities with full operational and capital management capabilities. Management can use convertible bonds, ATM offerings, etc., to raise value-accretive financing, continuously increasing per-share digital asset holdings—the so-called DAT flywheel effect. When stock price trades at a premium to NAV, the company issues shares to buy more digital assets, diluting equity while increasing per-share crypto holdings, reinforcing or even amplifying the premium.
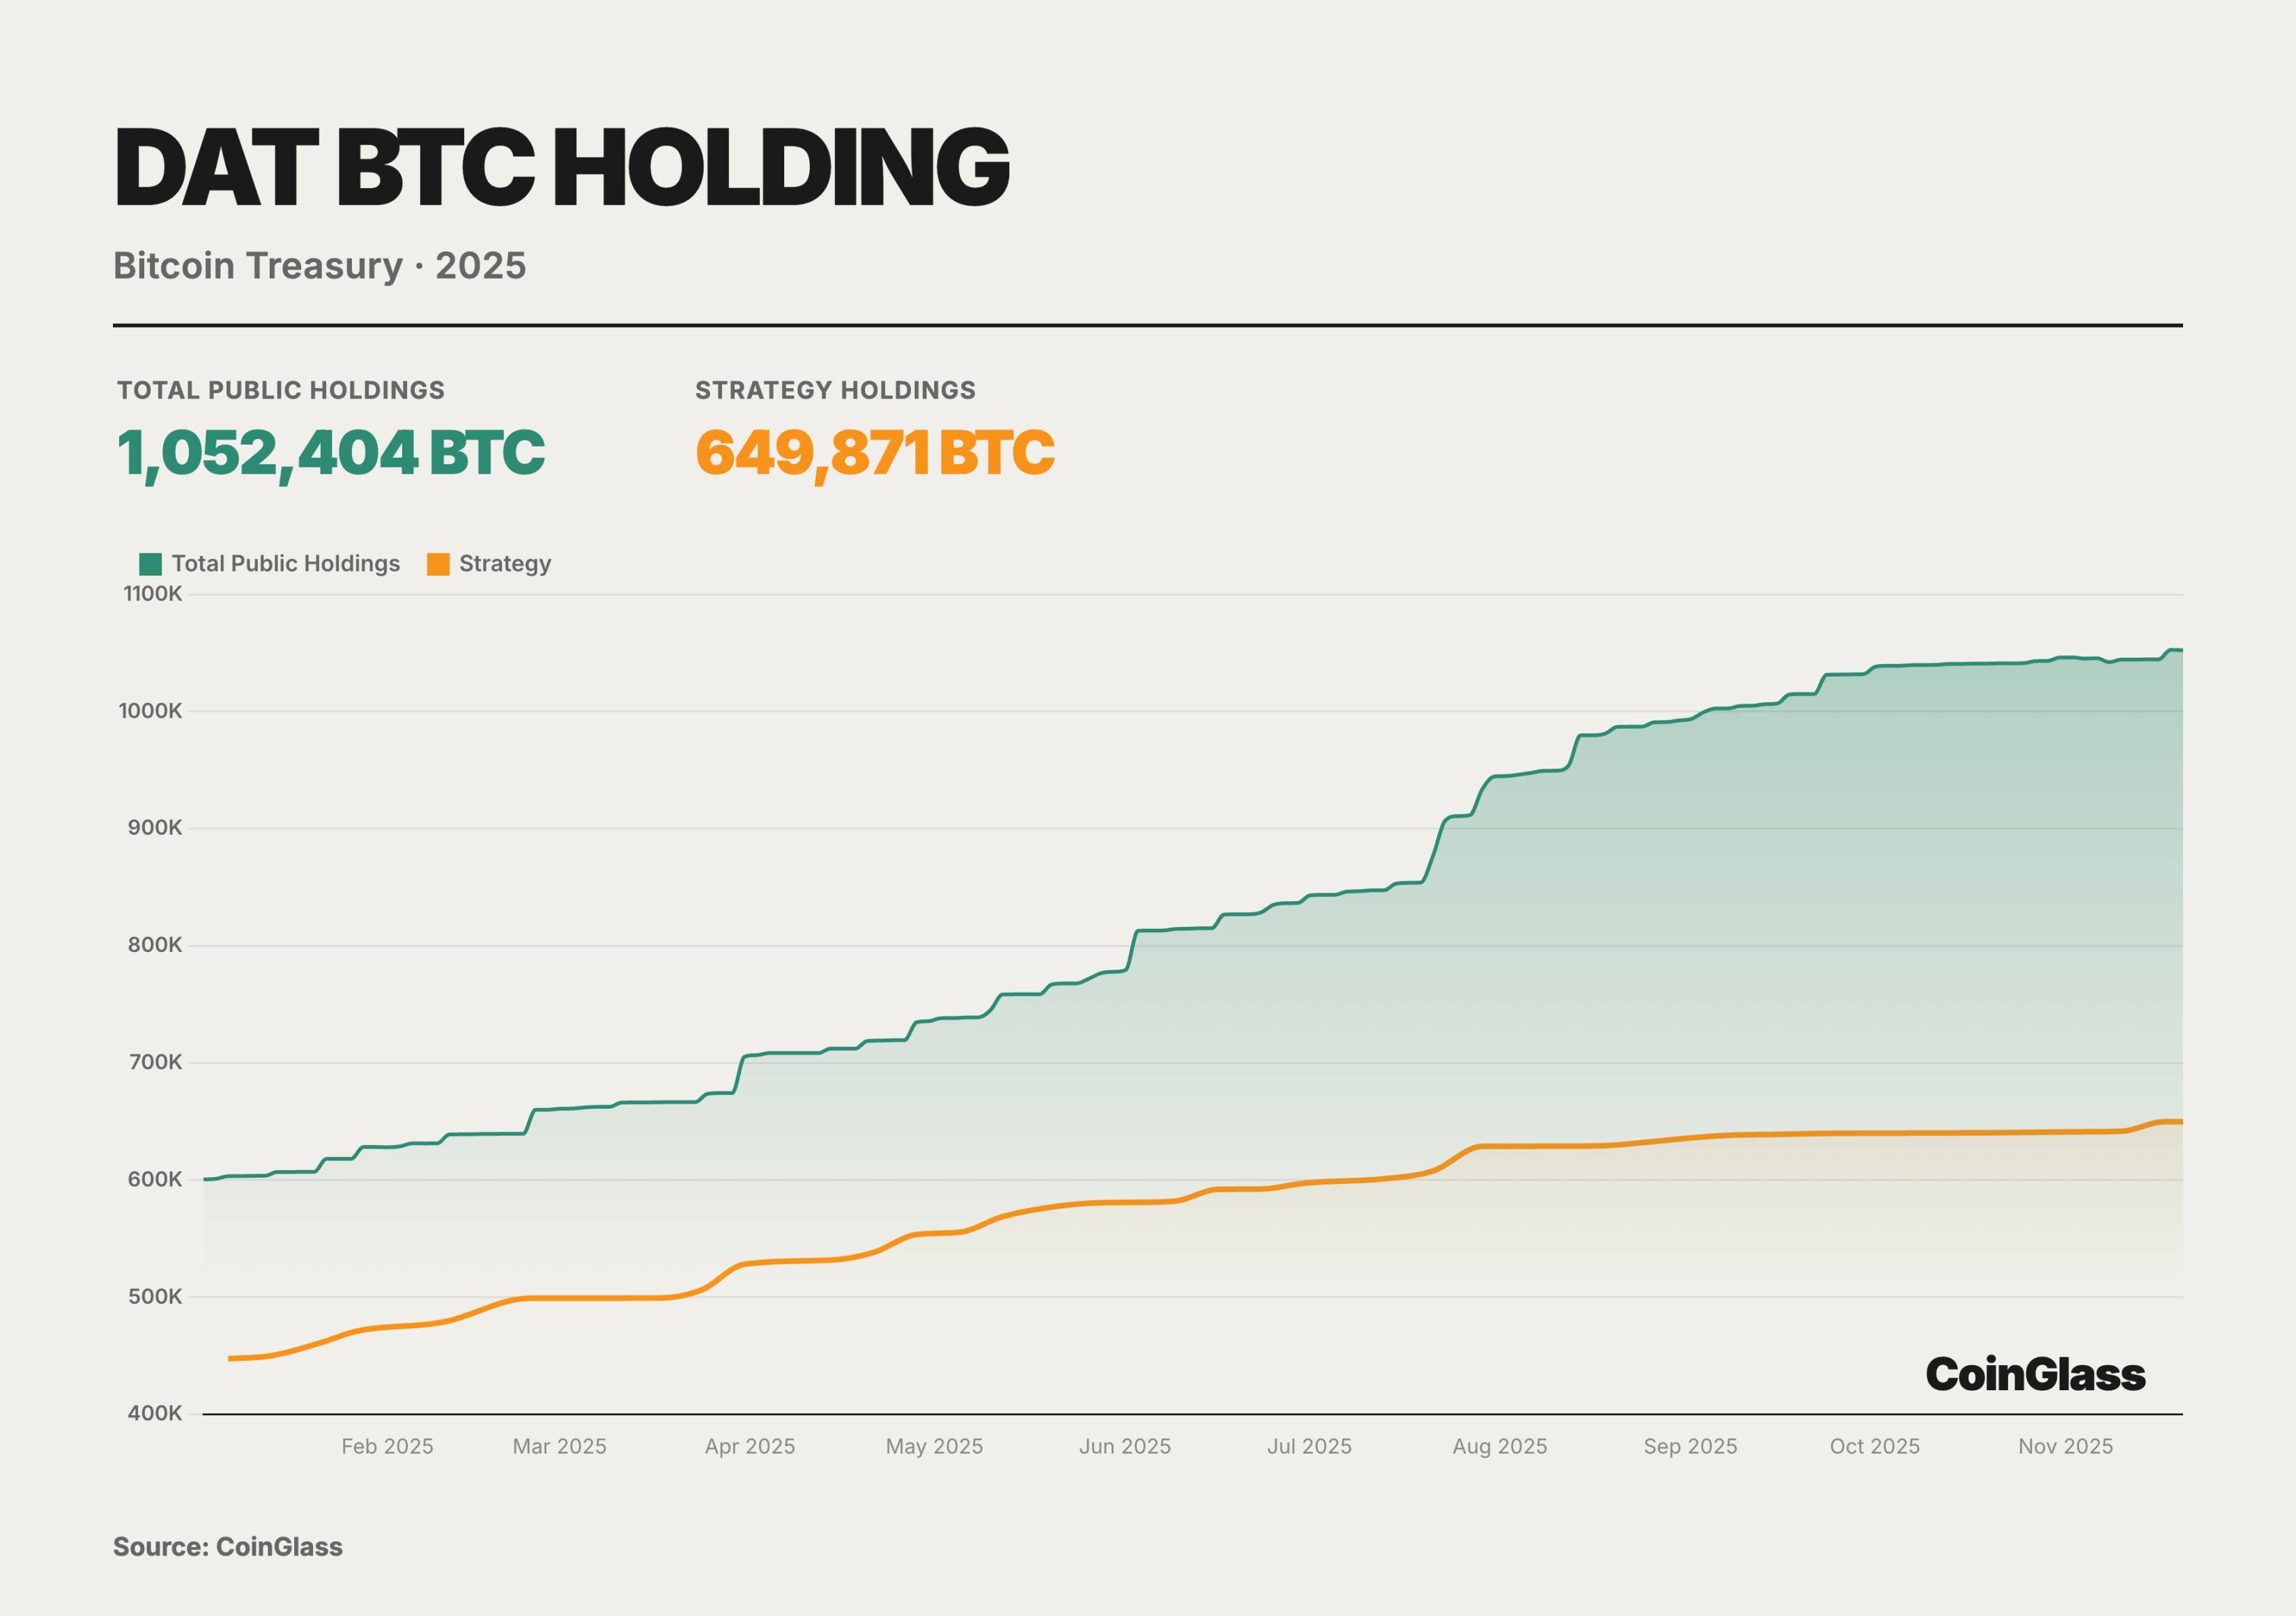
Throughout 2025, listed company DATs’ BTC holdings followed an almost monotonically increasing trajectory, rising from ~600,000 BTC at year-start to ~1.05 million BTC by November—about 5% of BTC’s theoretical total supply. Strategy alone increased from ~447,000 to ~650,000 BTC, remaining the irreplaceable treasury core in absolute terms, though its market share slid from ~70% to just over 60%. The incremental gains came increasingly from smaller DATs.
From Q2 to Q3, various types of DATs rushed in collectively, pushing total BTC holdings past the 1-million threshold. In Q4, despite a sharp drop in net capital inflows and compressed DAT stock premiums, the curve only slowed—not reversed—showing no systemic deleveraging or forced reduction. This suggests the so-called bubble burst was more about equity repricing than collapse of BTC holdings on the asset side. DATs have evolved from thematic trades into a structural layer of locked-in buying power, buffered by corporate governance, accounting standards, and disclosure regimes. Industry structure has shifted from “single whale dominance” to “giant whale + long tail,” with risk重心 moving from coin price itself to individual DATs’ financing structures, governance, and regulatory shocks. The key to the DAT sector is no longer predicting short-term BTC price moves, but understanding the underlying financing structures, derivatives exposures, and macro hedging logics of these companies. As the 2026 MSCI index review approaches and global monetary policy faces potential shifts, the volatility test for DAT companies has only just begun.
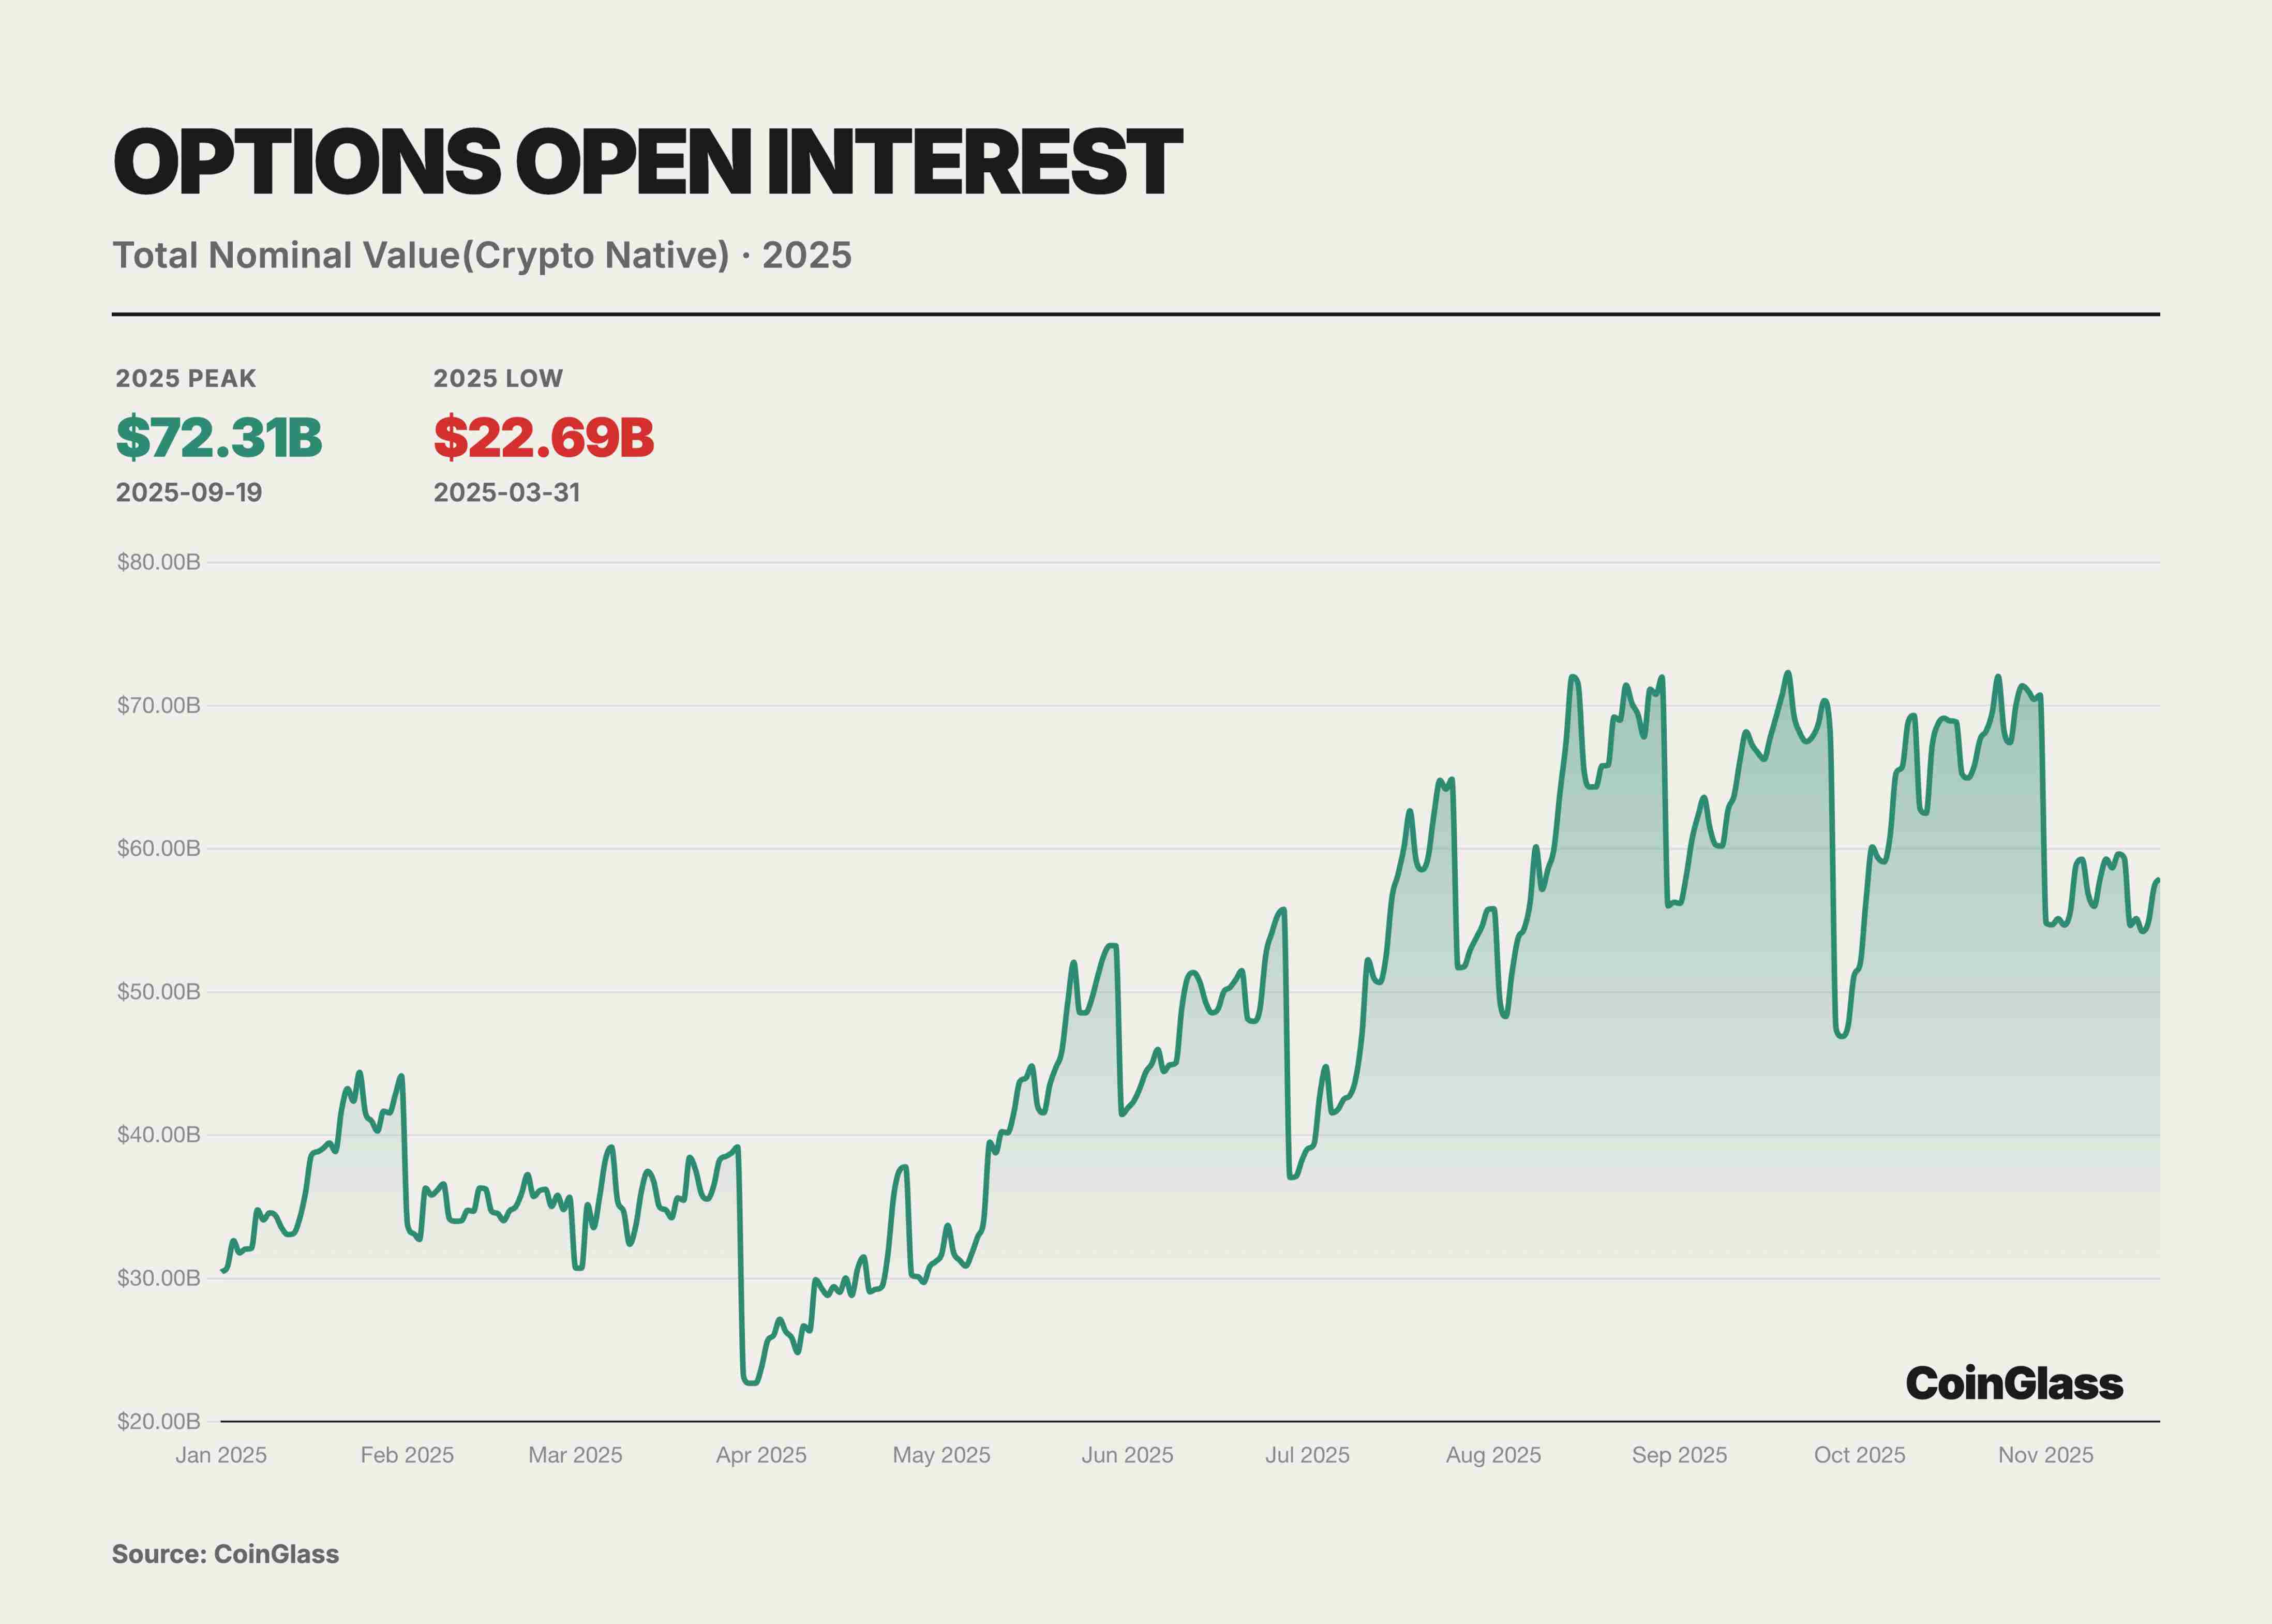
Options Market
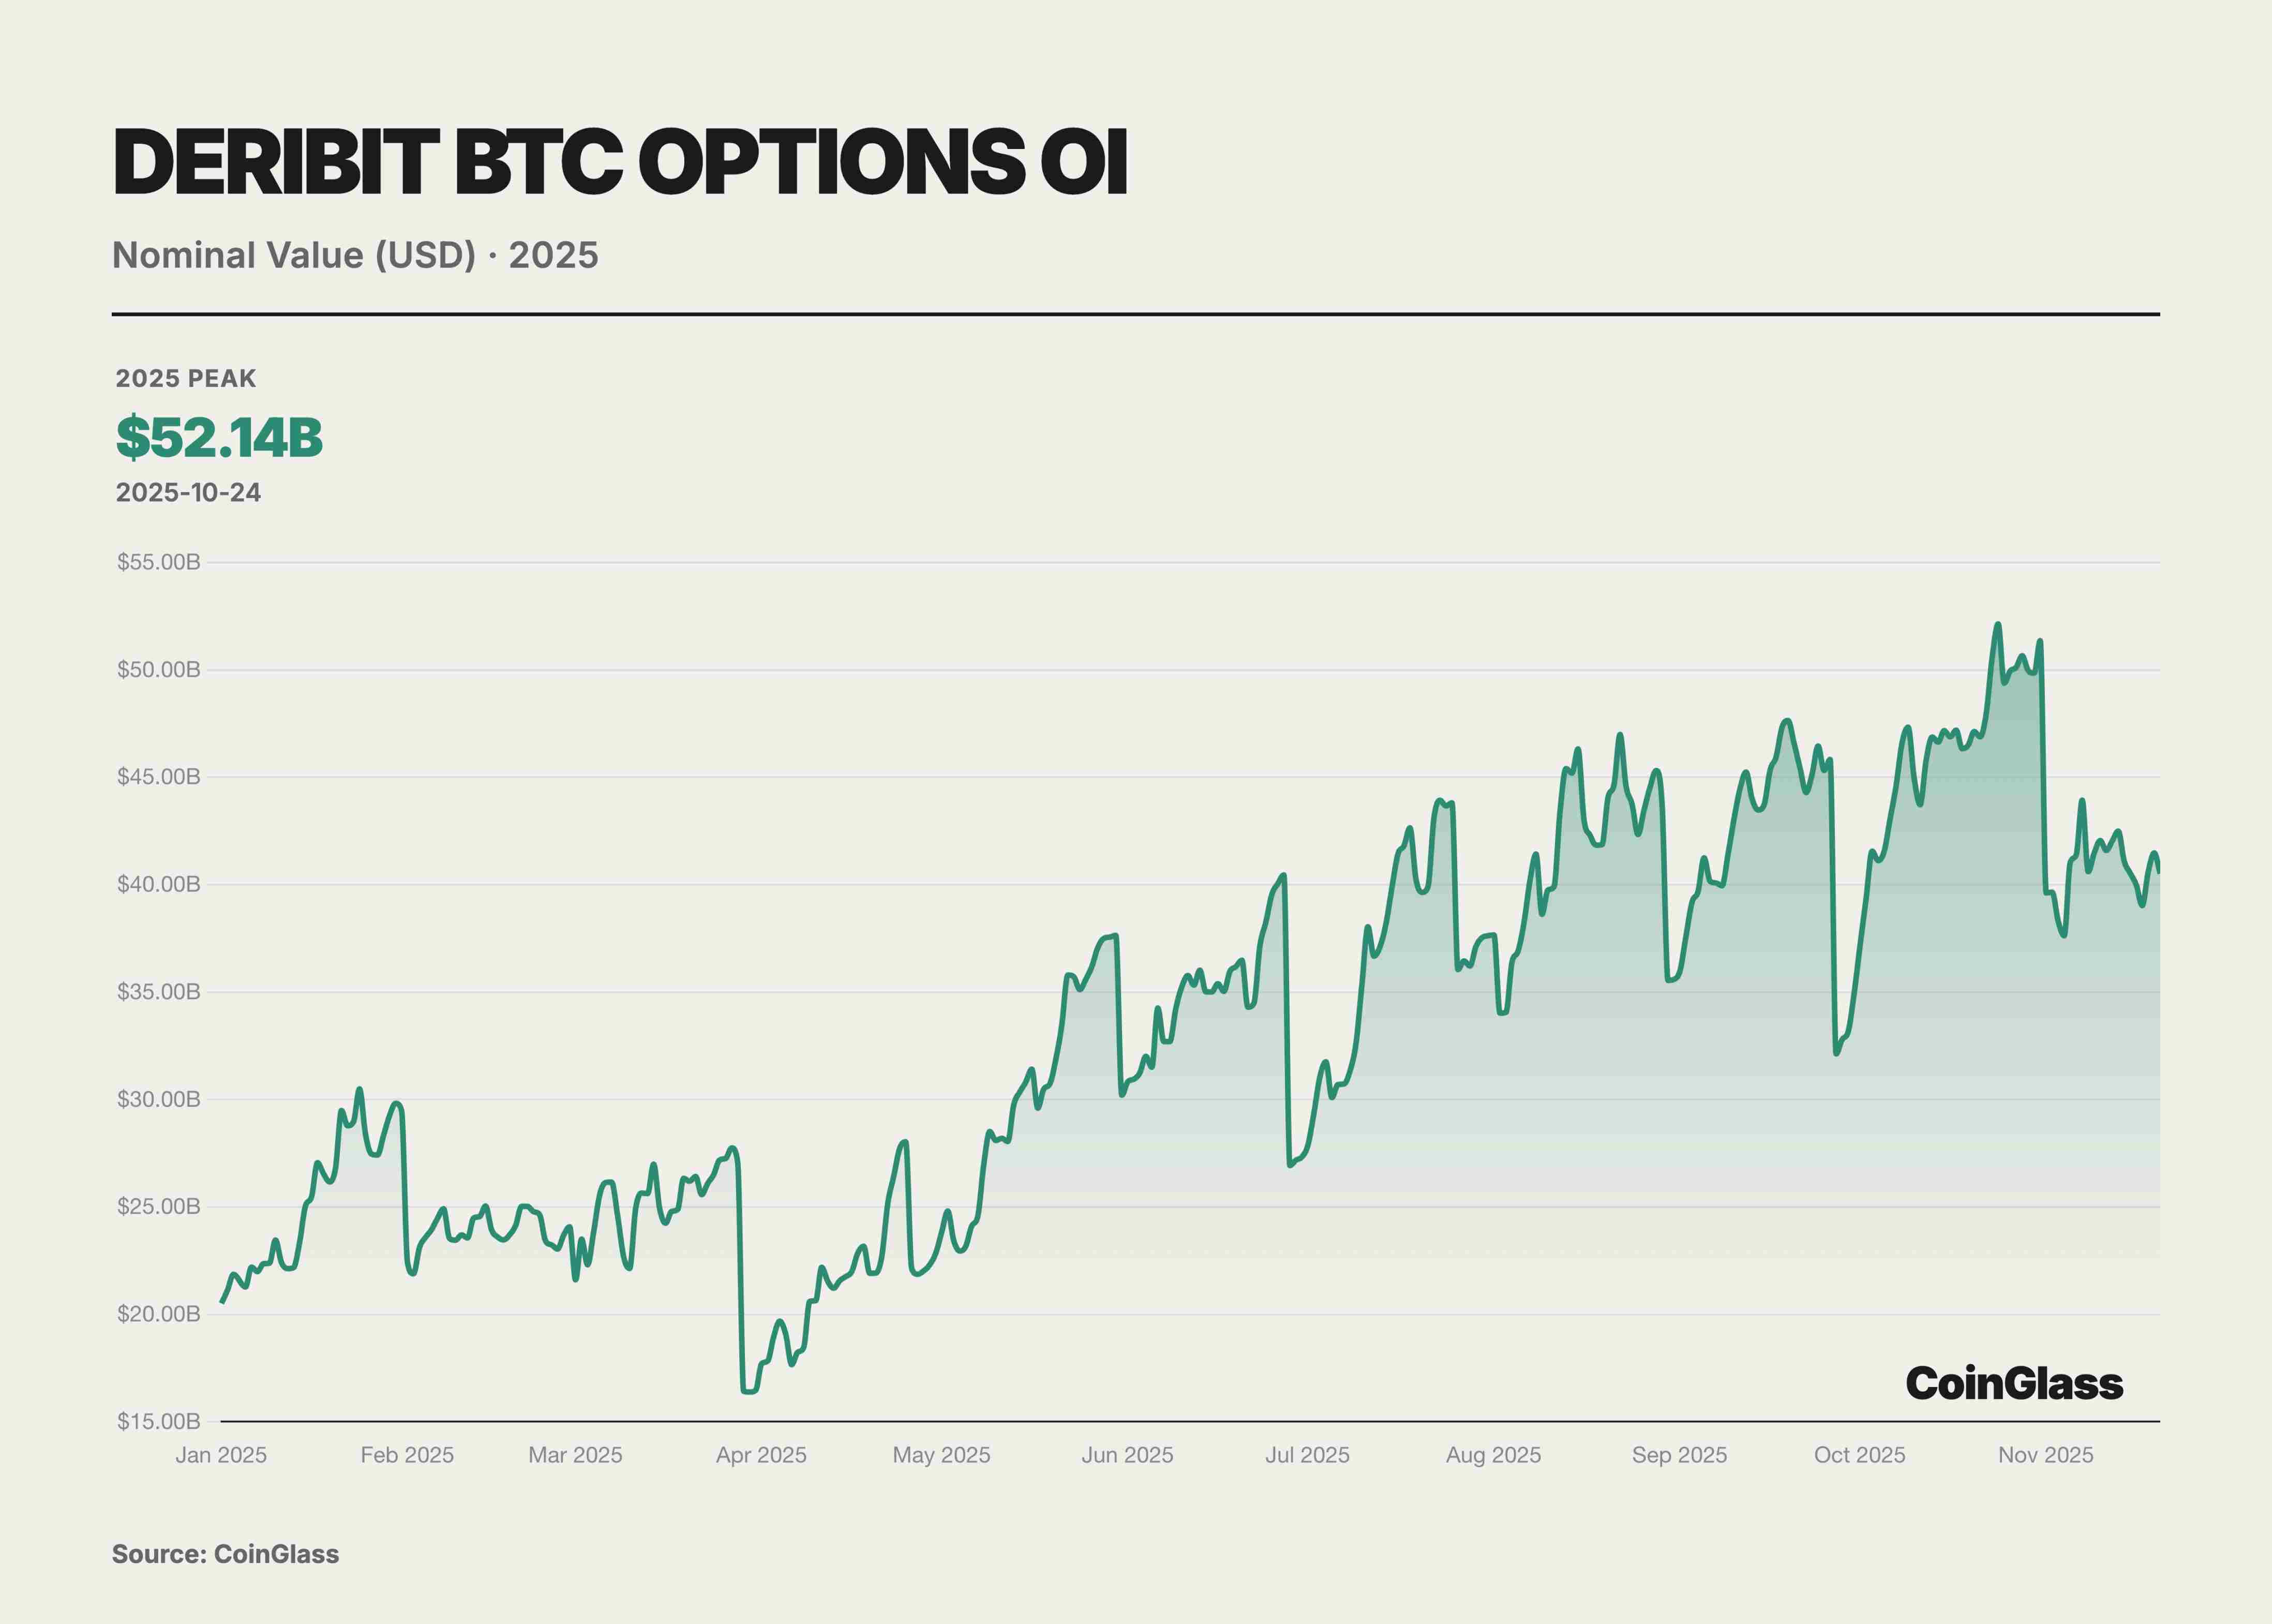
This year’s options market was defined by two landmark events that together reshaped global digital asset pricing logic. First, Coinbase, the largest U.S. compliant exchange, acquired offshore options giant Deribit for $2.9 billion. This merger marked traditional compliant exchanges’ integration of native crypto liquidity and redefined the global derivatives infrastructure landscape. Second, the rise of IBIT ETF options under BlackRock, which in Q3 2025 surpassed long-time leader Deribit in open interest, signaled that traditional financial capital had formally challenged native crypto platforms for volatility pricing power. Prior to this, Deribit enjoyed near-monopoly status, controlling ~85% of global crypto options market share by end-2024.
This year, traditional financial institution involvement became a watershed moment for the options market. As U.S. regulatory conditions evolved, multiple Wall Street firms launched BTC ETFs and their options products. Notably, BlackRock’s IBIT began offering options trading in November 2024 and rapidly rose to become a new giant in the BTC options market by 2025. Overall, 2025’s market structure showed a dual-track pattern: one track represented by crypto-native platforms like Deribit, the other by traditional finance channels like ETF options such as IBIT.
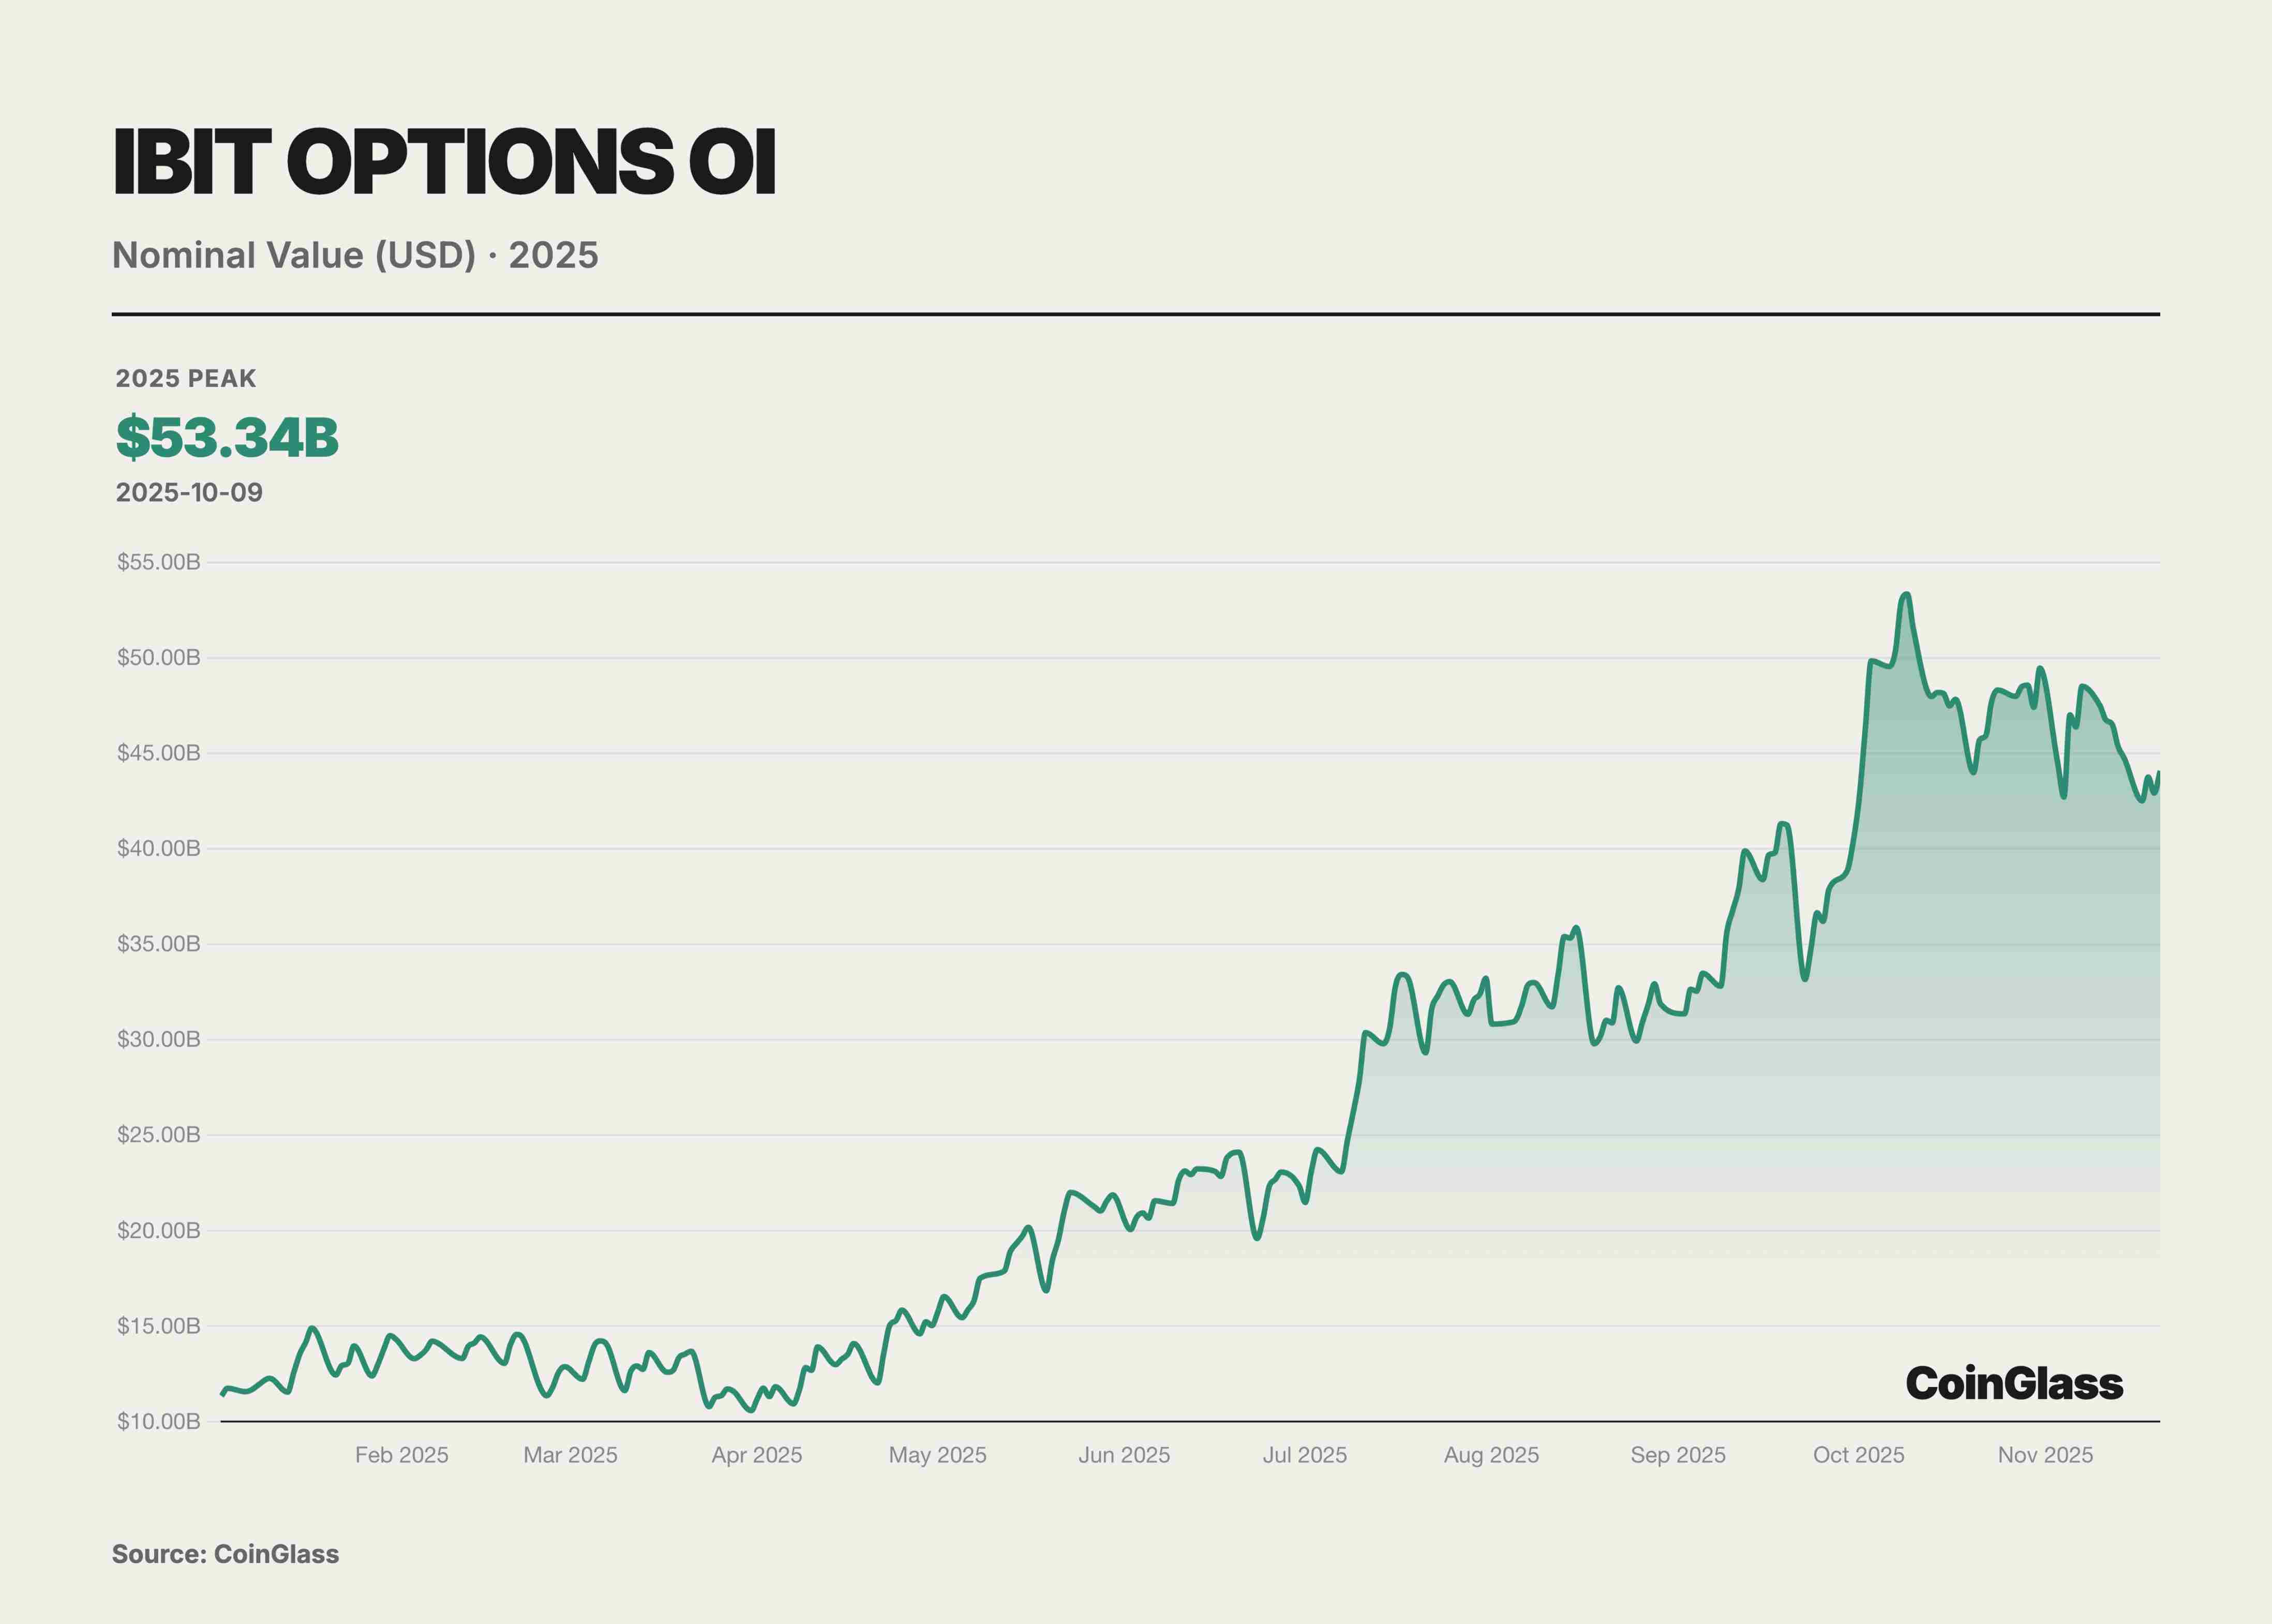
BlackRock’s IBIT ETF options rose strongly, mounting a direct challenge to Deribit. As a spot BTC ETF listed on Nasdaq, IBIT’s options saw explosive growth in open interest within a year of launch. By November 2025, IBIT became the world’s largest BTC options trading vehicle, displacing Deribit’s long-standing leadership. IBIT’s success highlighted the immense influence of traditional finance—large numbers of institutional investors previously restricted from offshore platforms entered the BTC options market via IBIT, bringing massive capital and demand. The credibility and compliance framework of major asset managers like BlackRock behind IBIT also attracted more conservative institutions to use options for BTC risk management. By November 2025, IBIT, as the largest spot BTC ETF, managed $84 billion in AUM, providing ample spot backing and liquidity foundation for the options market—clearly demonstrating strong demand for spot ETF options.
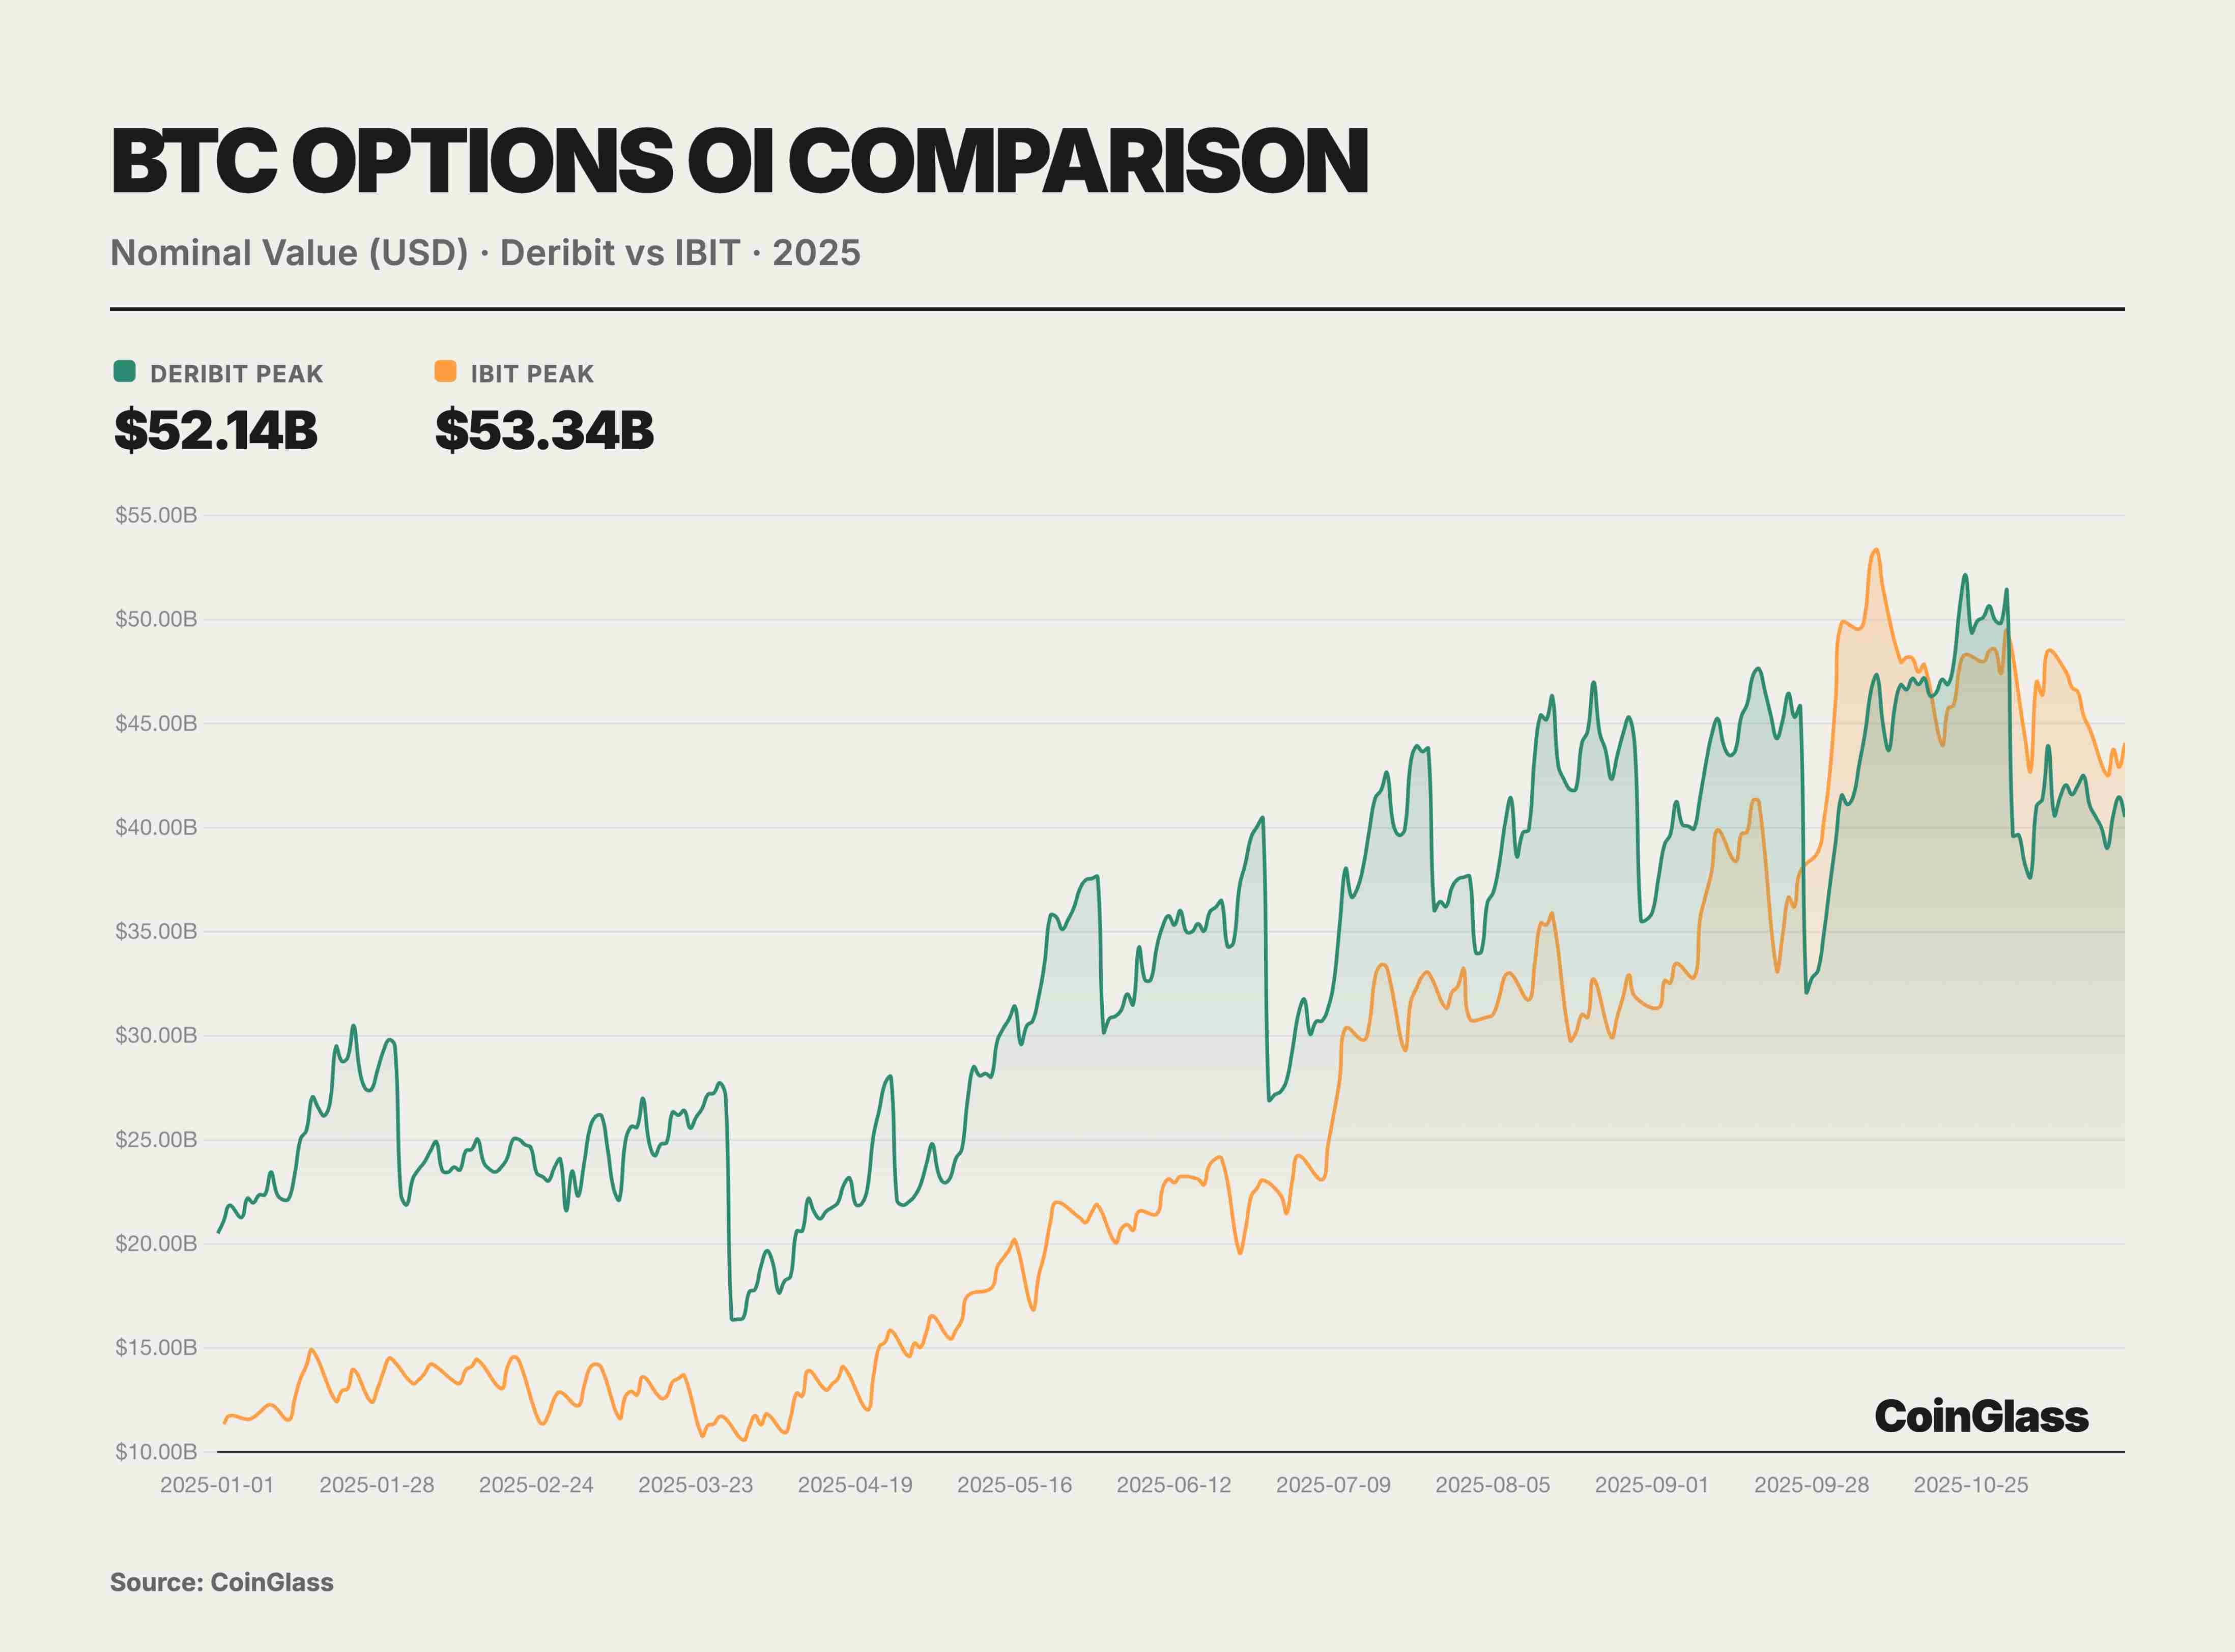
Besides Deribit and IBIT, the remaining less-than-10% of the BTC options market is split among CME and a few crypto exchanges. As a traditional regulated venue, CME offers options based on BTC and ETH futures. After years of development, CME’s market share has modestly increased, but by Q3 2025 it still held only ~6% of global BTC options OI. This reflects limited appeal of futures-based options compared to more flexible crypto-native platforms and ETF options. Centralized exchanges like Binance and OKX have recently tried launching BTC/ETH options, but user engagement remains low. Their derivatives volume is mainly concentrated in perpetuals and futures, with options making up only a small fraction. Platforms like Bybit offer USDC-settled options, but overall market share remains limited. Collectively, exchanges like OKX and Binance contributed only ~7% of BTC options OI. Overall, 2025 saw a highly concentrated crypto options market: crypto-native platforms (led by Deribit) continue dominating non-ETF varieties like ETH, while traditional finance platforms (led by IBIT) caught up and surpassed in BTC options. Under this duopoly, other players are increasingly marginalized. Notably, for ETH options, with no equivalent to IBIT’s spot ETF option yet available, Deribit remains virtually the sole center of ETH options liquidity, commanding over 90% market share. This means Deribit’s dominance in ETH options remained solid in 2025, with IBIT’s impact largely confined to BTC. Looking ahead, with ETH spot ETF options approved for issuance in April 2025, ETH ETF options may follow and gradually enter competition. But as of November 2025, ETH options remain the domain of crypto-native exchanges, with no traditional institutional competitor akin to IBIT emerging.
DeFi
PerpDEX
2025 was an extraordinarily brilliant year for PerpDEX. The entire market saw explosive growth in trading activity, repeatedly breaking historical records. Monthly trading volume first exceeded $1.2 trillion in October, with annual on-chain derivatives volume reaching multiple trillions. This surge in volume and market share was driven by a confluence of factors: performance breakthroughs, rising user demand, and changing regulatory environments. Retail investors, institutional trading desks, and venture capital firms alike turned their attention to this booming sector in 2025.
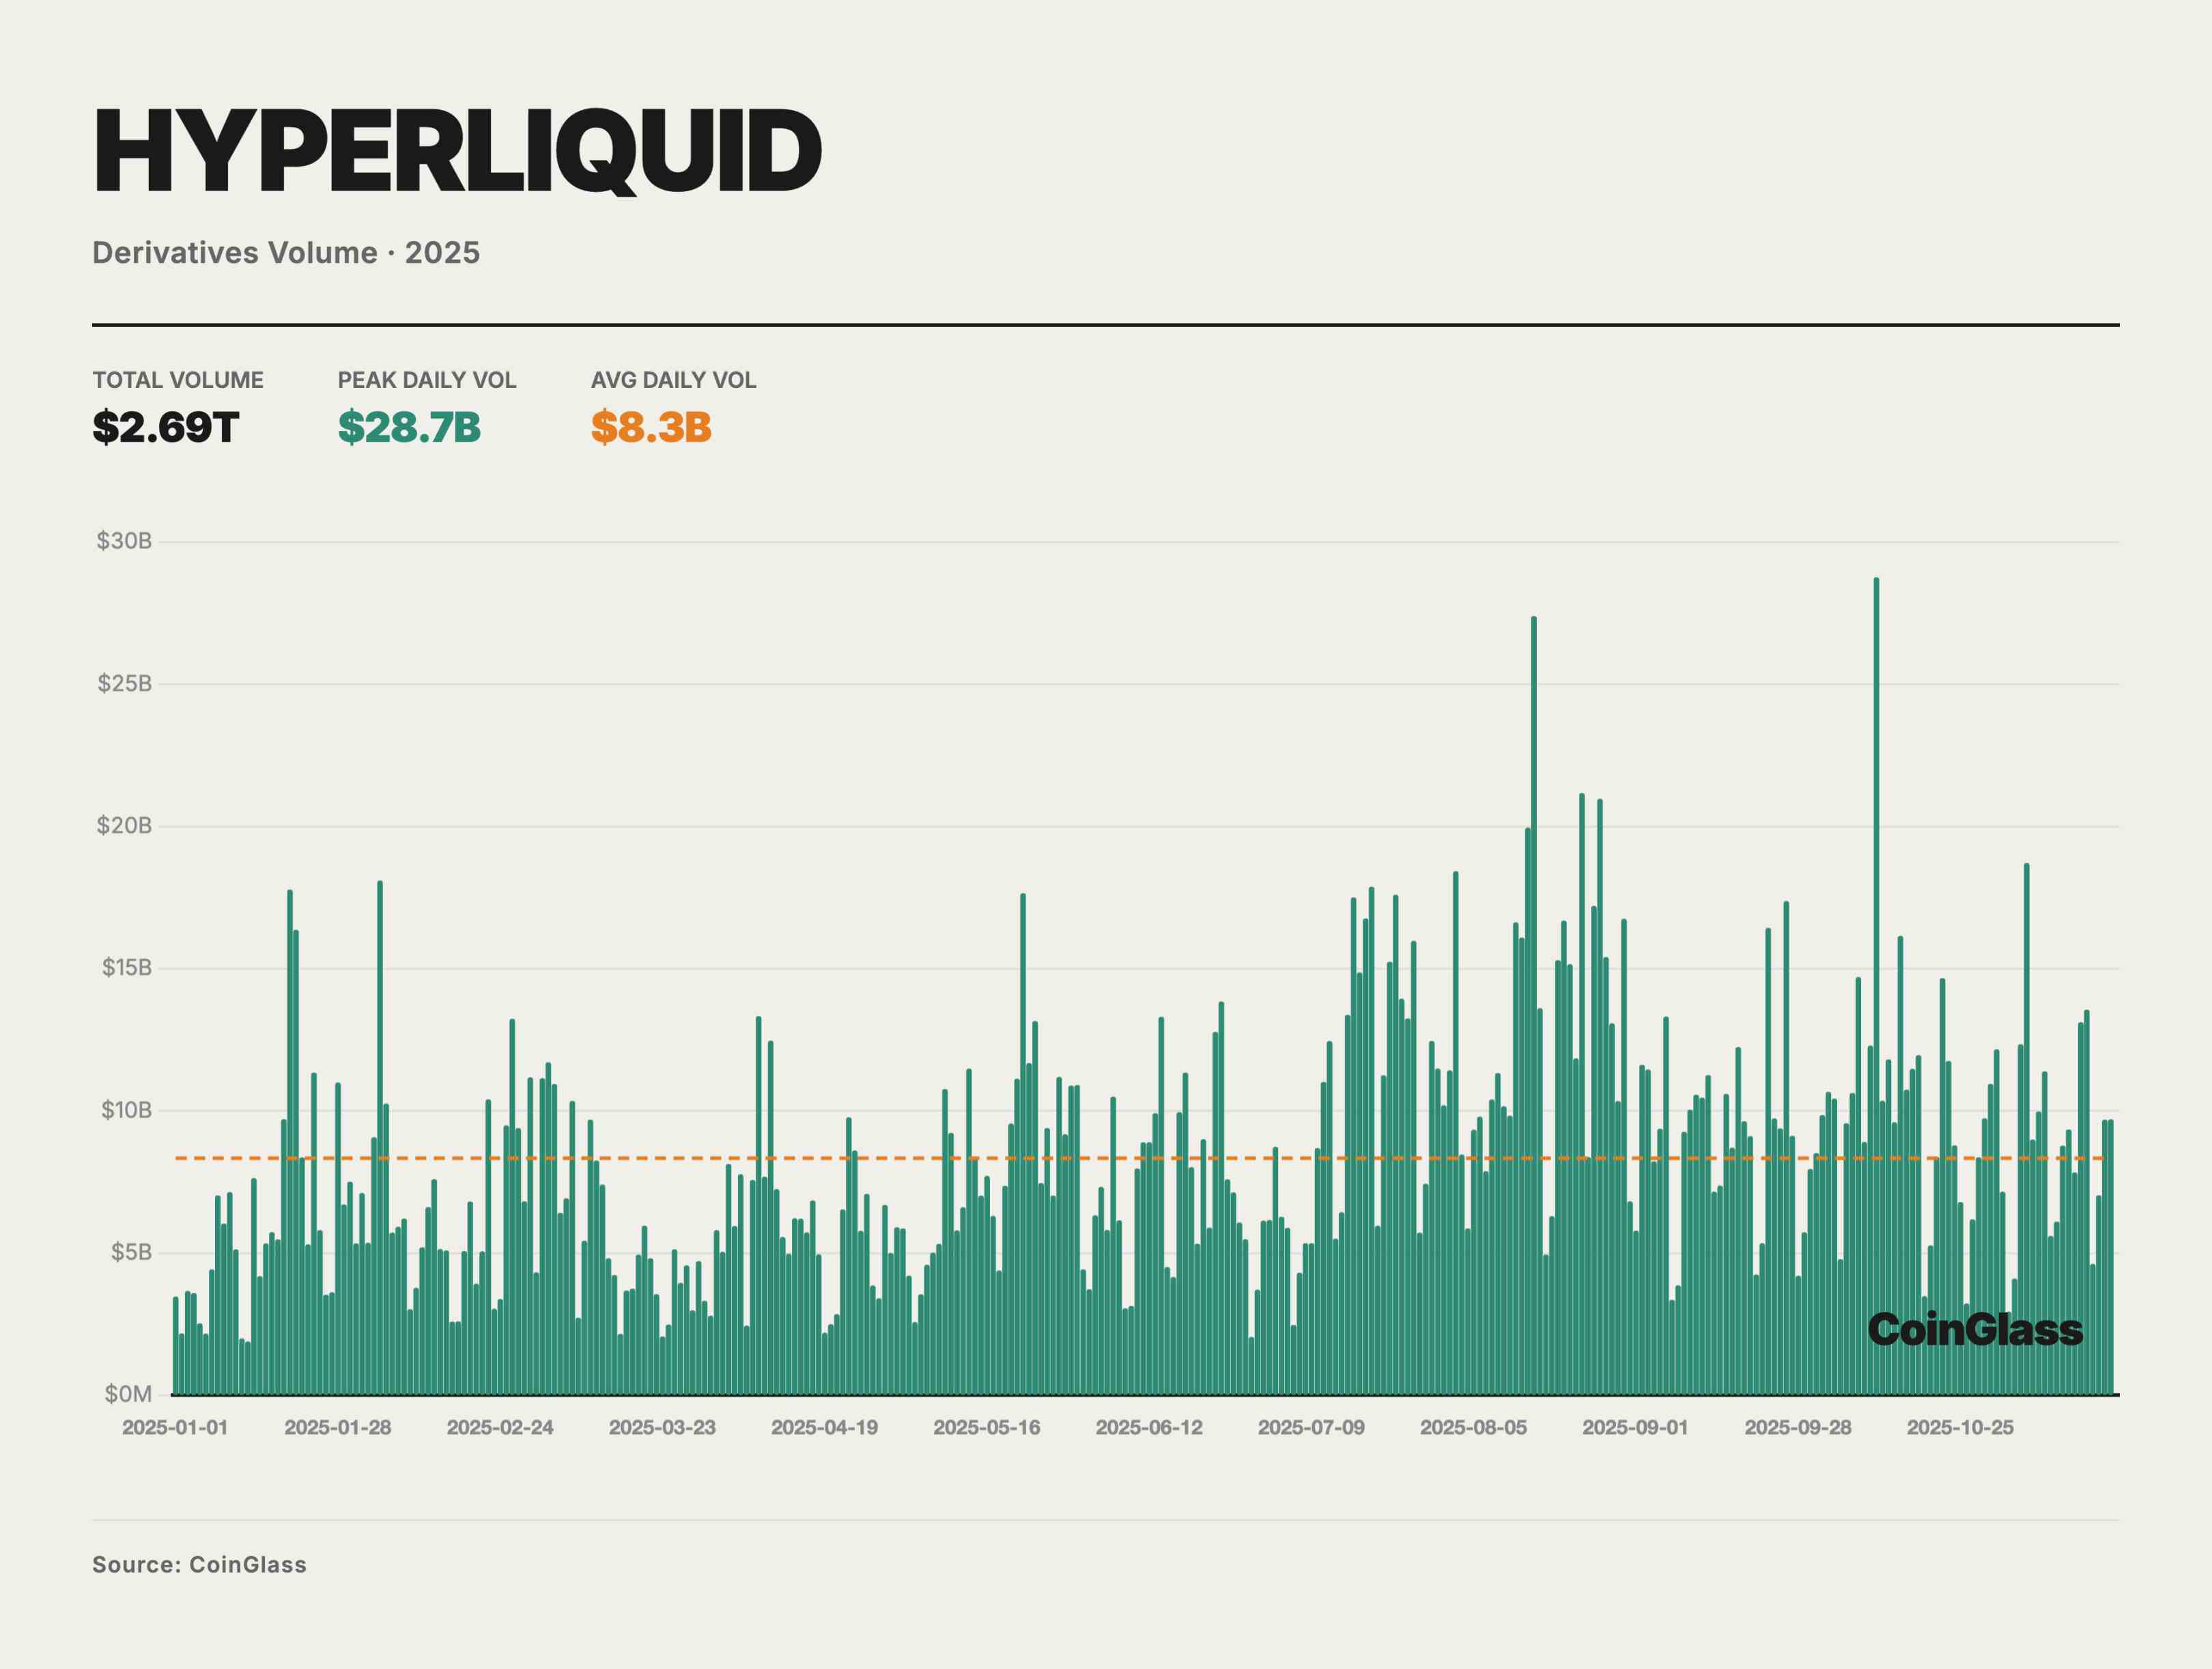
Hyperliquid was the undisputed leader in the PerpDEX market in 2025. It dominated the space in the first half, with market share peaking at 70–80%. In May, Hyperliquid’s share of on-chain perpetual contract trading volume reached a peak of ~71%. This staggering scale made Hyperliquid practically synonymous with the PerpDEX market in the first half of 2025.
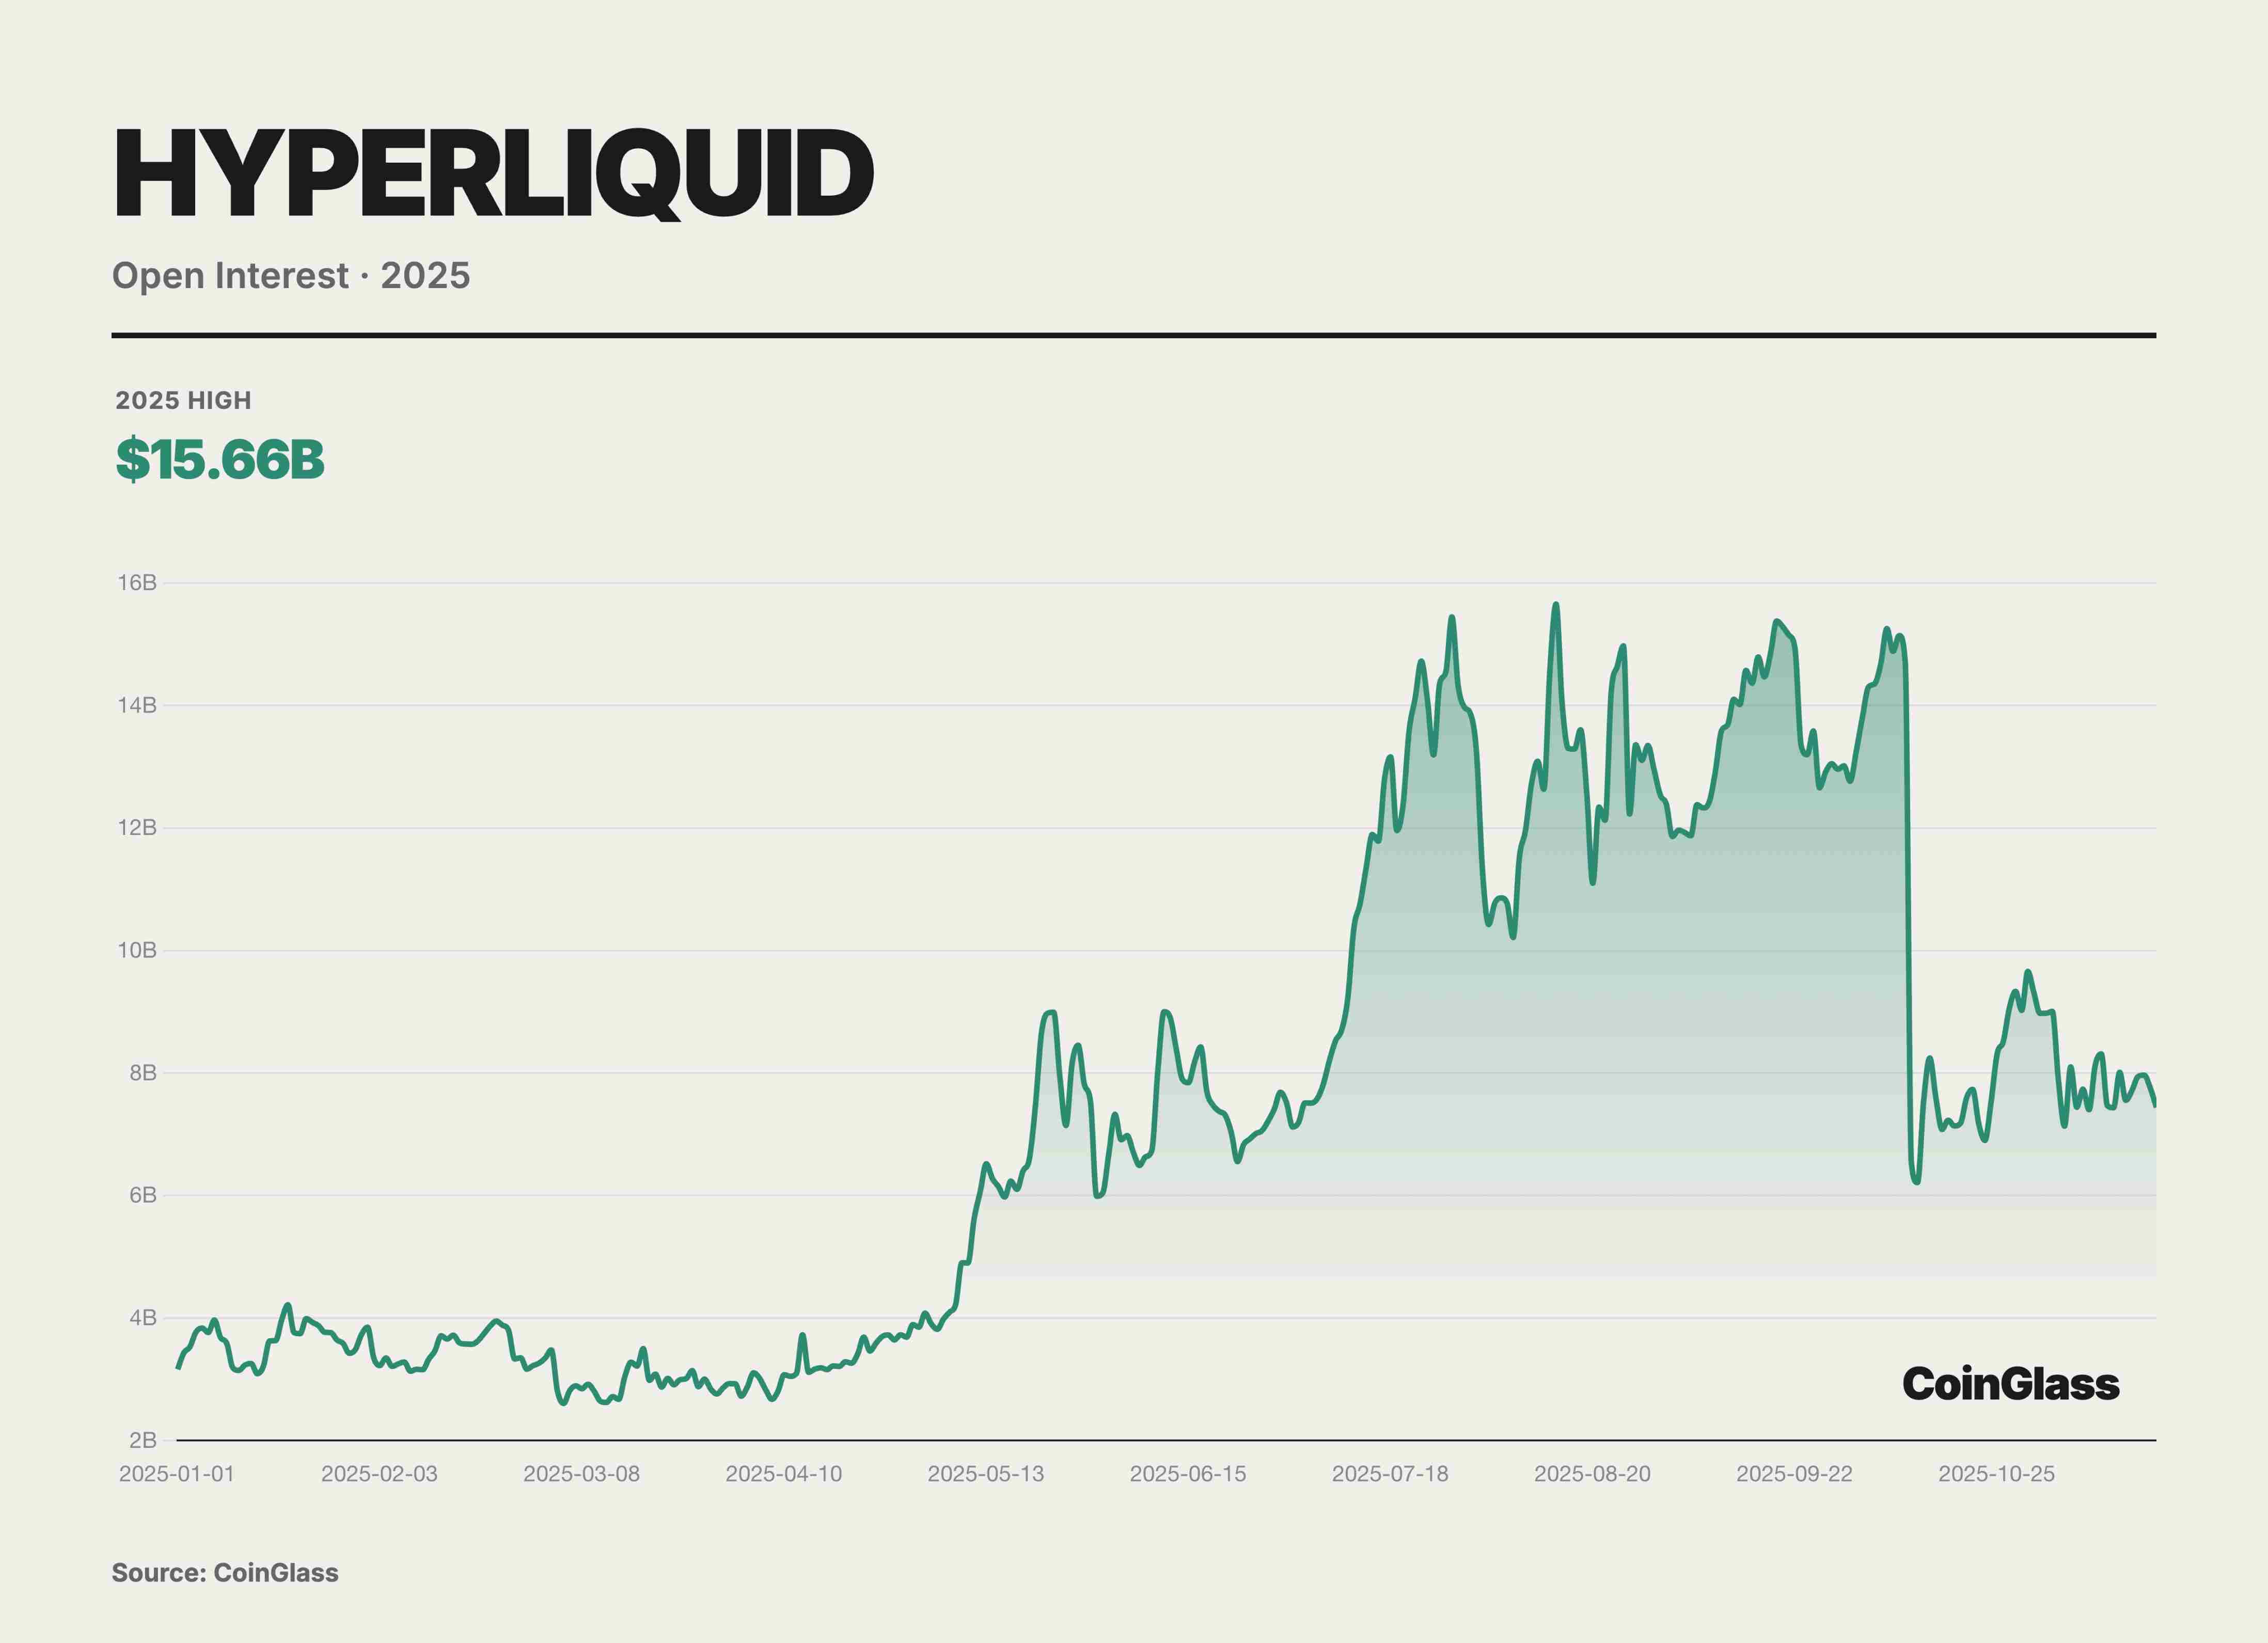
Hyperliquid not only attracted massive trading volume but also accumulated enormous open interest. Data from October 2025 showed its perpetual contracts OI reached $15 billion, accounting for ~63% of total OI across major decentralized perpetual platforms. This metric indicates that large amounts of capital chose to stay long-term on Hyperliquid, reflecting traders’ high trust in its liquidity and stability.
Unlike traditional Ethereum L1 or general-purpose blockchains, Hyperliquid built a custom Layer1 blockchain specifically designed for high-frequency derivatives trading. The chain uses its proprietary HyperBFT consensus mechanism, supporting up to 200,000 orders per second with transaction confirmation latency as low as 0.2 seconds. This performance even surpasses many centralized exchanges, making Hyperliquid the first on-chain exchange to deliver CEX-like speed and liquidity. The platform uses a fully on-chain order book (Central Limit Order Book) model, ensuring depth and quote quality, allowing professional traders to enjoy a matching experience comparable to traditional exchanges—all on-chain.
Although Hyperliquid dominated the first half of 2025, the PerpDEX market shifted from single-leader to multi-contender in the second half as new entrants emerged forcefully. From Q3 onward, Hyperliquid’s market share declined noticeably—from ~70–80% at mid-year to ~30–40% by year-end. On-chain data showed Hyperliquid’s trading volume share dropped to ~20% in November, while newcomers Lighter and Aster rose rapidly: Lighter captured ~27.7%, Aster ~19.3%, and dark horse EdgeX reached 14.6%. This meant the market, once dominated by Hyperliquid alone, transformed into a multipolar competitive landscape within months. High trading incentives, differentiated product strategies, and capital backing propelled these challengers, pushing PerpDEX competition into a white-hot phase in the second half of 2025.
Prediction Markets
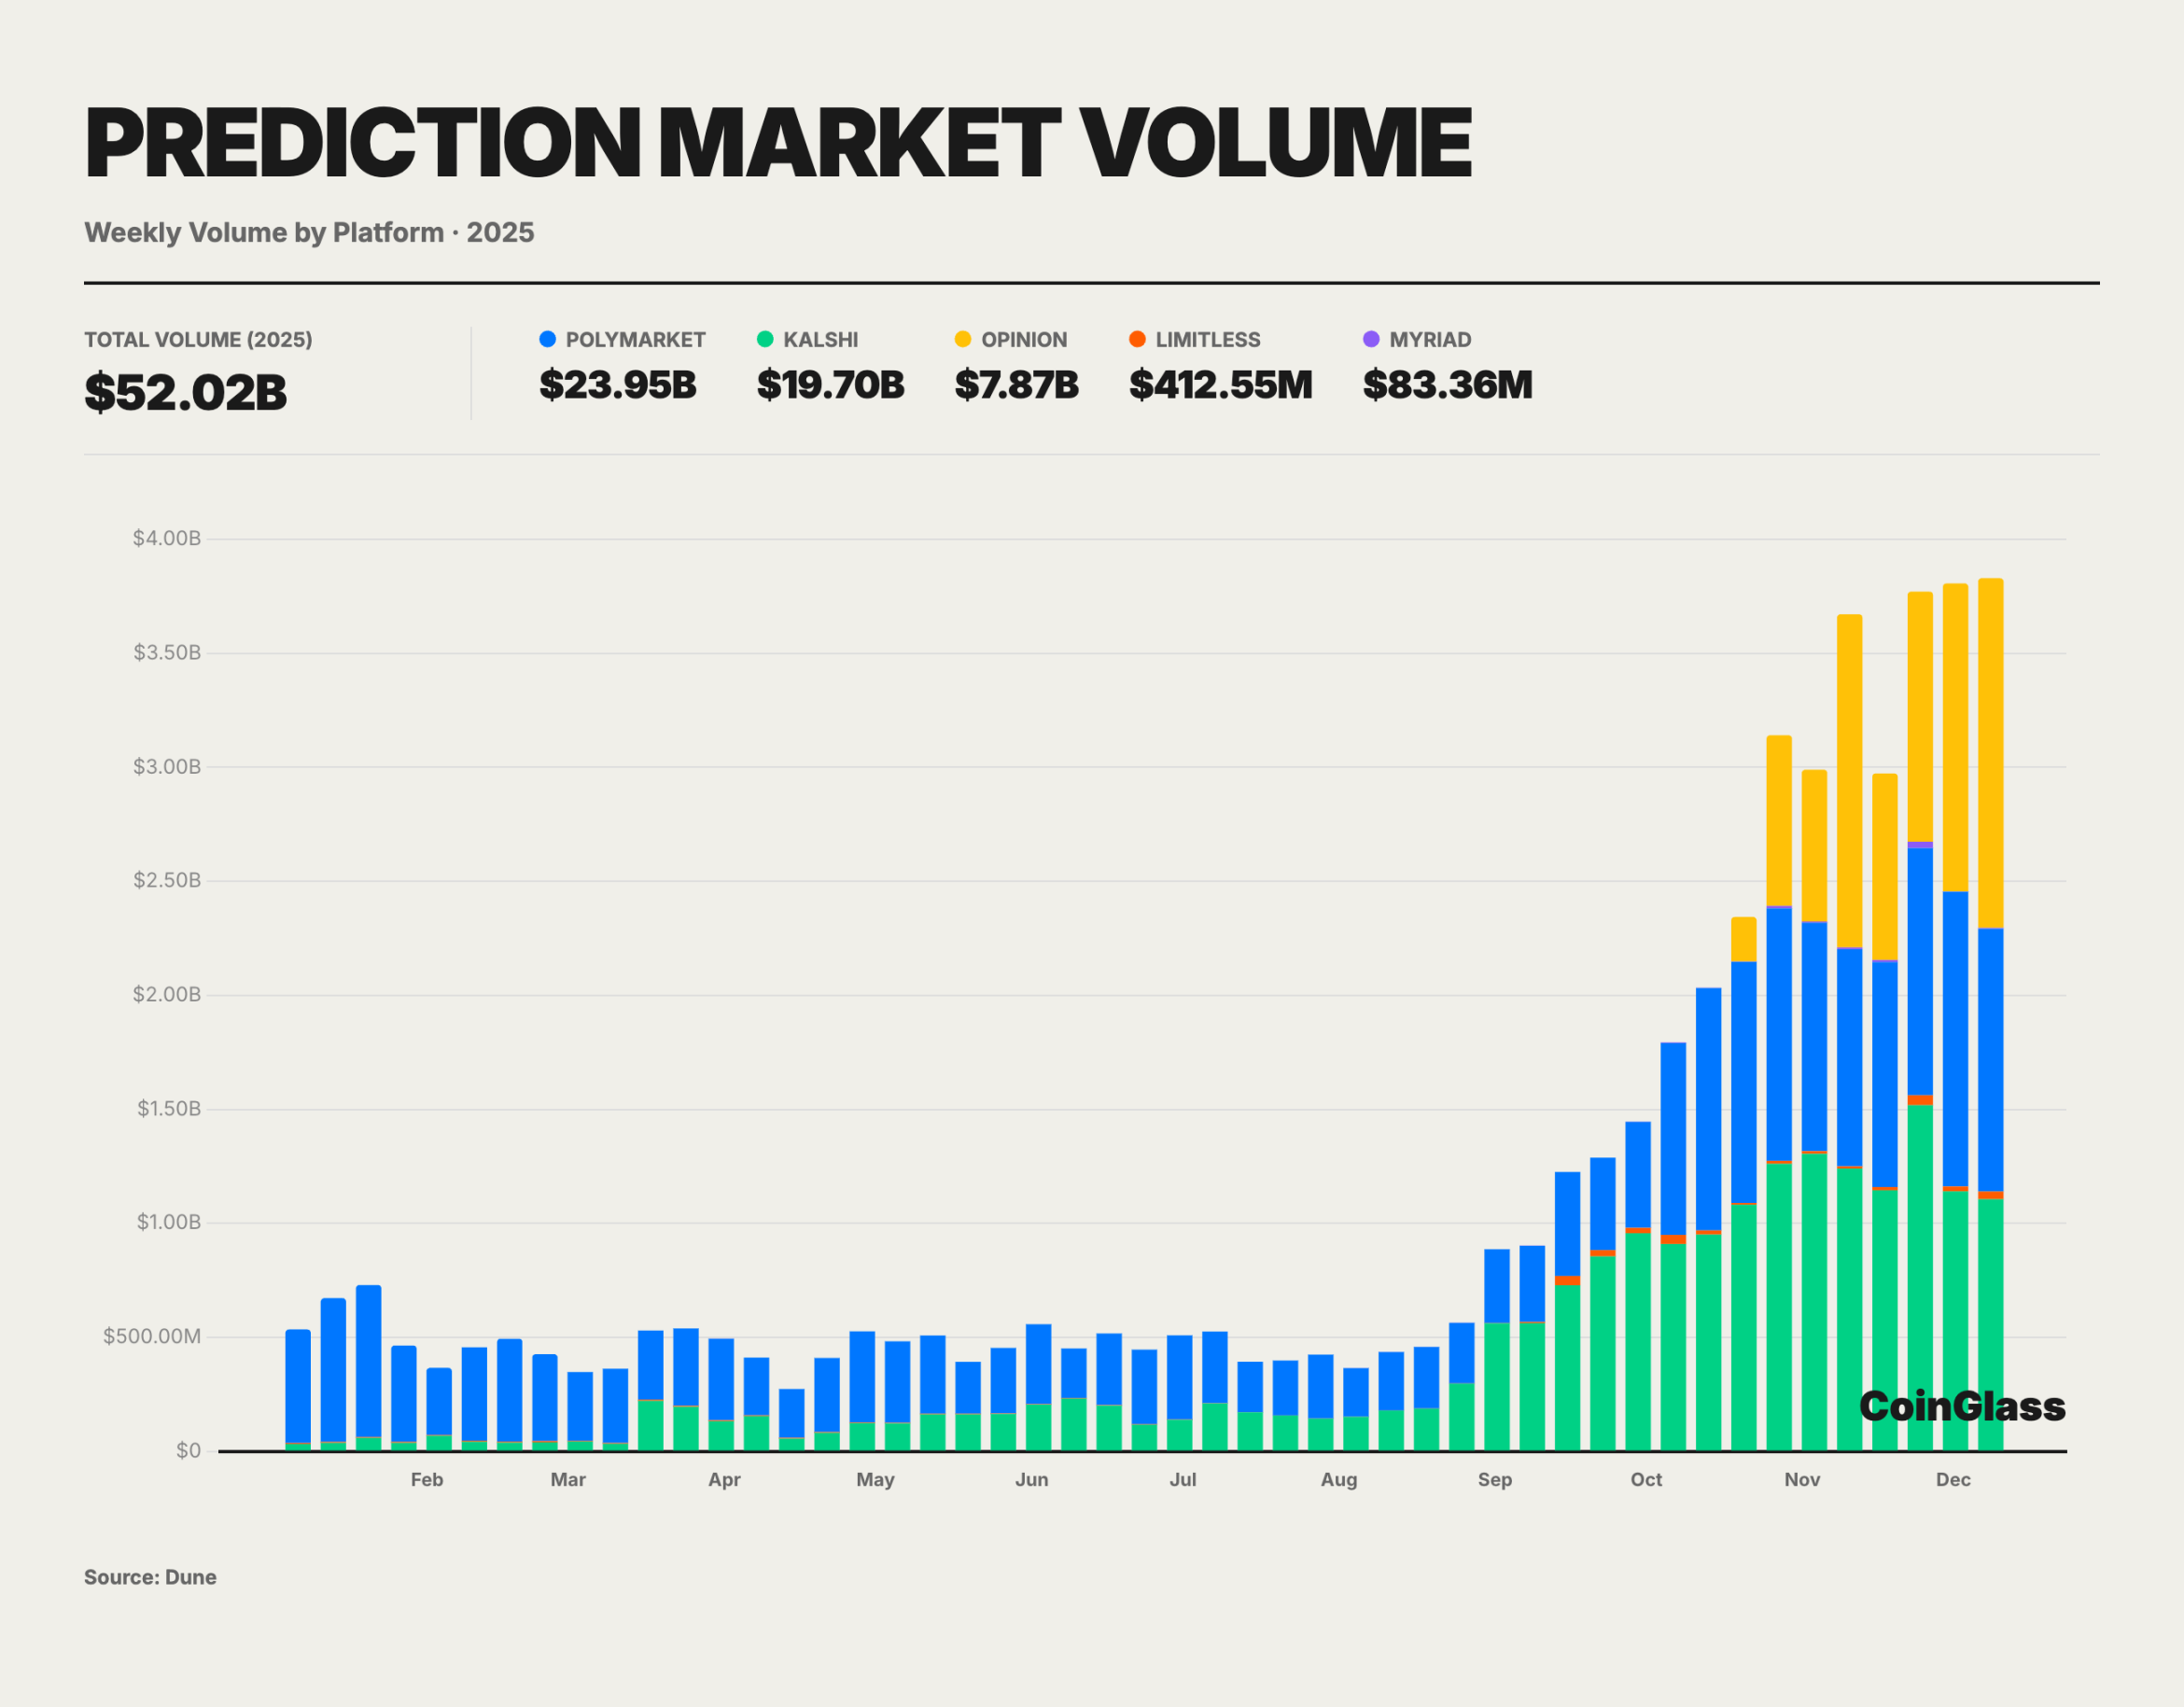
In 2025, crypto prediction markets experienced explosive growth, with total trading volume from January to November reaching ~$52 billion—already surpassing the peak levels seen during the 2024 U.S. election period.
As the current largest prediction market by trading volume, Polymarket’s cumulative trading in 2025 exceeded $23 billion. The platform’s daily active users approached 60,000, nearly tripling from年初; estimated monthly active user peaks exceeded 450,000, showing significant increases in public participation. Currently, about 1.35 million users are registered on Polymarket, reflecting rapid user base expansion over the past year. Large user numbers and abundant liquidity enabled several popular markets to reach hundreds of millions in cumulative trading per contract. Deeply liquid markets can now accommodate tens of millions in capital flow without severe slippage. In high-liquidity, clear-definition, and settleable scenarios, prediction market prices are often used as supplementary indicators. Reports indicated that during the November 2024 U.S. election, Polymarket’s single-day trading volume briefly reached nearly $400 million, accurately predicting the outcome while traditional polls showed偏差. This case highlighted the information aggregation and pricing accuracy of decentralized prediction markets in major events, laying the foundation for their further mainstreaming in 2025.
Web3 Wallets
In 2025, Web3 wallets underwent a fundamental strategic leap as the primary touchpoint connecting users to decentralized networks. Wallets are no longer mere private key vaults or simple transfer tools—they have evolved into on-chain traffic gateways integrating digital identity (DID), asset management, decentralized application (DApp) operating systems, and social graphs.
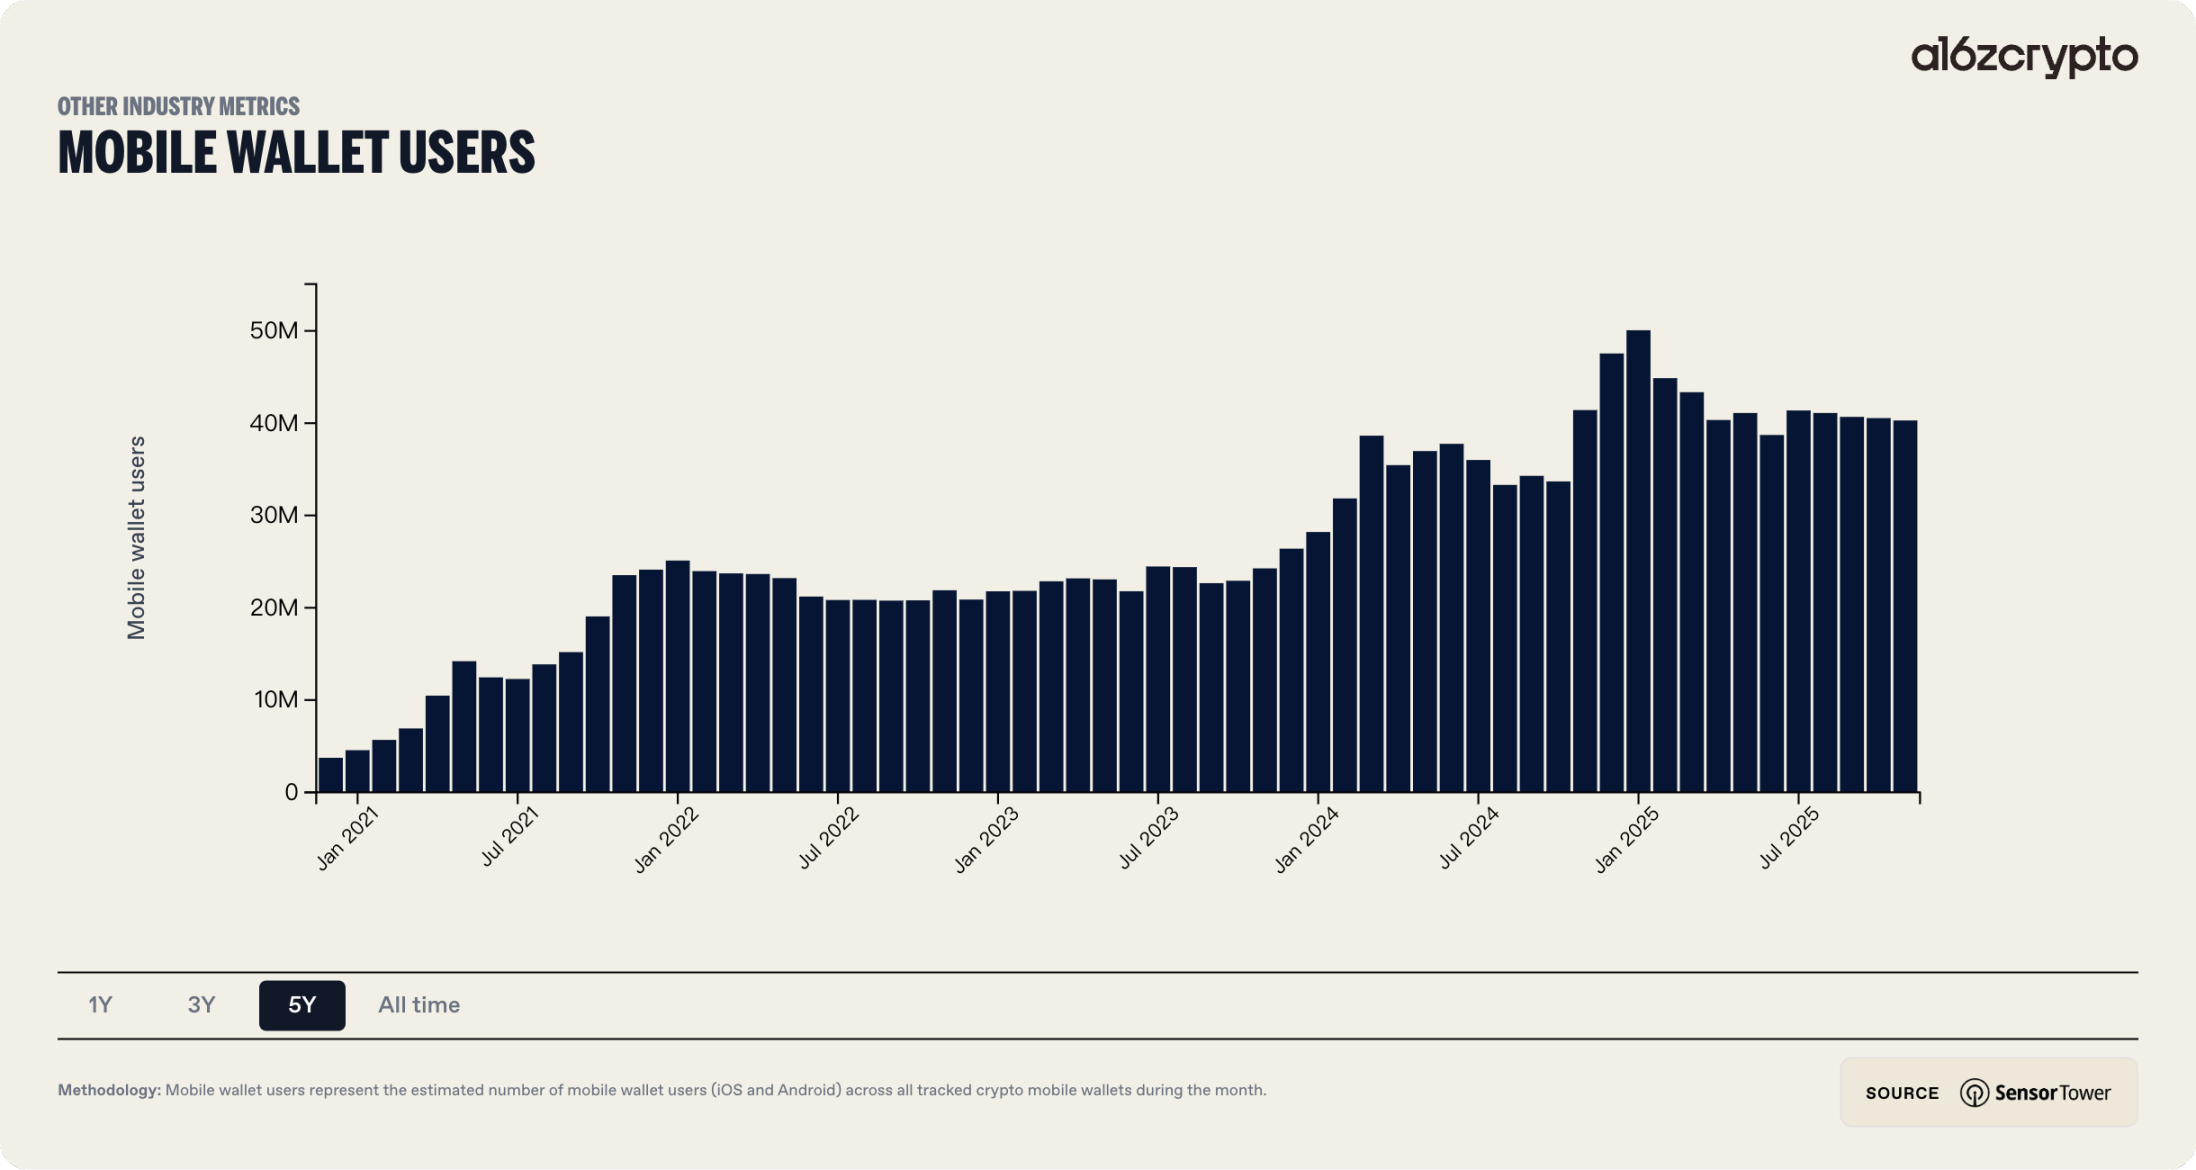
Looking back over the past five years, the form of Web3 wallets has undergone dramatic evolution. Early wallets required high technical literacy—users had to manage seed phrases, understand gas fees, and manually configure networks. This high barrier led to massive user attrition, with over 50% reportedly abandoning setup due to complexity. The most notable industry trend this year was the large-scale adoption of account abstraction (AA) and standardization of chain abstraction technologies. The convergence of these two technologies enabled Web3 wallets to finally compete with Web2 financial apps in user experience. Complex private key management, opaque gas fee mechanisms, and fragmented multi-chain liquidity are now encapsulated by intelligent backend protocols, reducing user friction to historic lows.
Simultaneously, institutional capital inflows forced upgrades in wallet security architecture. The combination of Multi-Party Computation (MPC) and Trusted Execution Environments (TEE) has become standard in leading wallets, completely transforming the fragile “private key is everything” security model.
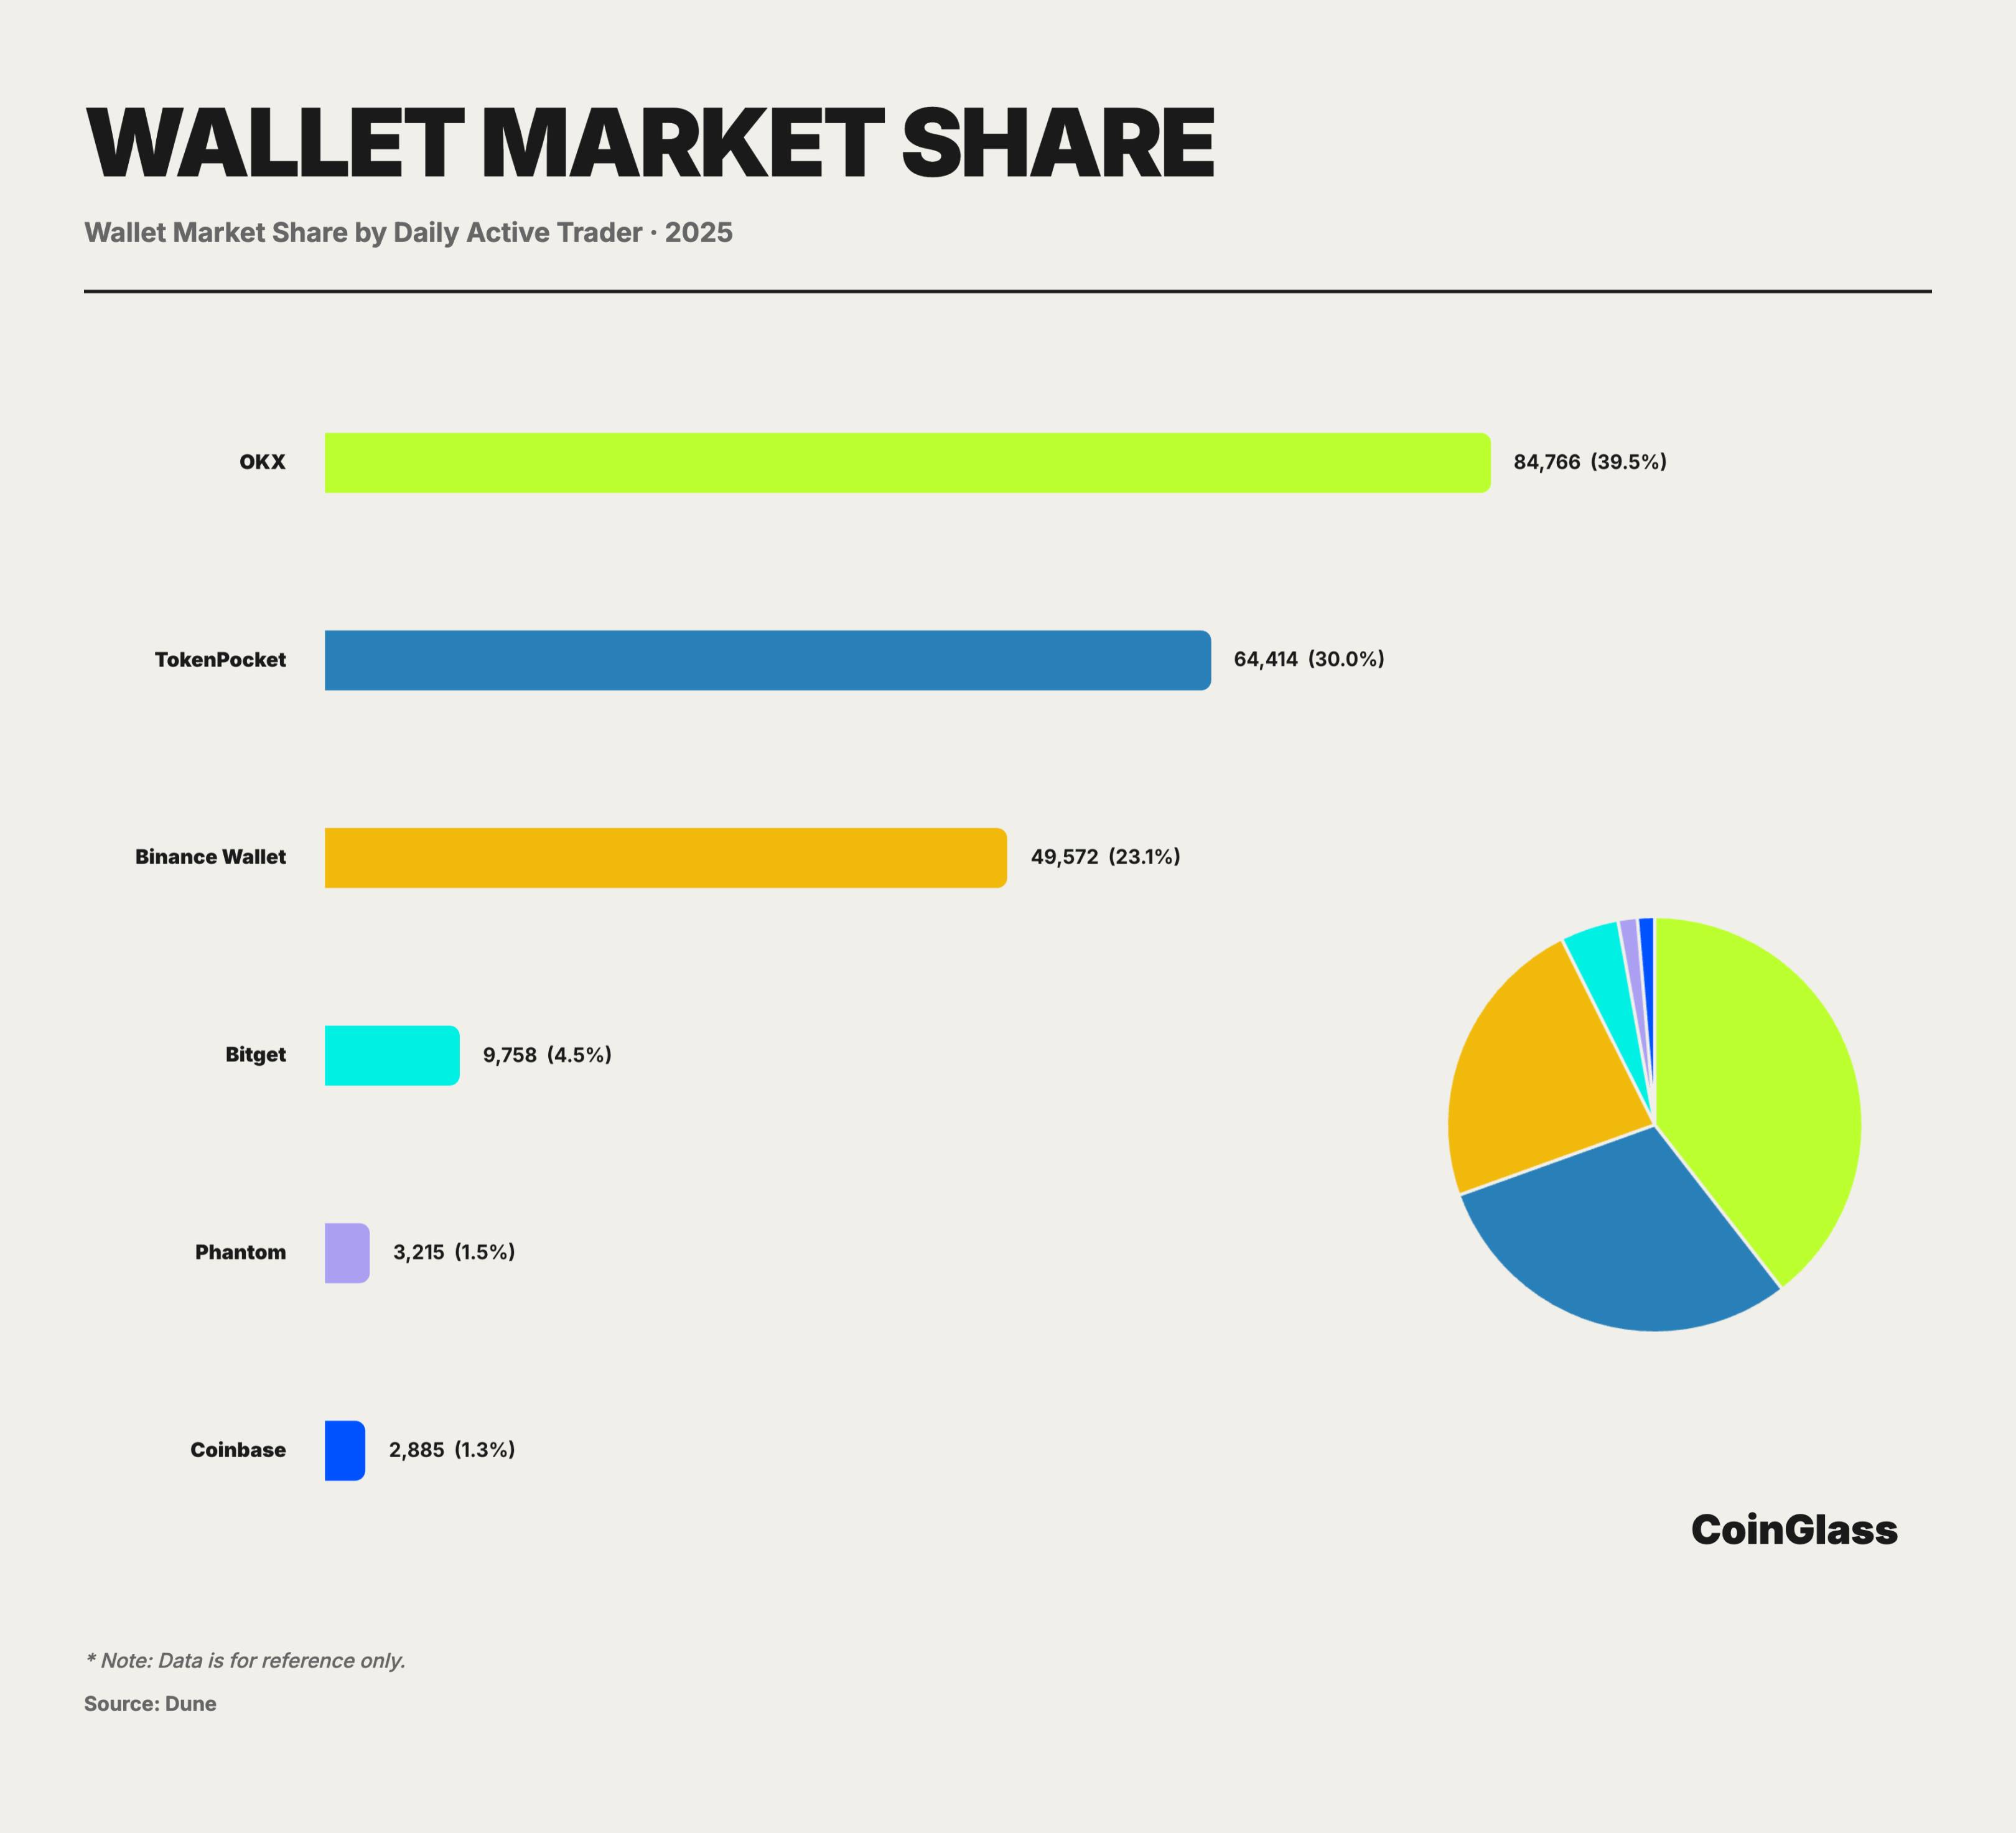
In the 2025 one-leader-multiple-challenger market, OKX Web3 Wallet, combining technological innovation with full-ecosystem integration, leads the industry in usability and feature integration, widely recognized as the overall category leader. As a super aggregator for Web3 access, OKX Wallet boasts over 5 million monthly active users. Its core design philosophy is to hide complex on-chain logic behind an ultra-simple interface. Through a unified dashboard, users can easily manage assets across more than 100 public chains without manually adding contracts
Join TechFlow official community to stay tuned
Telegram:https://t.me/TechFlowDaily
X (Twitter):https://x.com/TechFlowPost
X (Twitter) EN:https://x.com/BlockFlow_News