2025 Epic Showdown: Has DEX Really Overtaken CEX This Time?
TechFlow Selected TechFlow Selected
2025 Epic Showdown: Has DEX Really Overtaken CEX This Time?
Not replacement, but standing side by side; not confrontation, but co-construction.
Author: Cecelia, TechFlow

Will DEX truly replace CEX?
From a relatively small market share in 2020 to rapidly rising trading volumes this year, the presence of decentralized exchanges (DEX) is indeed growing stronger.
The DEX comeback seems closer than ever—yet perhaps not quite yet?
Don't rush to applaud for the victory of decentralization, nor dismiss it with old arguments like complex processes and poor user experience.
Read this report first—then judge for yourself.
2025: The Year DEX Liquidity Took Off
Compared to the slow recovery in previous years, 2025 was truly the year when DEX liquidity took flight.
In both scale and growth rate, DEX trading volume saw a significant leap, reaching nearly four times its earlier levels.
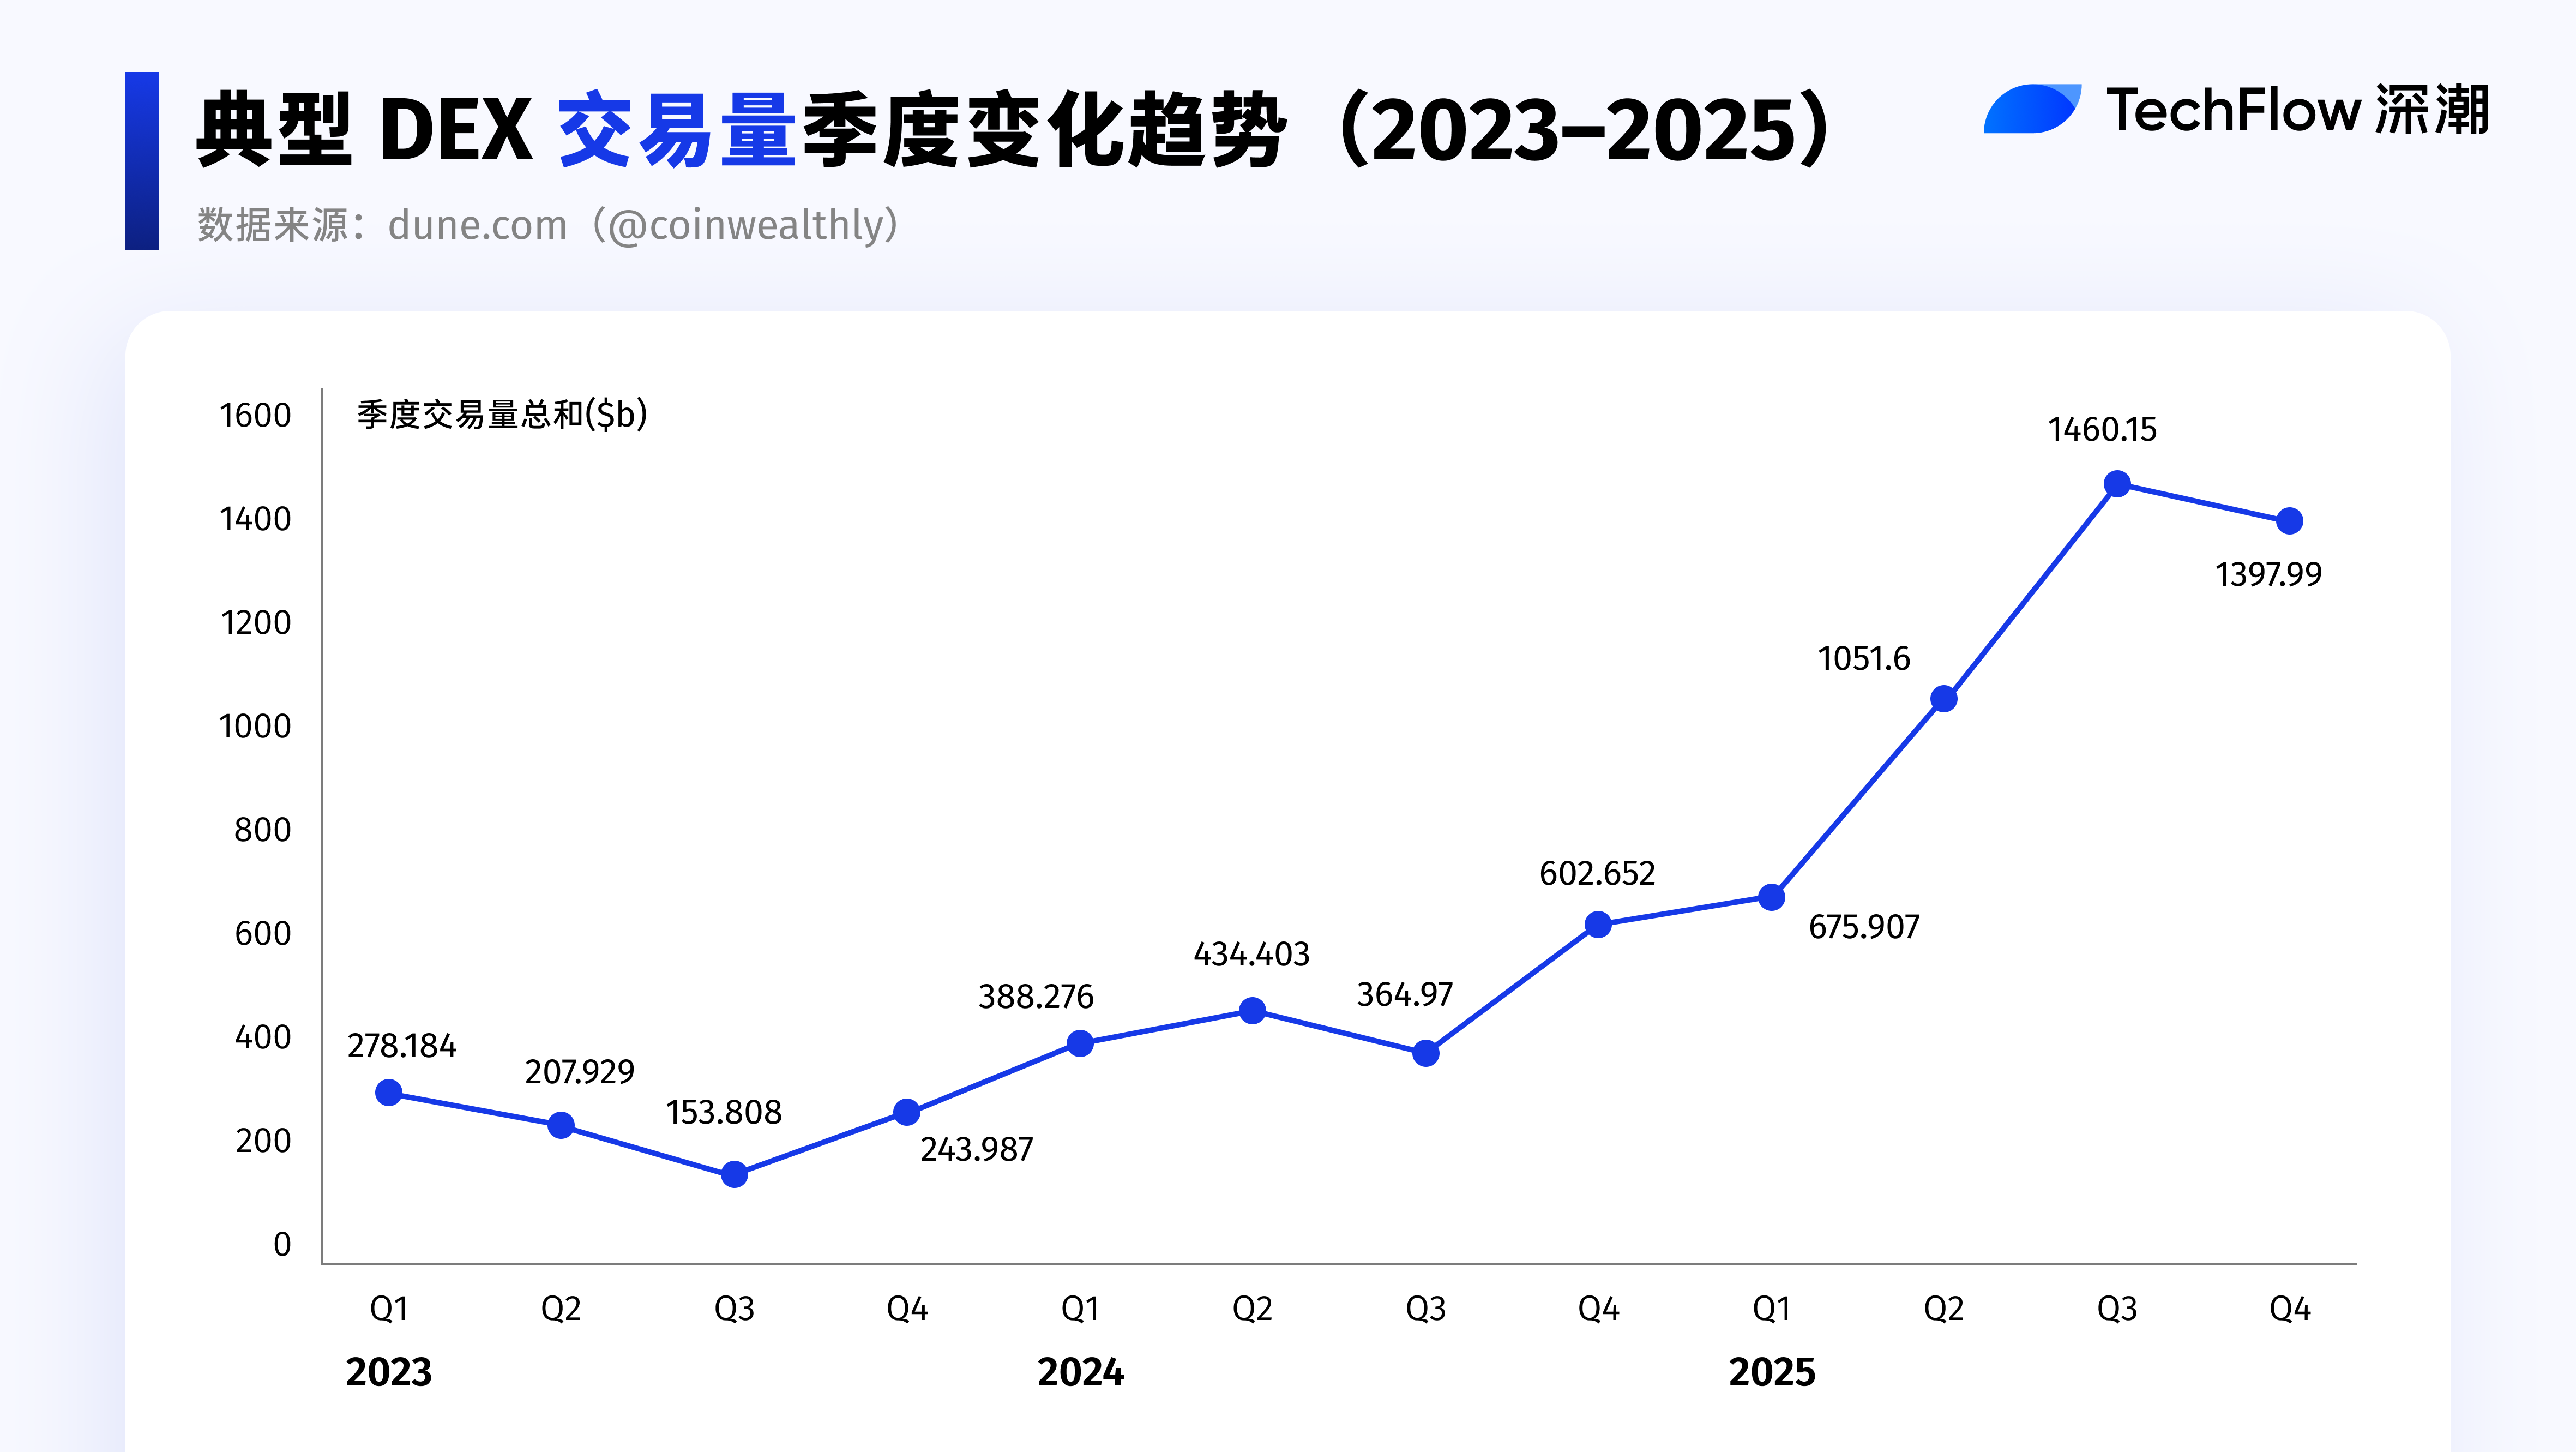
Data source: dune.com (@coinwealthly)
If broken down by quarter, this surge wasn’t sudden.
The 2025 breakout was essentially a continuation of the growth trend that began in Q4 2024.
It was in the fourth quarter of 2024 that DEX trading activity and liquidity started accelerating, setting the stage for full amplification over the following year.
In short, the turning point for DEX arrived in Q4 2024, and 2025 extended and amplified this momentum.
Looking Back at the Turning Point: Acceleration in 2024Q4 and Amplification in 2025
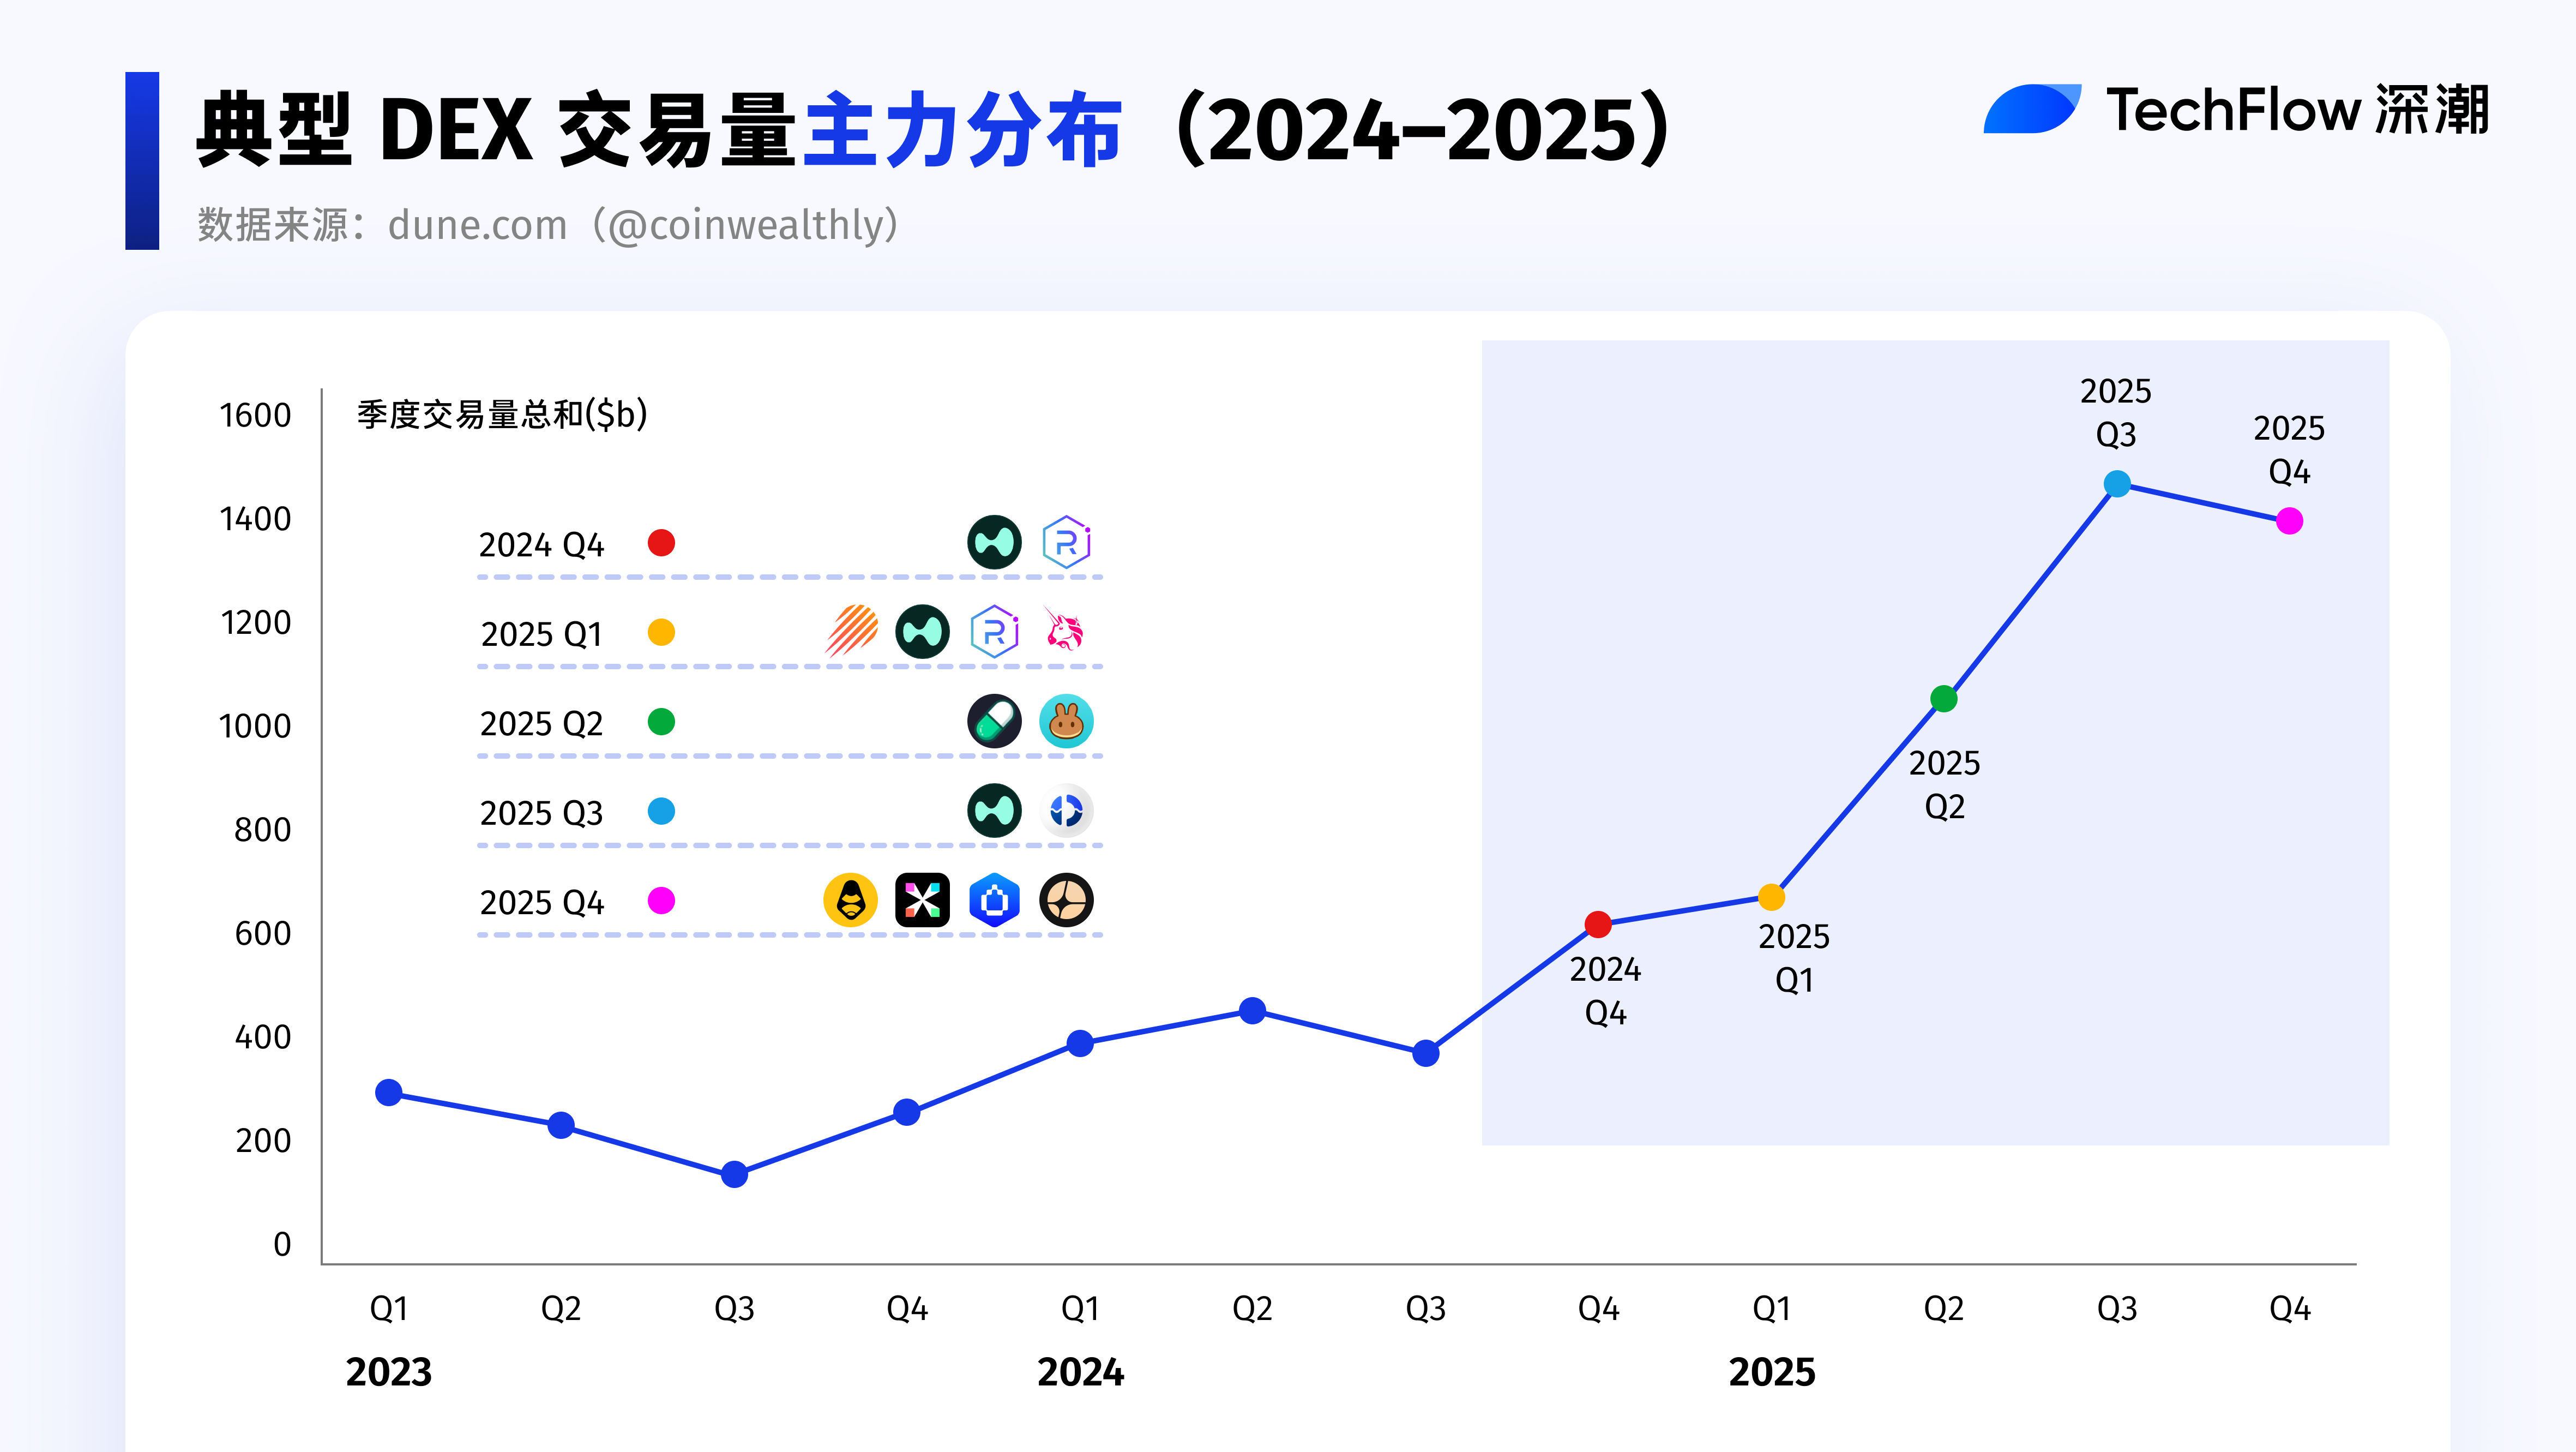
Quarterly Review: Who Led Each Quarter?
2024Q4: The Trend Begins
- Dexes in the Solana ecosystemfirst surpassed Ethereum in quarterly trading volume, significantly increasing in activity and becoming a temporary liquidity hub.
- The rise of AI narratives and new token launch platforms generated numerous new trading pairs, substantially boosting DEX trading frequency and cumulative trading volume.
- Solana DEX: New tokens were primarily traded on Solana-based DEXs. Platforms like Raydium benefited from “graduation” and migration flows from token launch platforms such as Pump.fun, capturing substantial post-launch liquidity and solidifying their role as core venues for spot trading on Solana.
- Hyperliquid: Leveraging a successful HYPE airdrop and superior product design, Hyperliquid rapidly expanded its share in the decentralized perpetual futures market, achieving over 55% market share.
2025Q1: Shifting Rankings and Rotating Trends
- The race for the top DEX spot turned into a "musical chairs" game, with leading ecosystems repeatedly swapping positions, making it hard to declare a clear winner.
- During periods of high activity in celebrity memes and AI-themed meme coins, Solana-based DEXs saw rapid volume growth, temporarily taking the lead.
- As meme coin trading cooled in February–March, Ethereum regained the top spot in DEX trading volume thanks to more stable liquidity and structural capital inflows.
- CEX Custody Risks Exposed: Some users began shifting toward non-custodial, on-chain verifiable DEXs, driving behavioral migration.
2025Q2: Ecosystem Synergy and Capital Migration
- PancakeSwap: Binance’s Alpha initiative routed related trades to PancakeSwap, directly boosting transaction activity in the BSC ecosystem. As a result, PancakeSwap became the biggest beneficiary of cross-ecosystem collaboration, with quarterly trading volume surging by 539.2%.
- Ethereum's Pectra upgrade went live, triggering strong market reactions. Ethereum surged nearly 44% during Asian morning trading—one of its largest daily gains since 2021—shifting market focus from Solana and meme coins to broader ecosystem allocations.
- With accelerated liquidity migration, competition between Solana and BSC exhibited clear suction effects, with capital and trading activity rapidly rotating across ecosystems.
2025Q3: Intensifying Competition and Product Integration
- CEX trading volumes grew more significantly, lifting overall market activity.
- Uniswap: Regained part of its market share, standing alongside PancakeSwap as a leader in the DEX space.
- Competition in Perp DEX heated up noticeably. Emerging platforms like Aster, Lighter, and edgeX rapidly expanded in trading volume and user base, directly challenging the dominant Hyperliquid. The market entered a fiercely competitive phase, with platforms using airdrops, points, and zero-fee promotions to attract active traders, further fueling demand for on-chain derivatives trading.
- DEX Ecosystem: DEX aggregators and infrastructure continued improving, enhancing user experience, retention, and trading stickiness.
- Jupiter: Jupiter Lend attracted over $1 billion in deposits within ten days of launch, quickly unlocking previously constrained lending demand within the Solana ecosystem. Supported by Fluid’s underlying lending architecture, Jupiter Lend’s success validated the strong capital appeal of the DEX + lending model.
2025Q4: Extreme Market Volatility and Sector Divergence
- The extreme market conditions triggered by the October 11 liquidation event temporarily spiked trading volumes, causing阶段性 data inflation. This event exposed systemic risks at CEXs while also impacting DEXs through cascading loans and leveraged liquidations.
- Lighter and edgeX: As market confidence gradually recovered, the Perp DEX sector returned to its growth trajectory. Platforms like Lighter and edgeX rapidly expanded in volume and users, narrowing the gap with Hyperliquid and pushing the Perp DEX market into a high-intensity competition phase.
- Aster: After CZ publicly disclosed his personal ASTER holdings, Aster gained listing support from major platforms including Binance and Robinhood. As a leading Perp DEX on BSC, Aster now has the capability to compete head-to-head with top-tier platforms like Solana-based Hyperliquid in the perpetual DEX space.
- HumidiFi: In the spot DEX space, Uniswap’s market share has steadily declined since late Q3, with new entrants like HumidiFi capturing some of its volume—indicating a shift from single-leader dominance to a more fragmented, multi-platform competitive landscape.
After reviewing the top performers each quarter, let’s dive deeper into Perp DEX and Spot DEX separately.
Perp DEX: The True Growth Engine of 2025
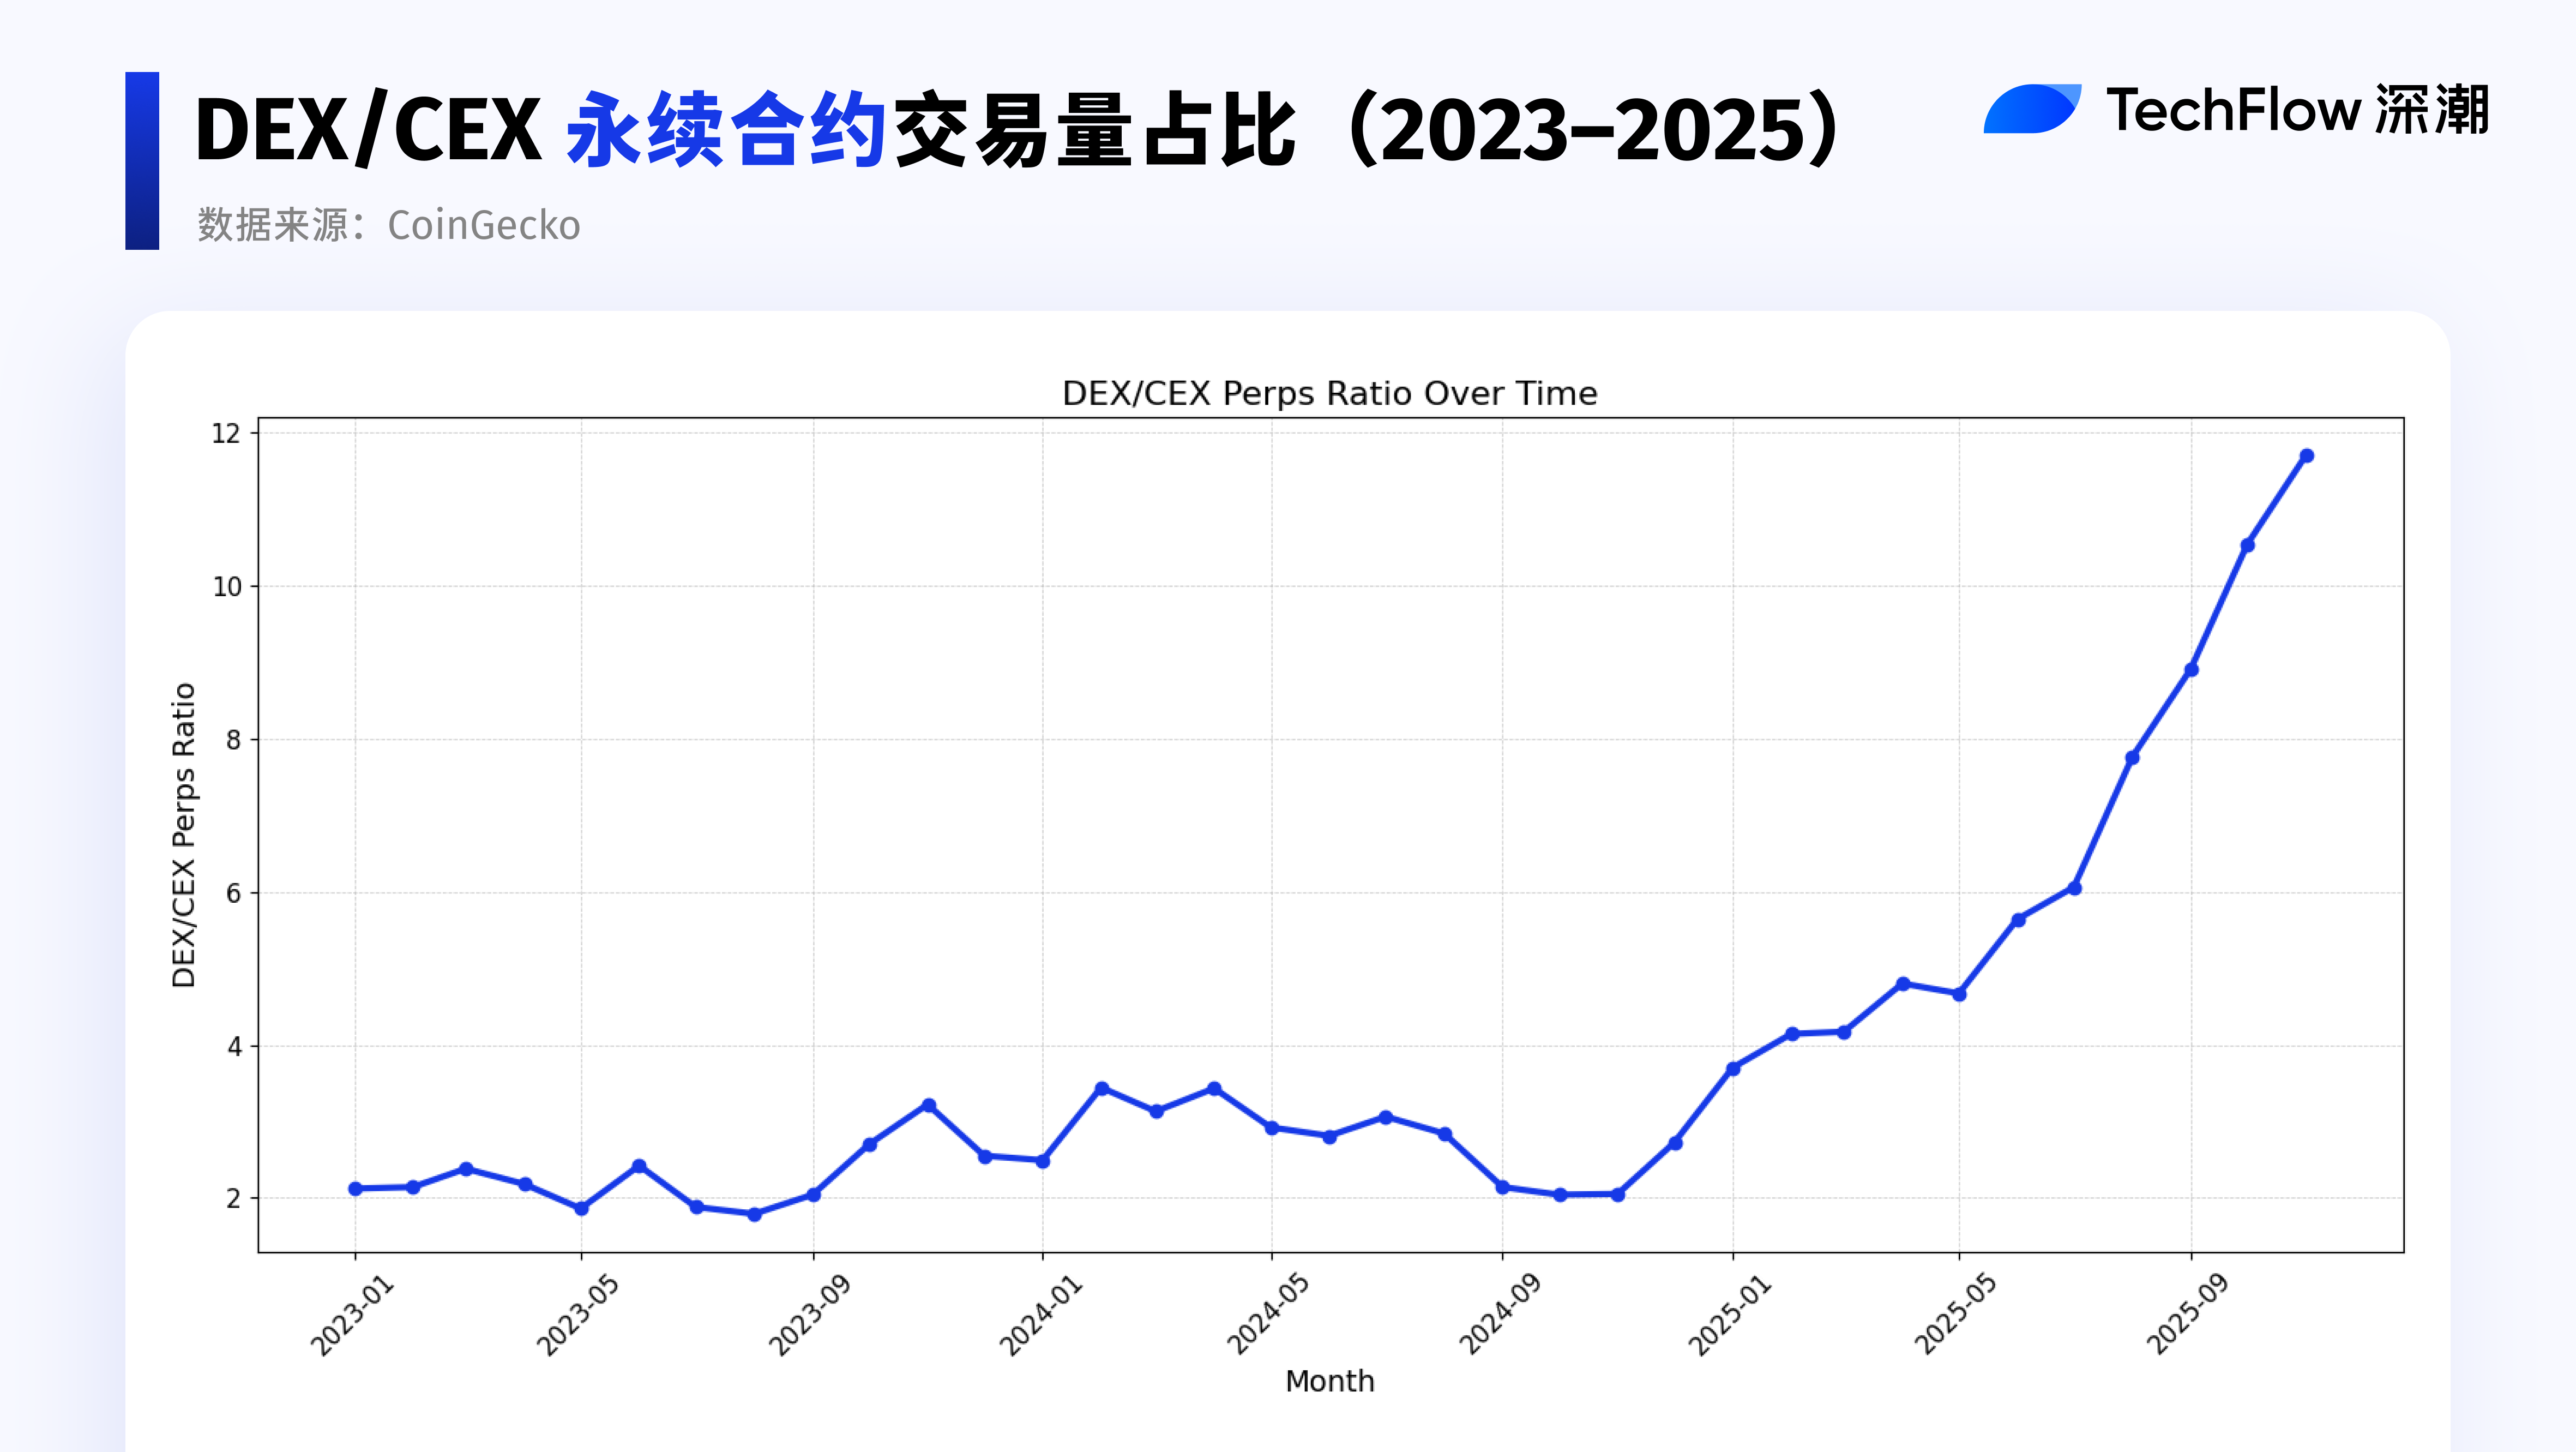
Data source: CoinGecko
This chart shows the DEX/CEX ratio for perpetual contract trading volume over the past three years.
Notably, this metric rose consistently throughout 2025, whereas prior performance had been relatively flat.
2025 marked the real takeoff year for Perp DEX.
According to DeFiLlama, the incremental trading volume of Perp DEX reached $7.348 trillion in 2025 alone.
By comparison, the cumulative trading volume of perpetual DEX from early 2021 to end of 2024 was only $4.173 trillion.
In other words, Perp DEX achieved a net trading volume growth of approximately 176% in just one year—surpassing the total volume of the previous four years combined.
Moreover, starting in Q3, trading volume began accelerating sharply. With intensifying competition and maturing innovative products, the Perp DEX sector started attracting sustained capital inflows and rising liquidity.
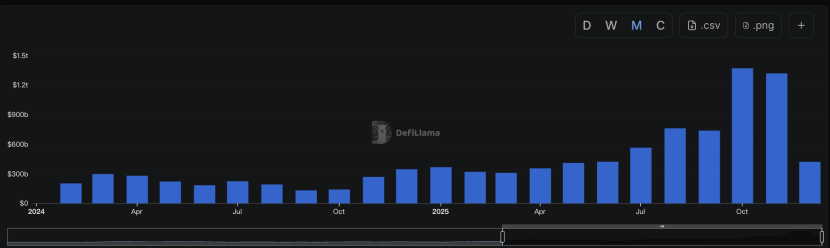
Data source: DeFiLlama
From being initially limited in scale and fragmented in participation, Perp DEX has now entered a new tier of market activity—ignited simultaneously by market sentiment and capital structure.
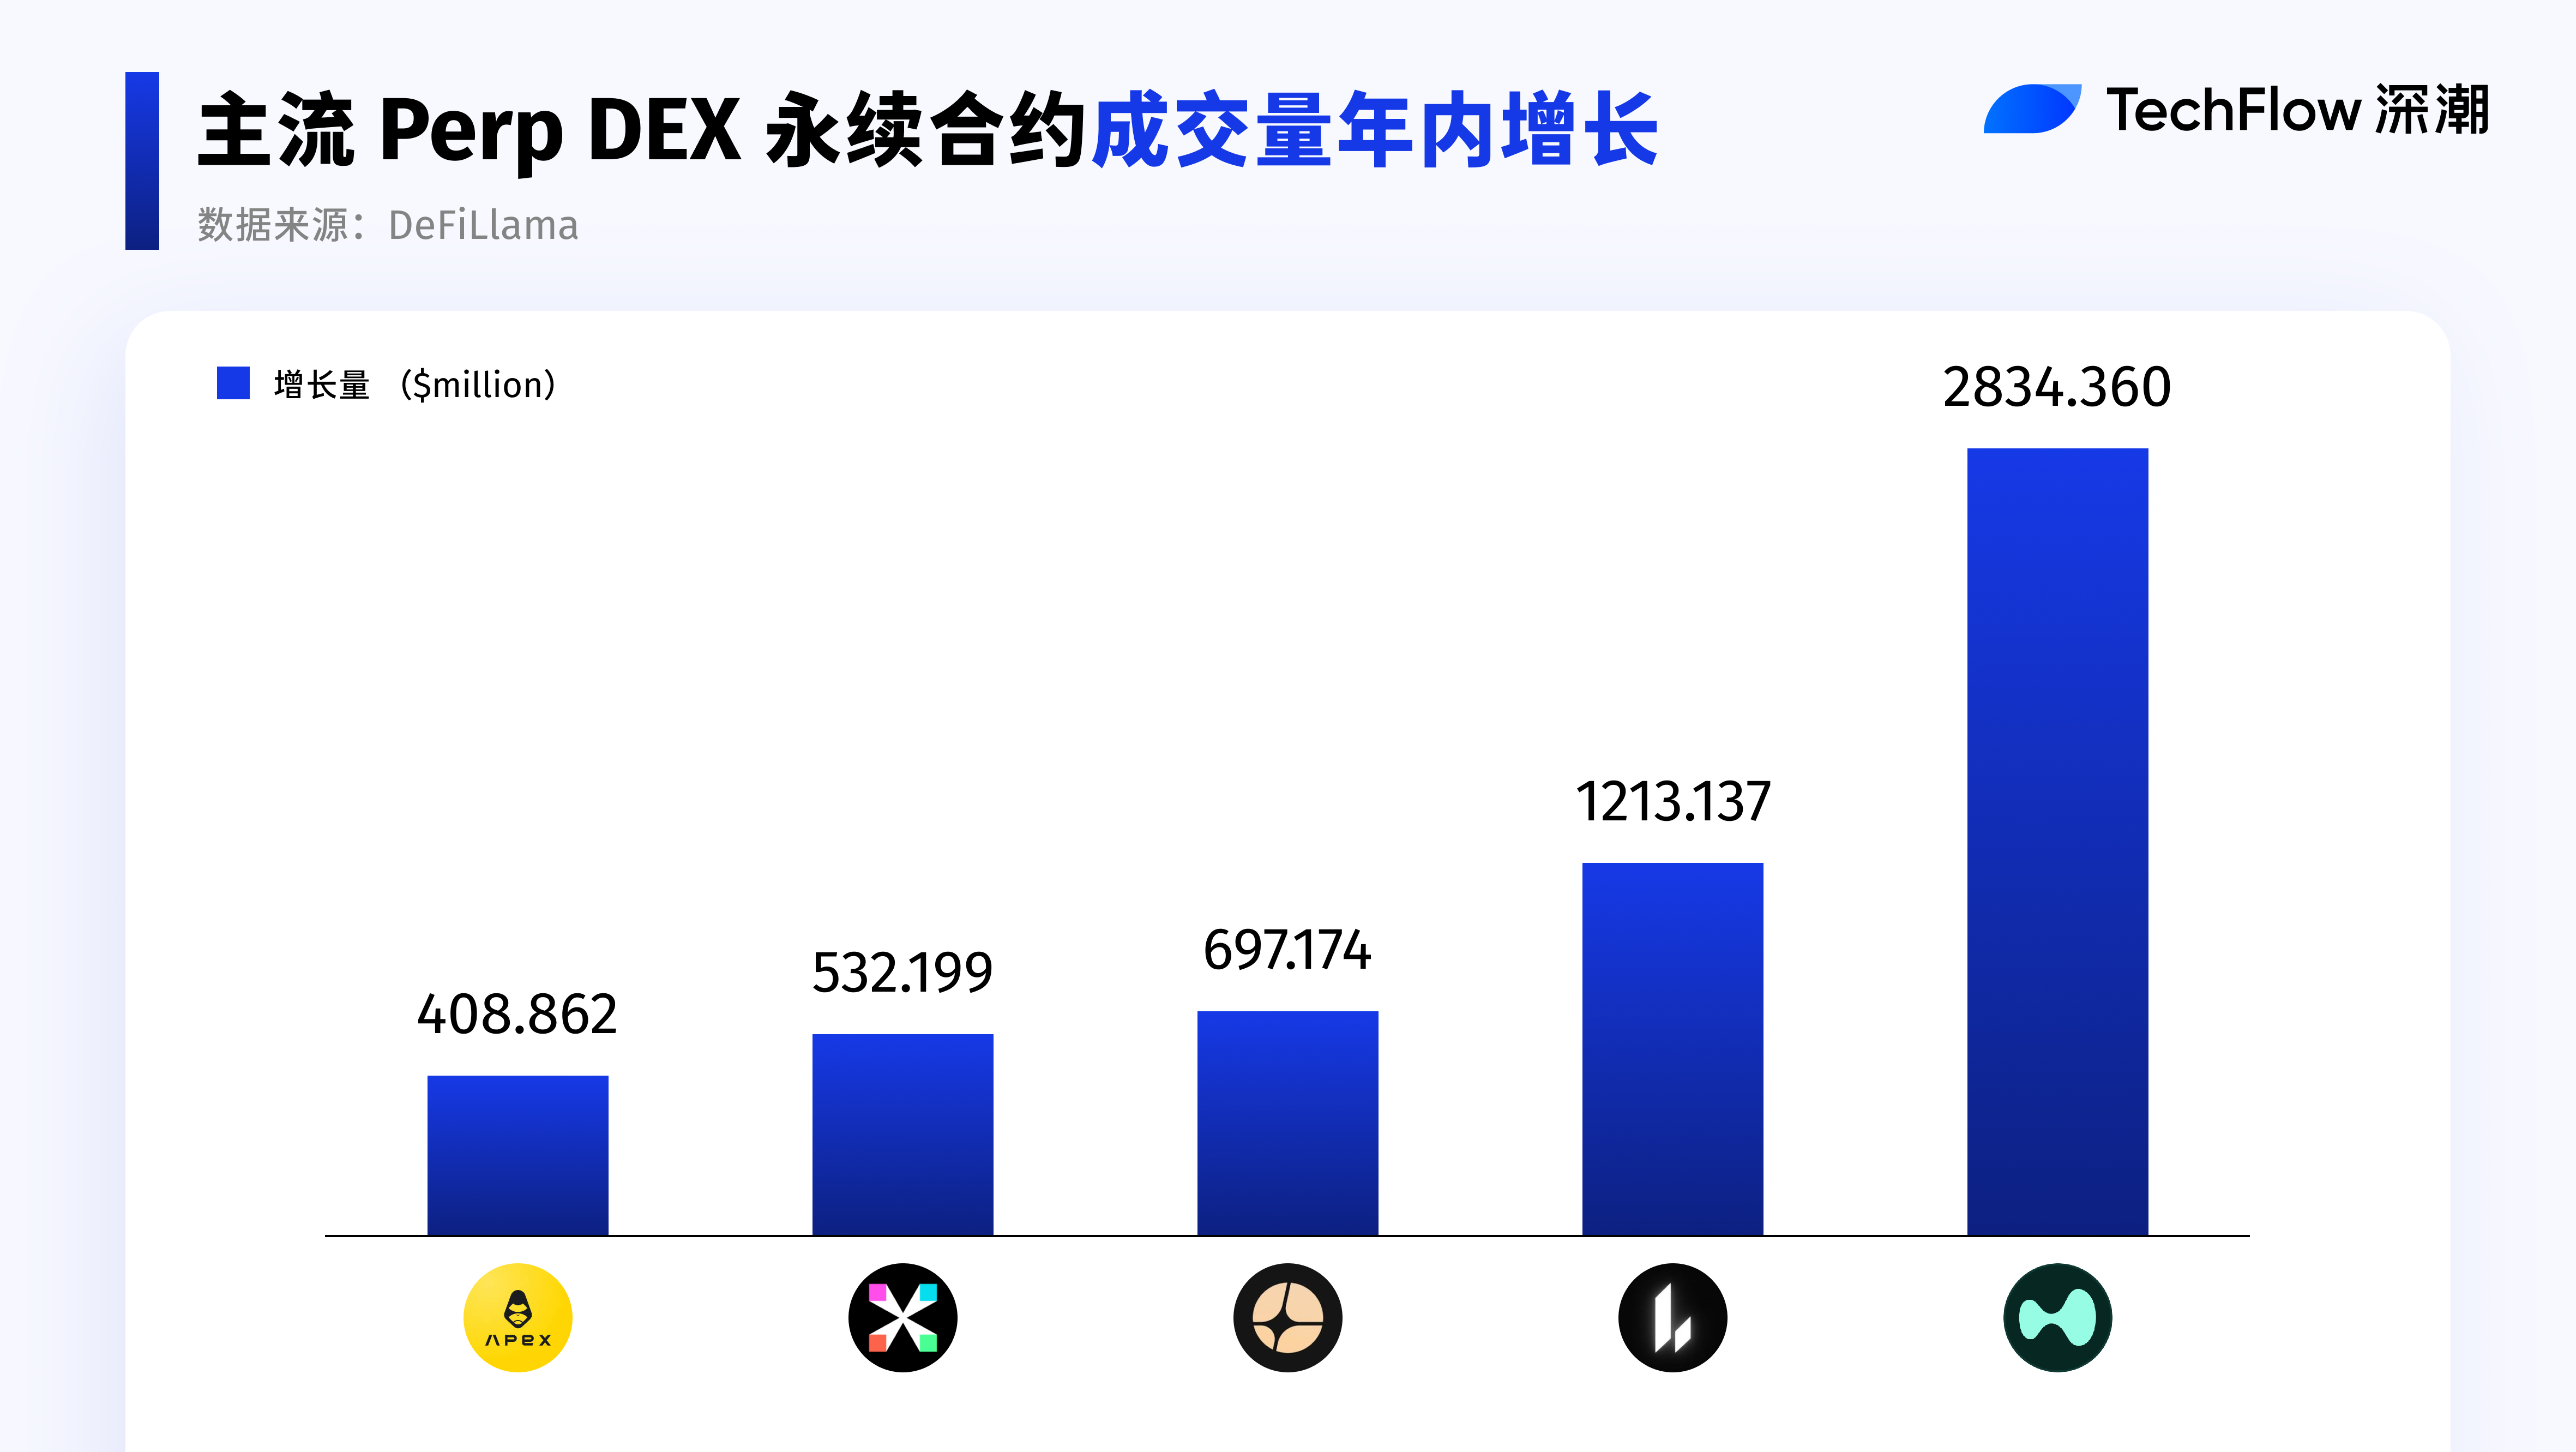
Perp Volume: Core Metric of Capital Turnover Intensity
Data source: DeFiLlama
The strength of Perp DEX lies in how fast capital can turn over.
From a metrics perspective, Perp Volume (perpetual contract trading volume) is a key indicator for measuring Perp DEX performance.
It reflects the intensity and frequency of capital turnover.
Looking at annual incremental Perp Volume:
- Hyperliquid and Lighter have sustained rapid growth since 2025, with both trading activity and capital turnover efficiency expanding.
- Aster caught up strongly after Q3, becoming one of the fastest-growing platforms of the year.
- In contrast, established players dYdX and GMX did not rank among the top in annual incremental volume. Despite their substantial historical cumulative volumes, their new trading volume in 2025 remained below $100M, indicating noticeably slower growth momentum.
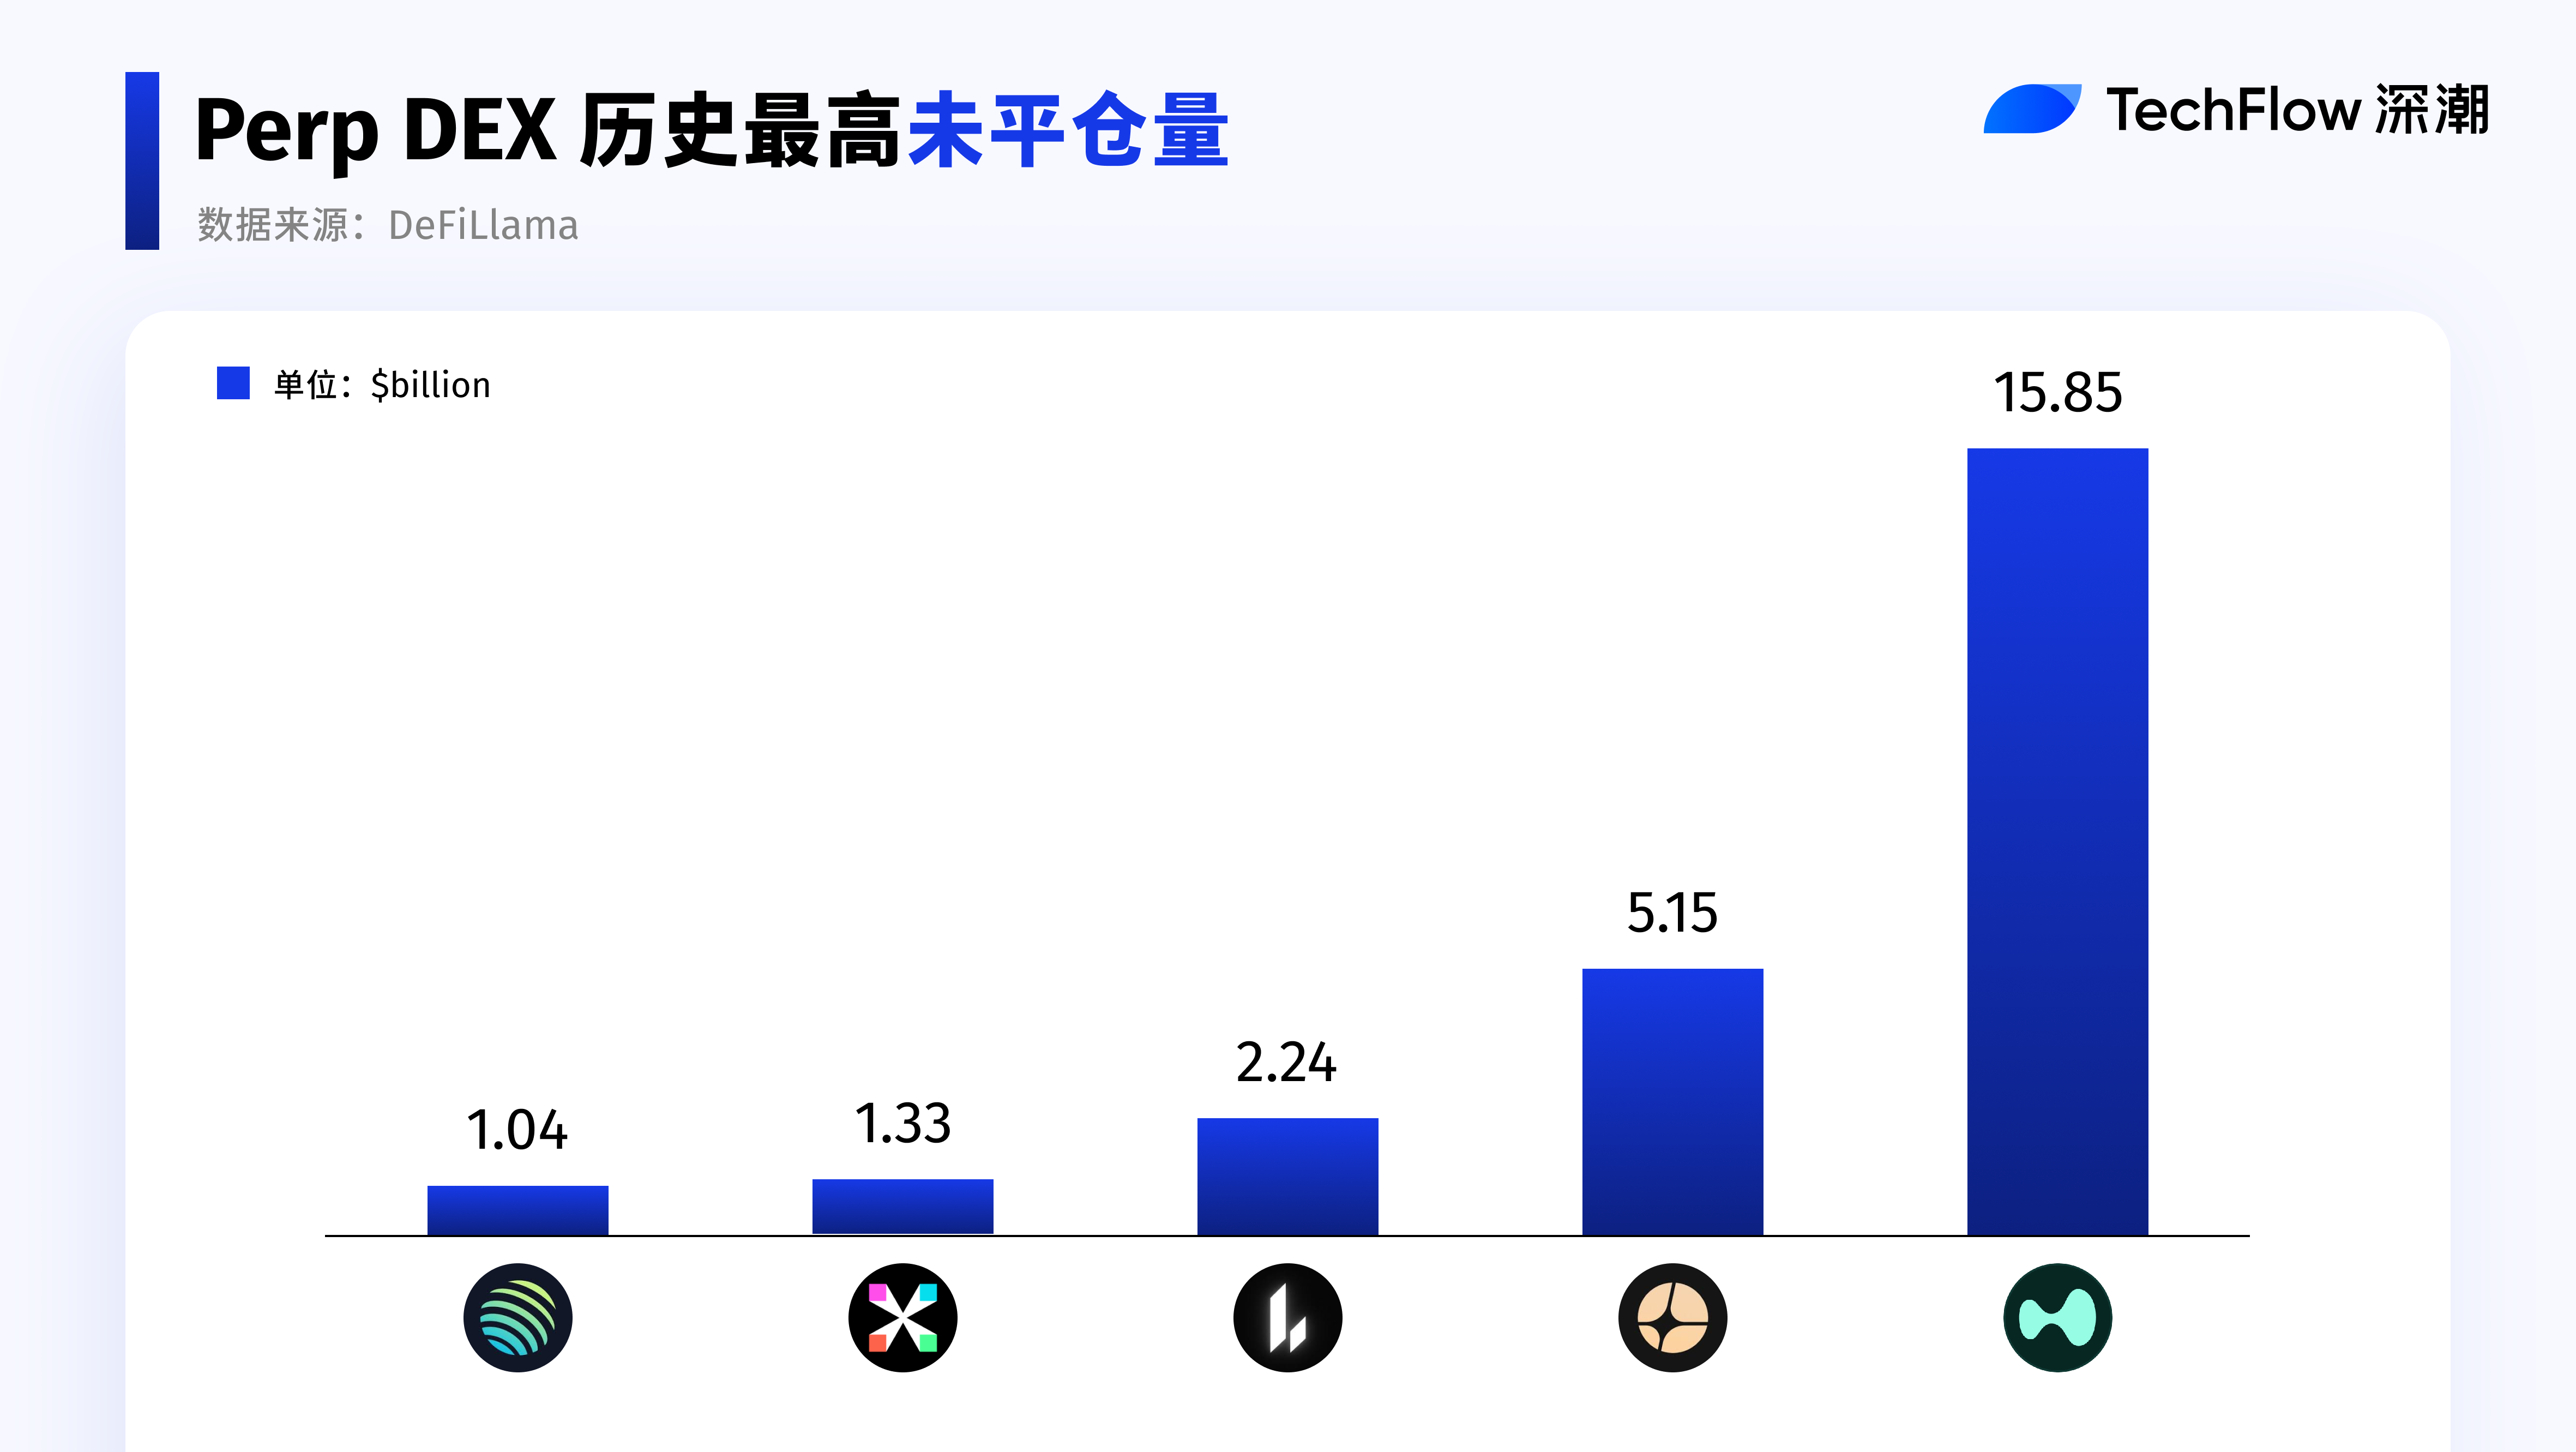
Open Interest: Risk Exposure and Centralization at the Top
For Perp DEX, Open Interest (OI)—the total notional value of open contracts—is an indispensable core metric.
In simple terms: If Perp Volume is traffic, OI is存量 (stock).
Perp Volume reflects trading activity, while OI indirectly shows whether funds are willing to keep positions on a platform.
As a derivative product, perpetual contracts reflect liquidity and matching activity through trading volume—but the actual amount of capital staying in the system depends on OI.
From the protocol side, OI indicates the ability to bear risk and manage capital scale.
From the user side, it reflects trading demand and capital stickiness.
Therefore, beyond sufficient liquidity and trading activity reflected in Perp Volume, we further filter for protocols with outstanding OI performance—the top five.
Data source: DeFiLlama
OI concentration is extremely high. The top five protocols absorbed the vast majority of open interest, with a clear gap behind. The sixth-ranked protocol’s OI is only about one-third of the fifth, highlighting a sharp divide. Given that Perp DEX funds are highly sensitive to depth, stability, and liquidation mechanisms, positions tend to concentrate on a few mature platforms.
Post-October 11: Differences in Recovery Performance Across Perp DEX
When trading heat fades and risks are released, differentiation among Perp DEX no longer lies in trading volume, but in fund retention and resilience in recovering from ATH OI drawdowns.
Aster:
- After building momentum in Q3, it demonstrated the strongest fund retention capability.
After hitting its OI peak on October 5, even entering Q4, its OI remained above 72% of its all-time high. Following the October 11 event, its ecosystem recovery pace led the pack, showing the most robust rebound.
Lighter:
- Also showed fast recovery, with current OI restored to about 87% of its ATH, indicating clear capital return.
Hyperliquid:
- Despite still having the largest overall scale, its OI once dropped over 60% from ATH. To date, OI remains unrecovered, reaching only about 61% of pre-October 11 average levels, signaling a notable weakening in performance.
Perp Revenue Performance: Growth Differences Among Protocols with Different Positions
Given that these protocols attract so much capital, the key question arises: Are they actually profitable?
This brings us back to protocol revenue.
Below, we analyze representative Perp DEX protocols based on their revenue performance and trends during the 2025 cycle.
We selected four types of protocols with different positioning for comparative analysis:
- Hyperliquid: Leading specialized Perp DEX
- Jupiter: Multi-service platform offering Perp DEX as one business line
- edgeX: Emerging specialized competitor
- GMX: Veteran Perp DEX protocol
Before analyzing, let’s categorize the protocols:
First, by product focus:
- Specialized Perp DEX
- Multi-service platform (Perp DEX as one of several offerings)
Second, by lifecycle stage:
- New entrant
- Growing/mature protocol
- Veteran protocol
The goal of this classification is to answer one question:
Under different positioning and stages, which protocol shows the strongest revenue growth momentum?
It's important to note that looking solely at absolute revenue growth doesn’t fully capture the true dynamics of 2025. Therefore, we use December 2024 as the base period and examine month-over-month revenue growth to better highlight differences in growth speed.
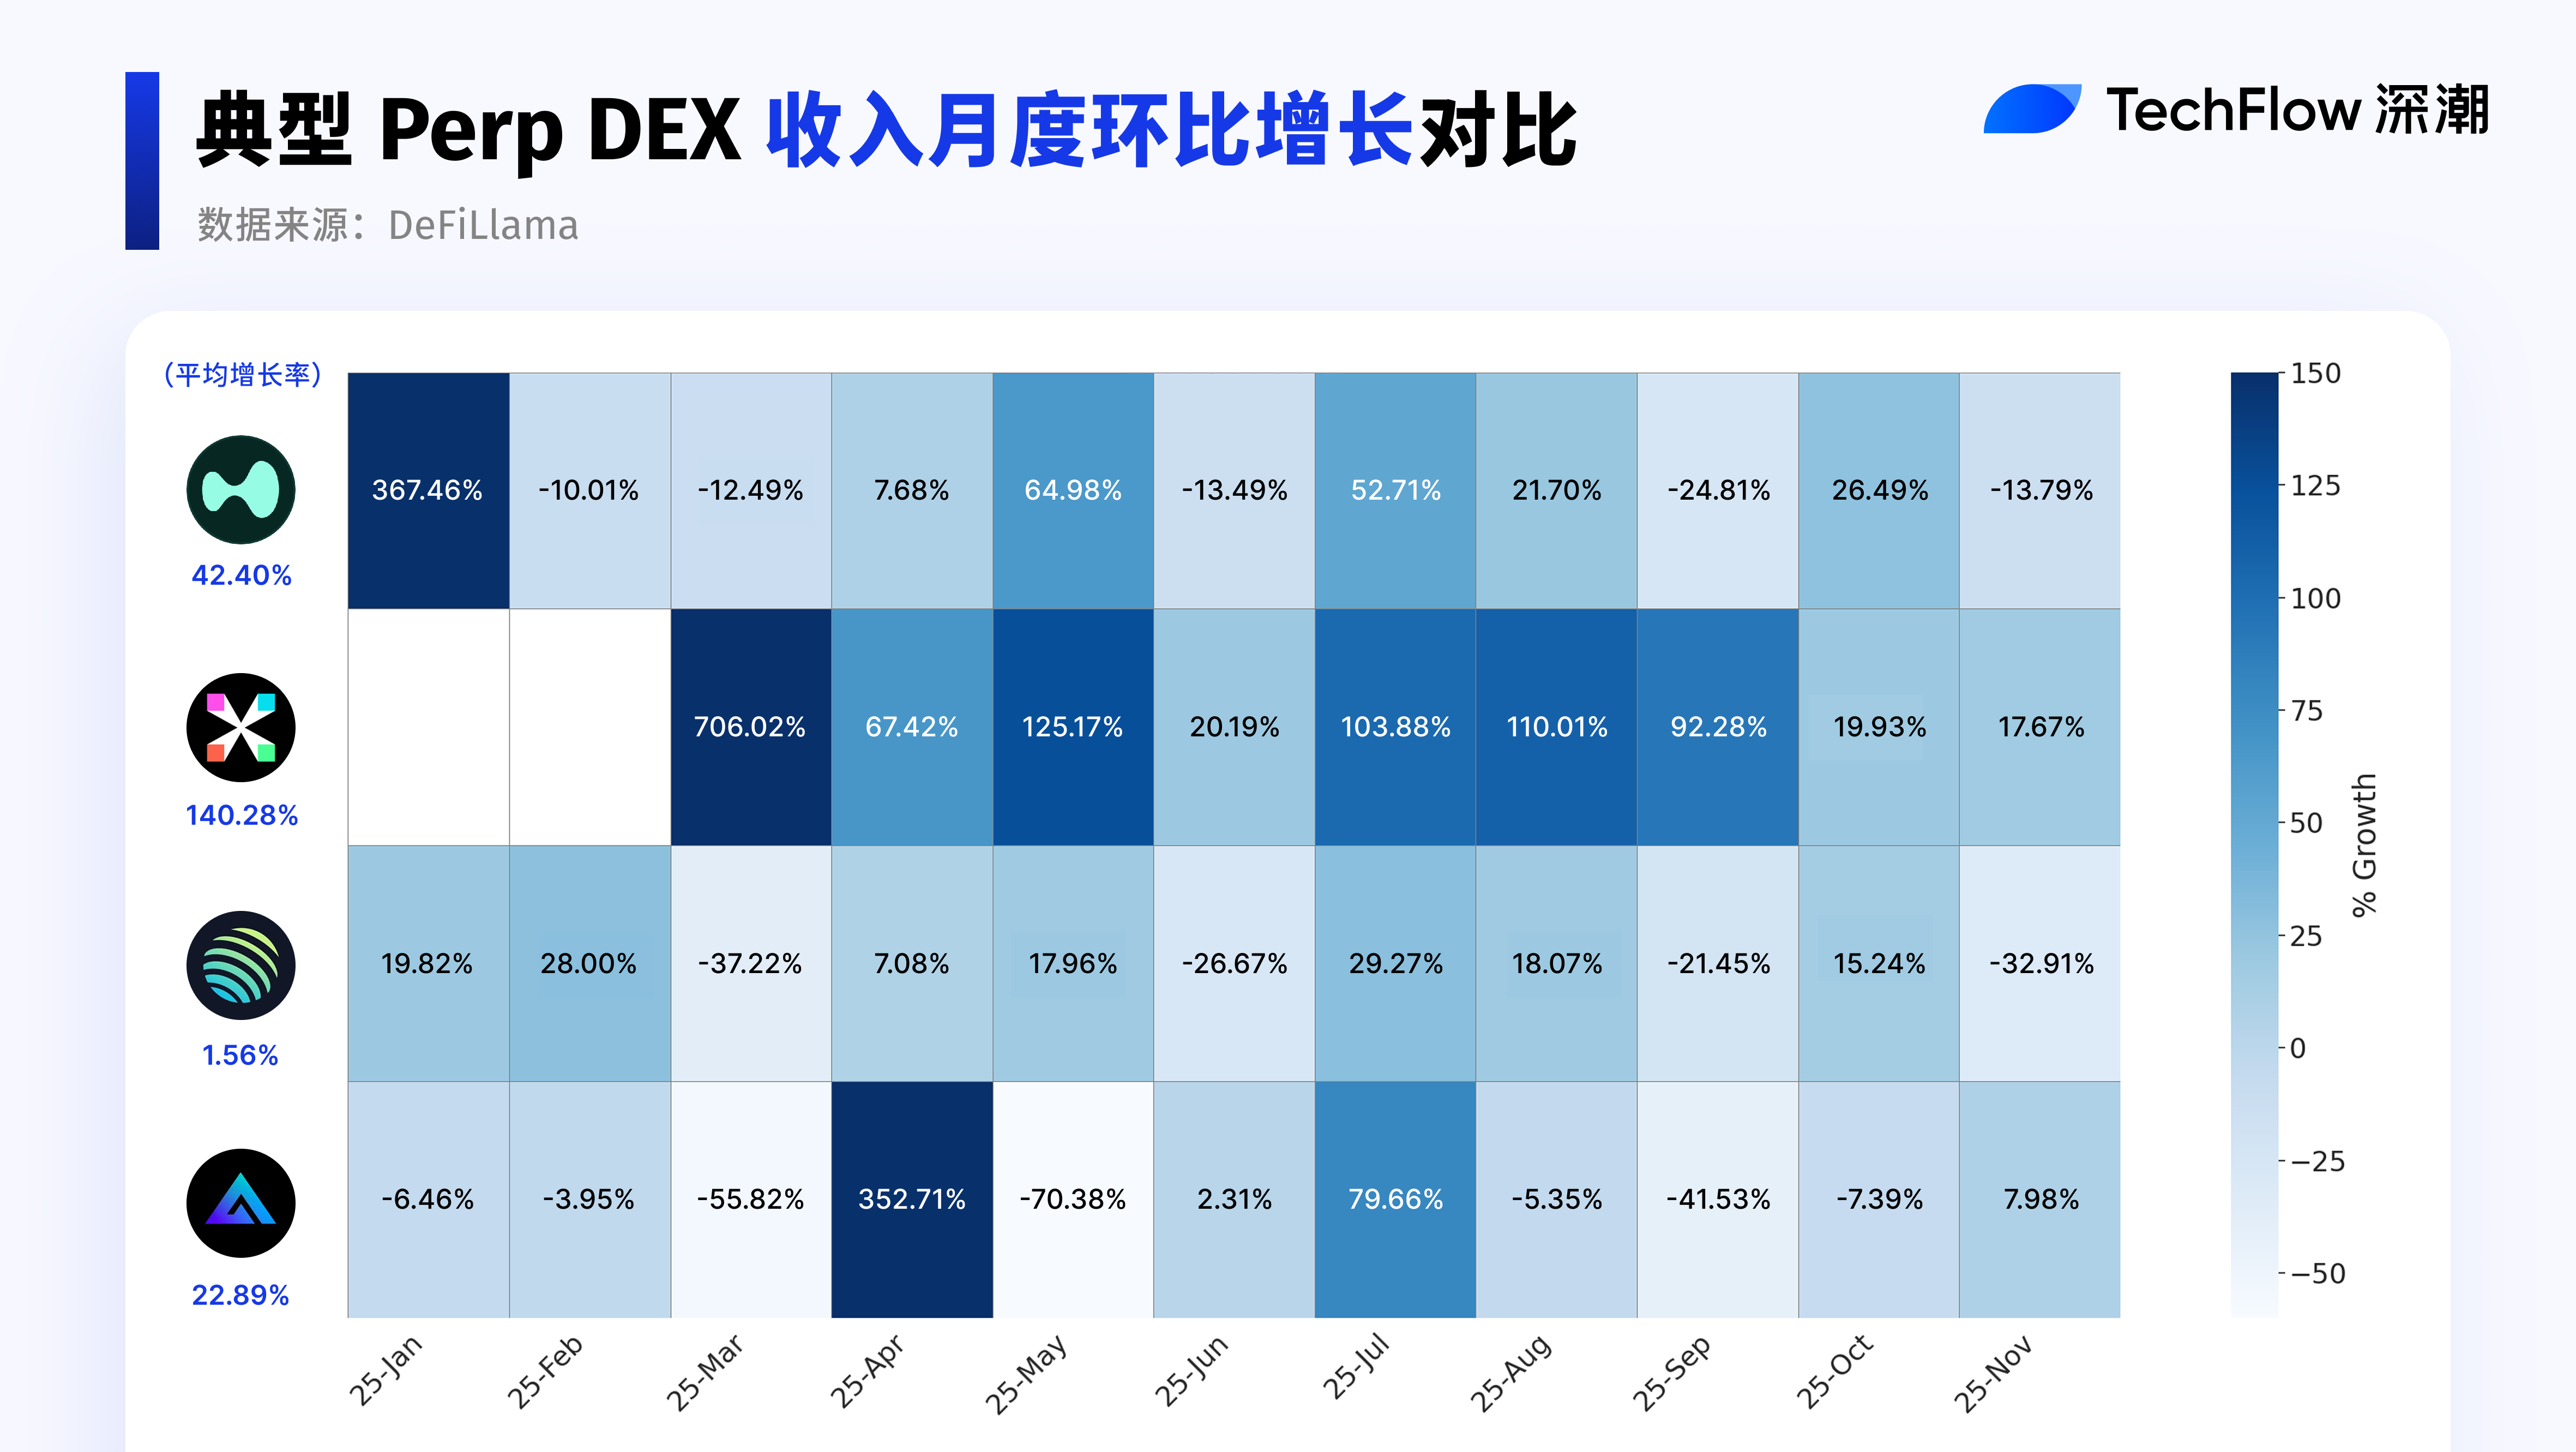
Data source: DeFiLlama
The heatmap clearly shows July as a pivotal month when multiple protocols experienced simultaneous revenue acceleration.
- edgeX stood out with the highest growth throughout 2025. Although its revenue growth slowed after September, its annual average growth rate remained among the highest. As a successful startup in the Perp DEX space, its revenue performance was impressive.
- Hyperliquid, now in its growth phase, showed stable expansion on a high base, maintaining strong revenue levels, though marginal growth has flattened.
- Jupiter, serving more as a transaction gateway and routing layer, often settles trades on underlying protocols, sharing fees with execution layers. Its revenue growth lagged behind trading volume expansion, remaining relatively stable.
- GMX had an average revenue growth rate of about 22%. As a veteran protocol, growth mainly came from user retention. If it can sustain this pace on its existing base, its business model remains viable long-term.
Spot DEX: Liquidity Depth and Ecosystem Competition
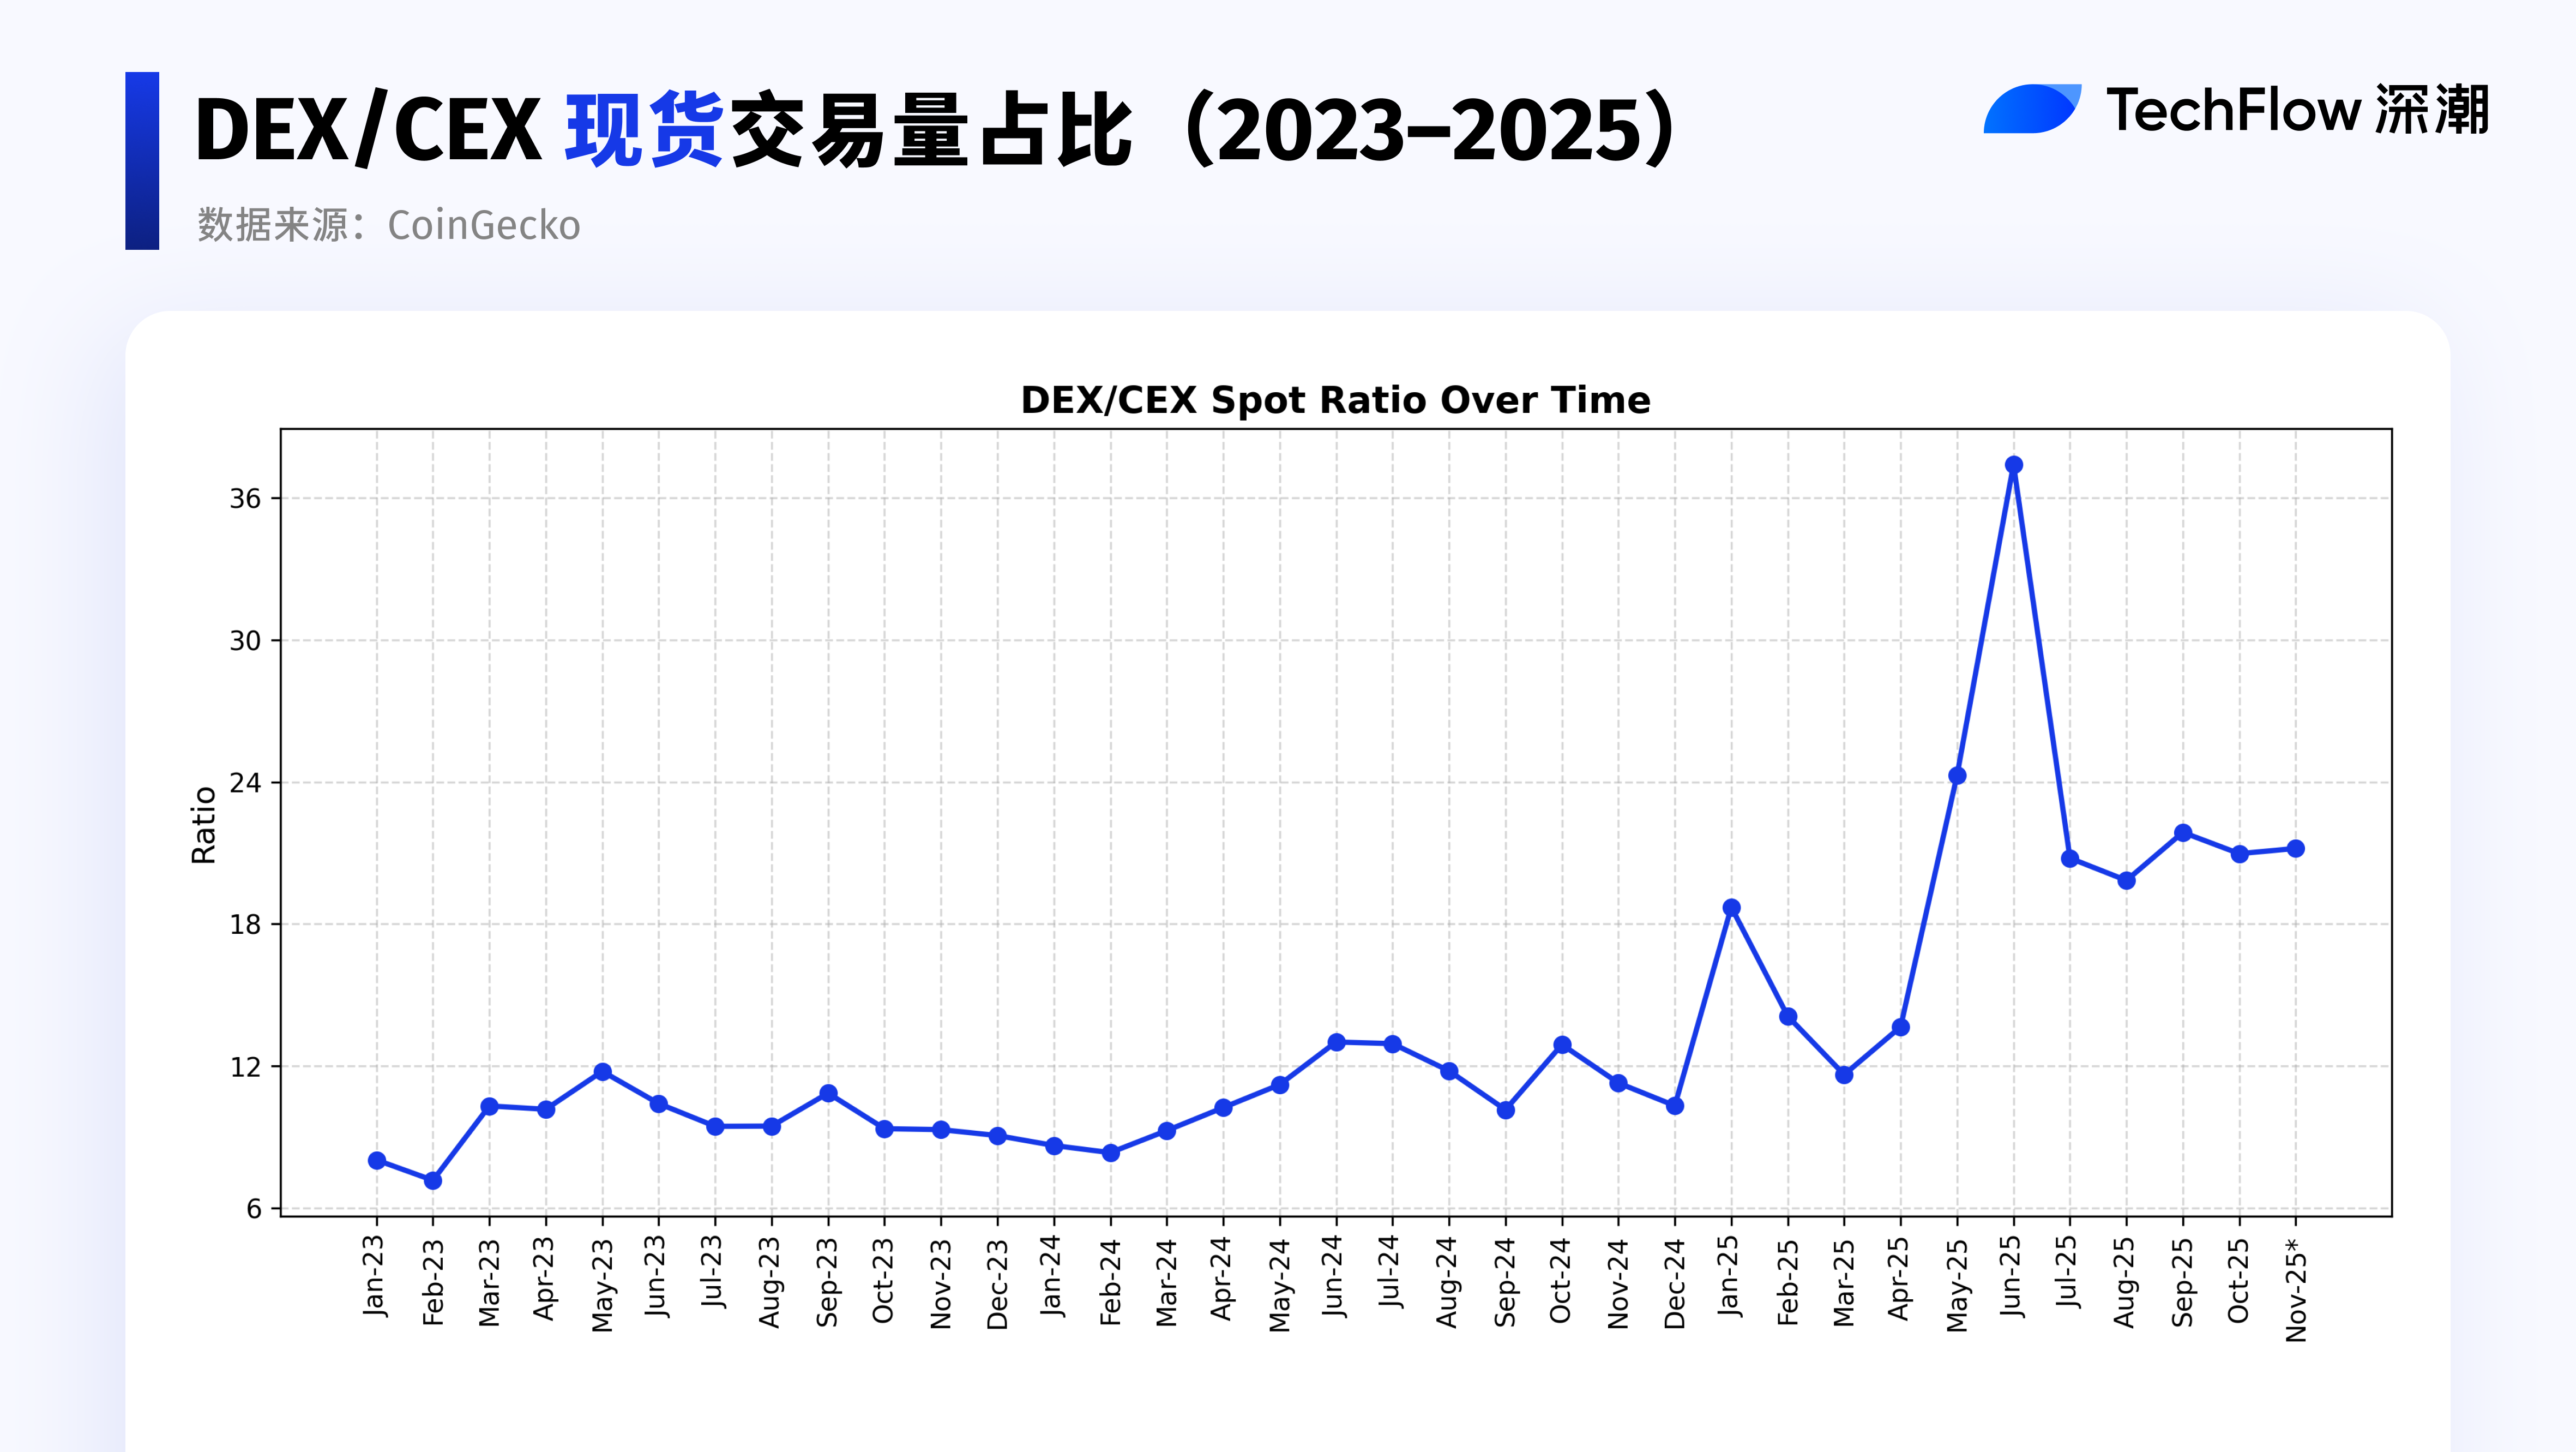
Data source: CoinGecko
Compared to the previous two years, the DEX/CEX ratio in spot trading volume also rose notably in 2025, peaking in June and rebounding again in Q4.
TVL: Spot Liquidity Depth and Capital Commitment
In the Spot DEX ecosystem, TVL primarily comes from assets provided by liquidity providers (LPs) to trading pools. A higher TVL indicates greater willingness of capital to accept impermanent loss and smart contract risks in exchange for fee or incentive rewards. TVL better reflects capital’s judgment on the rules, risk structures, and long-term sustainability of Spot DEXs, making it a core reference metric.
Data source: Token Terminal
In terms of TVL, Uniswap remains firmly in first place with ~$7.3B, maintaining a clear liquidity advantage in spot DEX and continuing to serve as Ethereum’s core trading hub.
Fluid and PancakeSwap form the second tier, both exceeding $2B in TVL, benefiting respectively from cross-ecosystem expansion and rising BSC trading activity, with strong growth momentum in 2025.
Curve and Raydium sit in the mid-tier: Curve focuses on stablecoins and low-volatility assets, with stable but conservative growth; Raydium is deeply tied to the Solana ecosystem, reflecting liquidity changes within a single chain.
Among the top 10 protocols by average annual TVL in 2025, Fluid saw the most significant growth, reaching ~$5B in Q3. PancakeSwap also expanded notably during the same period.
Trading Volume: The Rise of Solana-Based DEXs
Data source: DeFiLlama
Here we use annual trading volumeexcluding flash loans. Since flash loans can generate large nominal volumes with minimal instantaneous exposure, excluding them provides a more accurate reflection of genuine trading demand.
In terms of market share, Uniswap and PancakeSwap remain overwhelmingly dominant, together accounting for over half—indicating that liquidity in mainstream spot DEXs remains highly concentrated among a few top protocols.
Notably, the combined share of Solana-based DEXs is now approaching the volume of Uniswap alone, signaling a significant rise in Solana’s competitiveness in spot DEX trading—though internally, it remains fragmented across multiple protocols.
Clues Behind P/F Fluctuations: Key Events in Spot DEX in 2025
Given the scale of these platforms, do Spot DEXs—critical components of DeFi—actually make money? Let’s look at the data.
Since this article focuses on 2025 performance, we examine only recent changes. Also, many protocols introduced token buybacks, burns, fee distribution adjustments, and structural reforms in 2025, reducing the explanatory power of FDV.
Thus, we use the P/F ratio (market cap to fees) to measure how much valuation the market assigns per unit of fees generated.
P/F does not directly reflect profitability but captures market expectations for a Spot DEX’s potential monetization capacity given its current economic activity.
Data source: Token Terminal
To avoid distortion from larger protocols, Curve is excluded from the chart (used only for background analysis). PumpSwap and Hyperliquid Spot are also omitted due to unclear attribution of token-level value capture.
Curve’s P/F remained relatively high throughout the year, peaking around 28 in May, then declining steadily to ~7 by year-end—slightly below its starting level of ~10.
It’s worth noting that Curve’s P/F is significantly higher than others, primarily due to its persistently extremely low fees. Curve’s pricing curve is specifically optimized for stablecoins and low-volatility assets (e.g., stablecoin swaps, stETH/ETH), enabling minimal slippage and high capital efficiency via advanced AMM design.
Additionally, Curve’s 2025 launch of the YieldBasis mechanism further focused on reducing LP impermanent loss and protecting liquidity provider returns.
For the protocols shown, we’ve compiled key events in 2025 that influenced their P/F ratios, helping to review a year full of innovation and dynamism in this sector.
So, back to the original question: Is DEX really replacing CEX?
Whether it’s the quantum leap in trading volume or the rising DEX/CEX ratio in 2025, one fact is clear: DEX has become an undeniable primary trading venue.
Especially in perpetual contracts, Perp DEX trading volume reached historic highs in 2025, with capital turnover efficiency and top platforms’ capacity bringing the market to a new scale.
But this doesn’t mean simple replacement. 2025 looks more like the starting point of a “two-way evolution”: On one hand, DEX is actively learning from CEX, closing gaps in matching efficiency, user experience, risk control, and product completeness. On the other, CEX is evolving toward DEX principles—emphasizing self-custody, on-chain transparency, and verifiable settlement and liquidation mechanisms.
In the end, the relationship between DEX and CEX may not be zero-sum. A more likely scenario is: both will leverage their strengths across different layers and use cases, jointly building the next-generation trading and clearing infrastructure for crypto finance.
Not replacement, but partnership; not confrontation, but co-construction.
In 2025, this trend has already drawn near. How far off can the day be when a new order truly takes shape?
Join TechFlow official community to stay tuned
Telegram:https://t.me/TechFlowDaily
X (Twitter):https://x.com/TechFlowPost
X (Twitter) EN:https://x.com/BlockFlow_News