Is global liquidity drying up?
TechFlow Selected TechFlow Selected
Is global liquidity drying up?
Just like how "currency depreciation trades" have gradually become mainstream?
Author: Michael Nadeau
Translation: Baihua Blockchain
The post-pandemic era has been defined by fiscal dominance—a economy driven by government deficits and short-term Treasury issuance, keeping liquidity elevated even as the Federal Reserve maintained high interest rates.
Today, we are entering a private-sector-led phase, where the Treasury is withdrawing liquidity through tariffs and spending constraints, in contrast to the previous administration.
This is why interest rates need to come down.
We analyze the current cycle through the lens of global liquidity to emphasize why this current round of the "debasement trade" has reached its final stage.
Is Fiscal Dominance Ending?
We always aim to buy low when everyone else is chasing higher prices.
This is why recent discussions around the "debasement trade" have caught our attention.
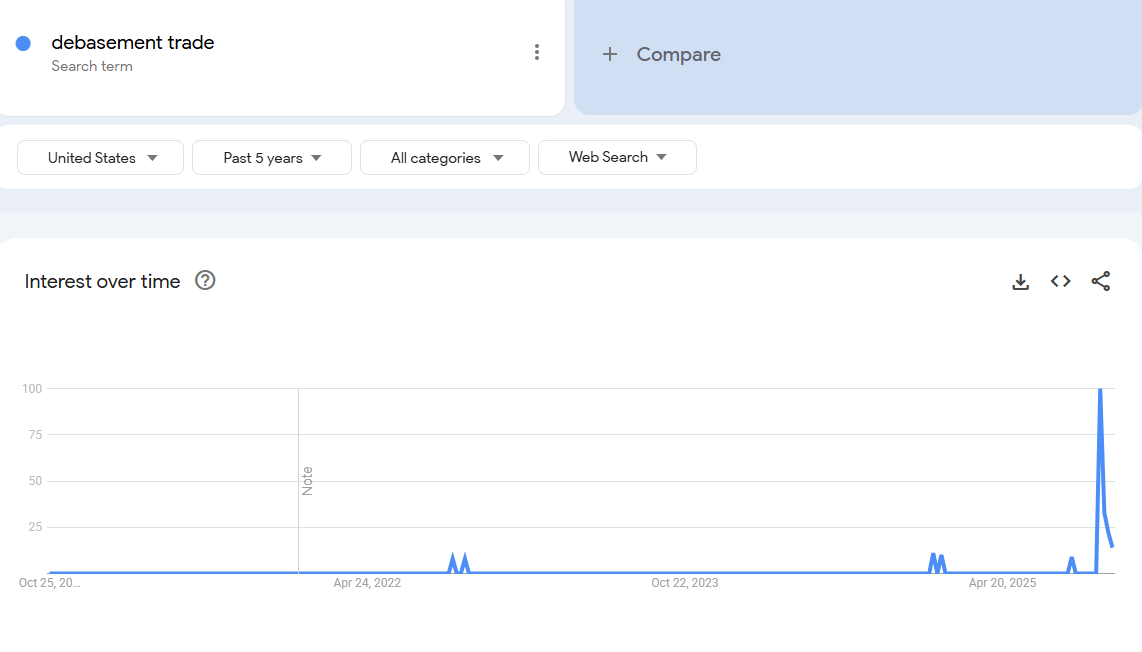
Data: Google Trends
In our view, the time to be interested in the "debasement trade" was years ago—when Bitcoin was at $25,000 and gold at $2,000. Back then, only crypto and macro analysts were talking about it.
To us, this "trade" has largely played out.
Therefore, our task is to understand the conditions that created it, and whether those conditions will persist.
What drove this trade? In our view, two main factors:
1. Treasury spending. During the Biden administration, we saw large-scale fiscal deficits.
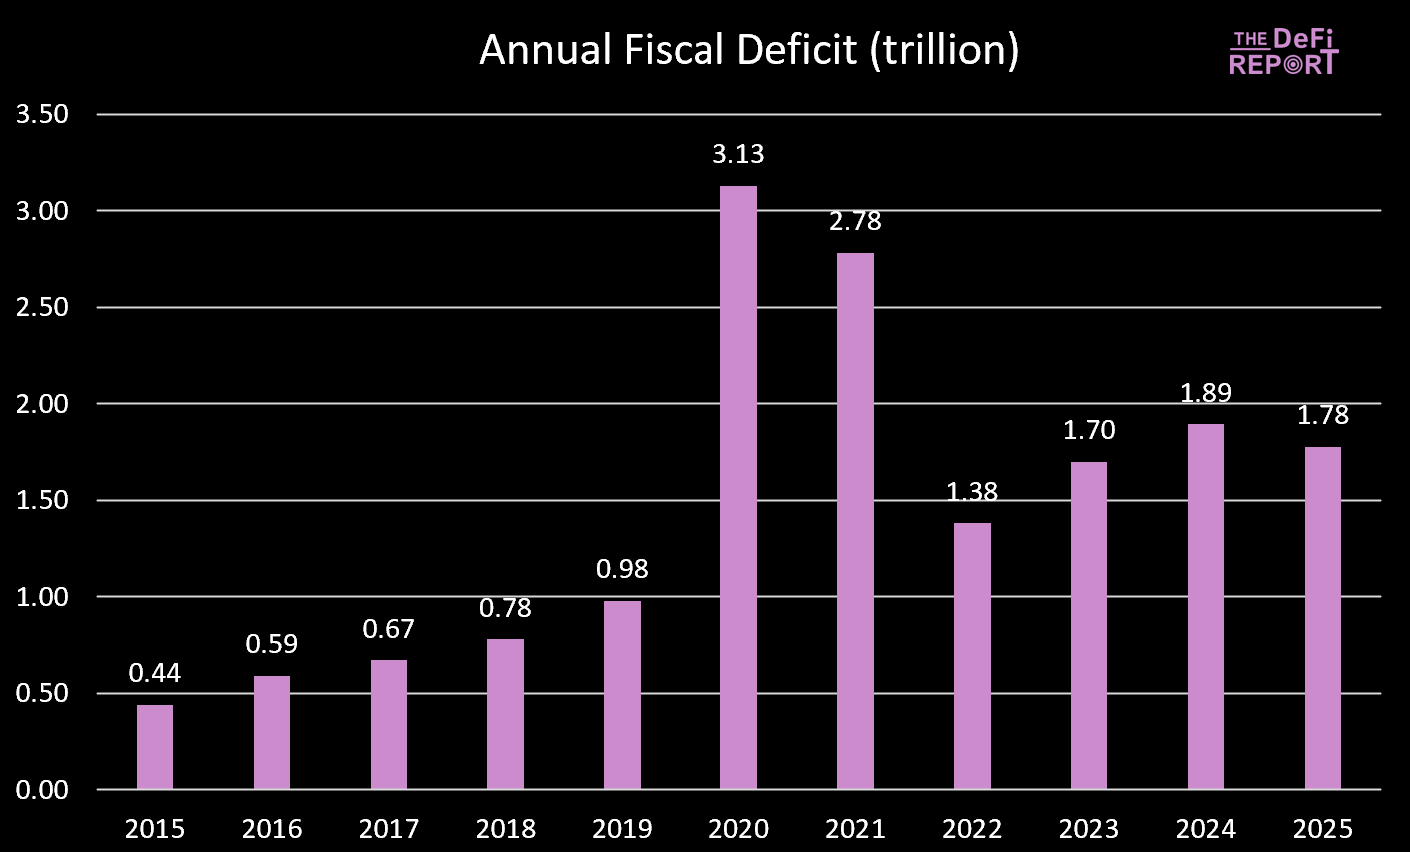
Data: US Treasury
Fiscal year 2025 has just ended with a slight decline in the deficit—mainly due to increased tax revenue (tariffs), not reduced spending. However, the "Big Beautiful Bill" is expected to achieve spending cuts by reducing Medicaid and SNAP benefits.
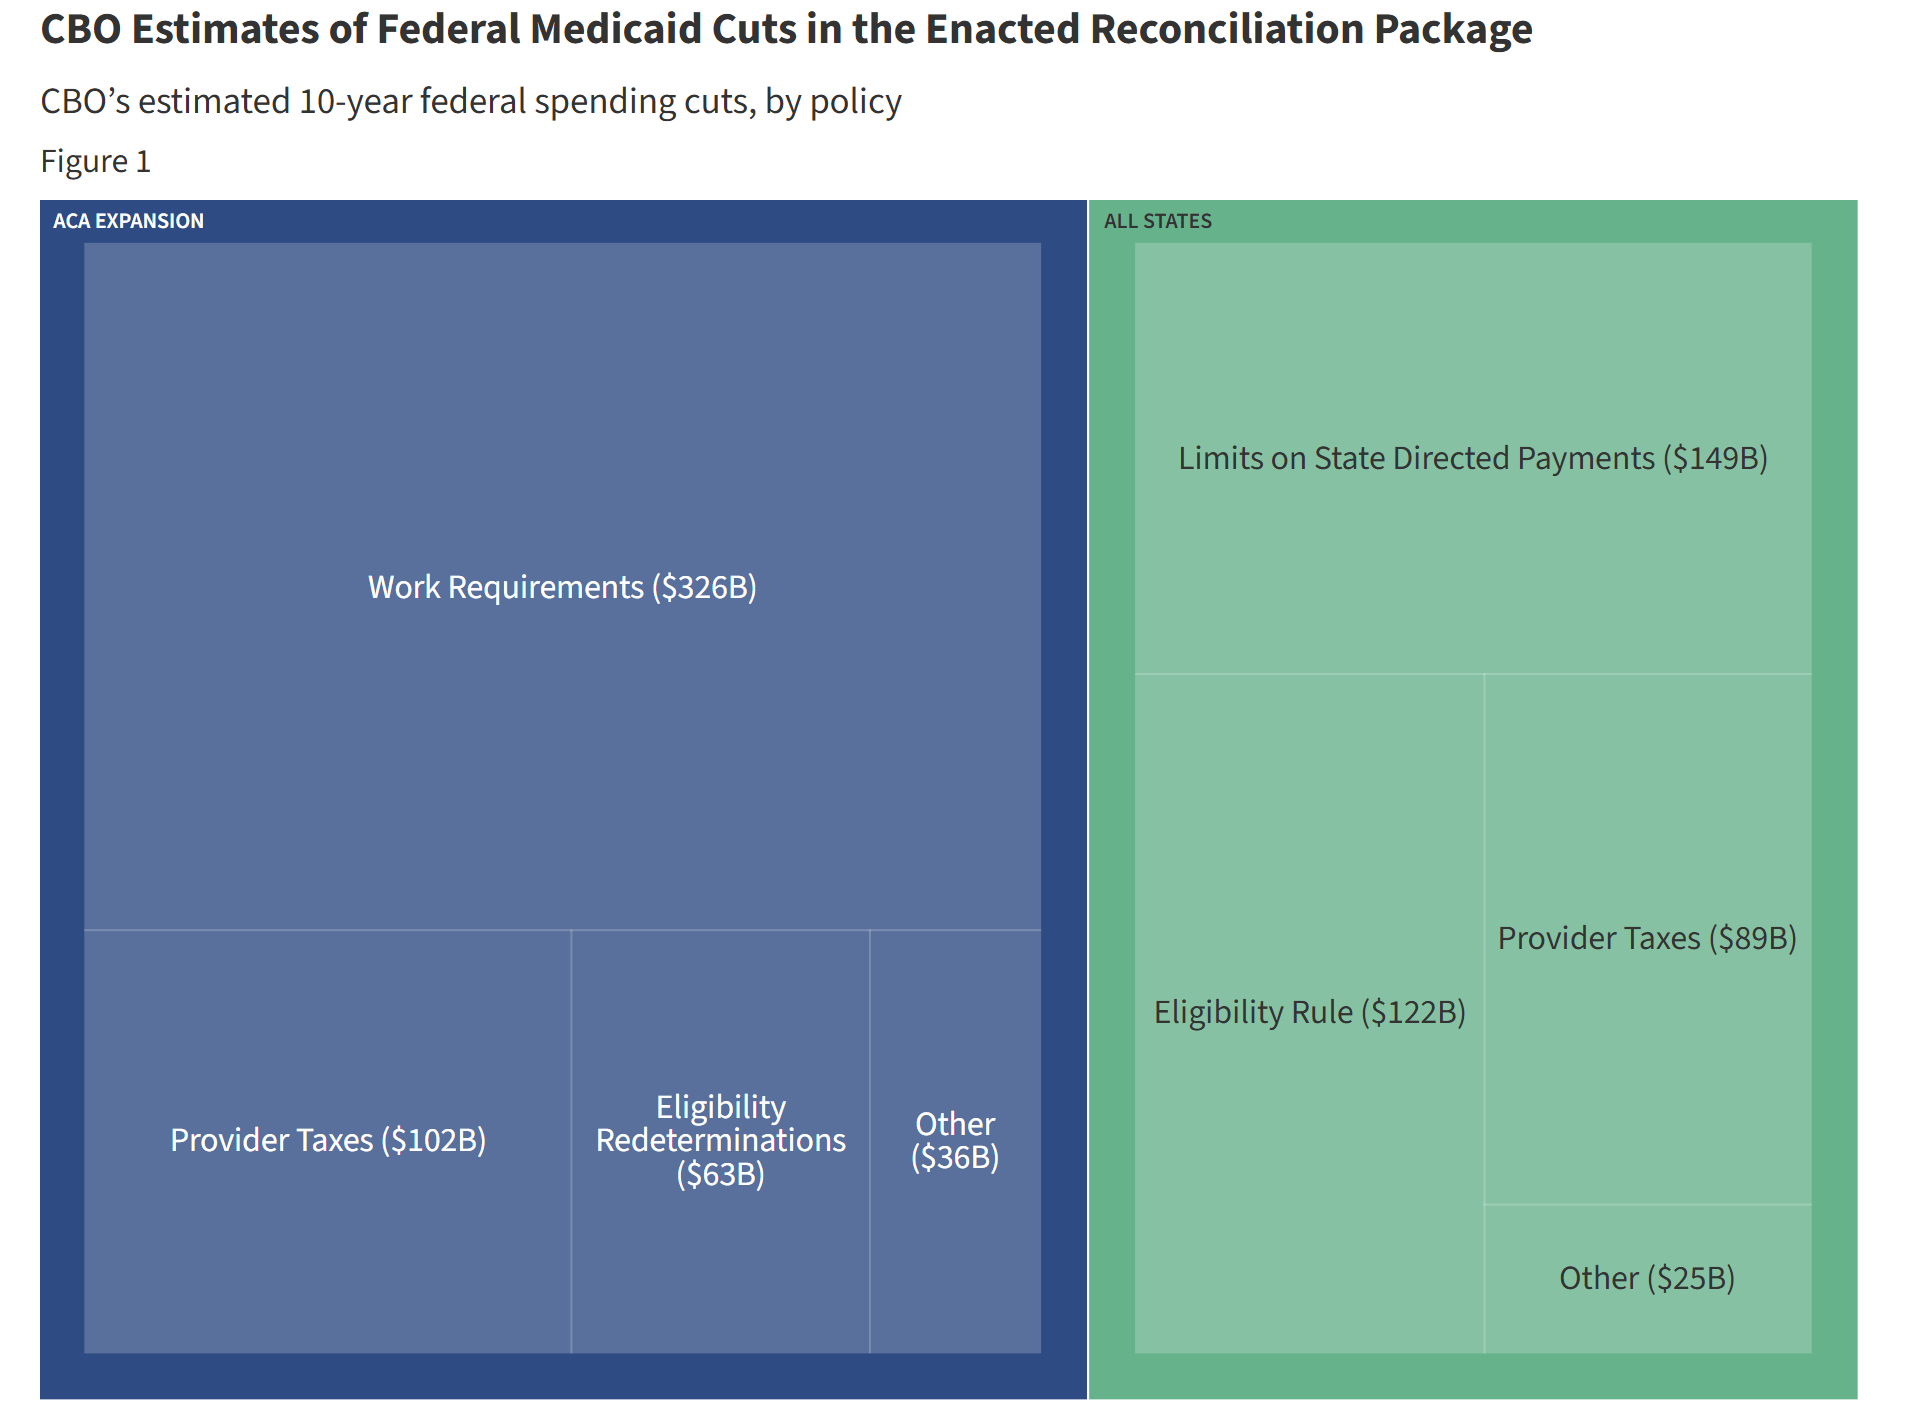 Data: KFF (Kaiser Family Foundation) Cuts vs. Current Spending Trajectory
During Biden's tenure, government spending and transfer payments continuously injected liquidity into the economy. But under the Big Beautiful Bill, spending growth slows.
This means less money being pushed into the economy by the government.
Moreover, the government is now pulling funds out of the economy via tariffs.
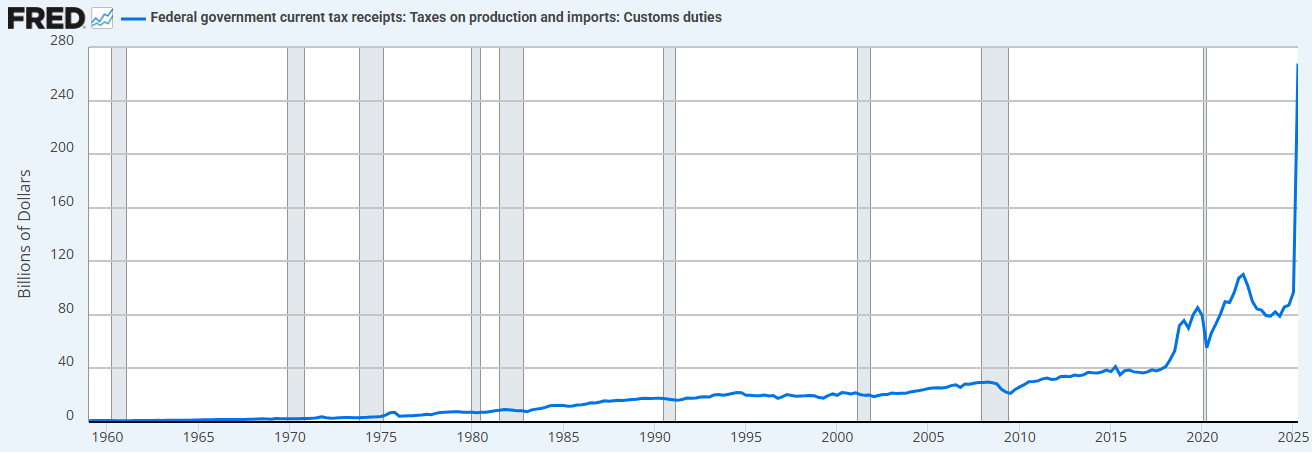
Data: FRED (Federal Reserve Economic Data)
The combination of spending restraint (relative to the prior administration) and increased tariffs means the Treasury is now absorbing liquidity rather than supplying it.
This is why we need lower interest rates.
"We will re-privatize the economy, revitalize the private sector, and shrink the size of government." – Scott Bessent
2. Treasury QE. To fund the excessive spending by the Treasury during the Biden administration, we also witnessed a new form of quantitative easing (QE). We can observe this below (black line). "Treasury QE" supported markets by funding government spending through short-term bills instead of long-term bonds.
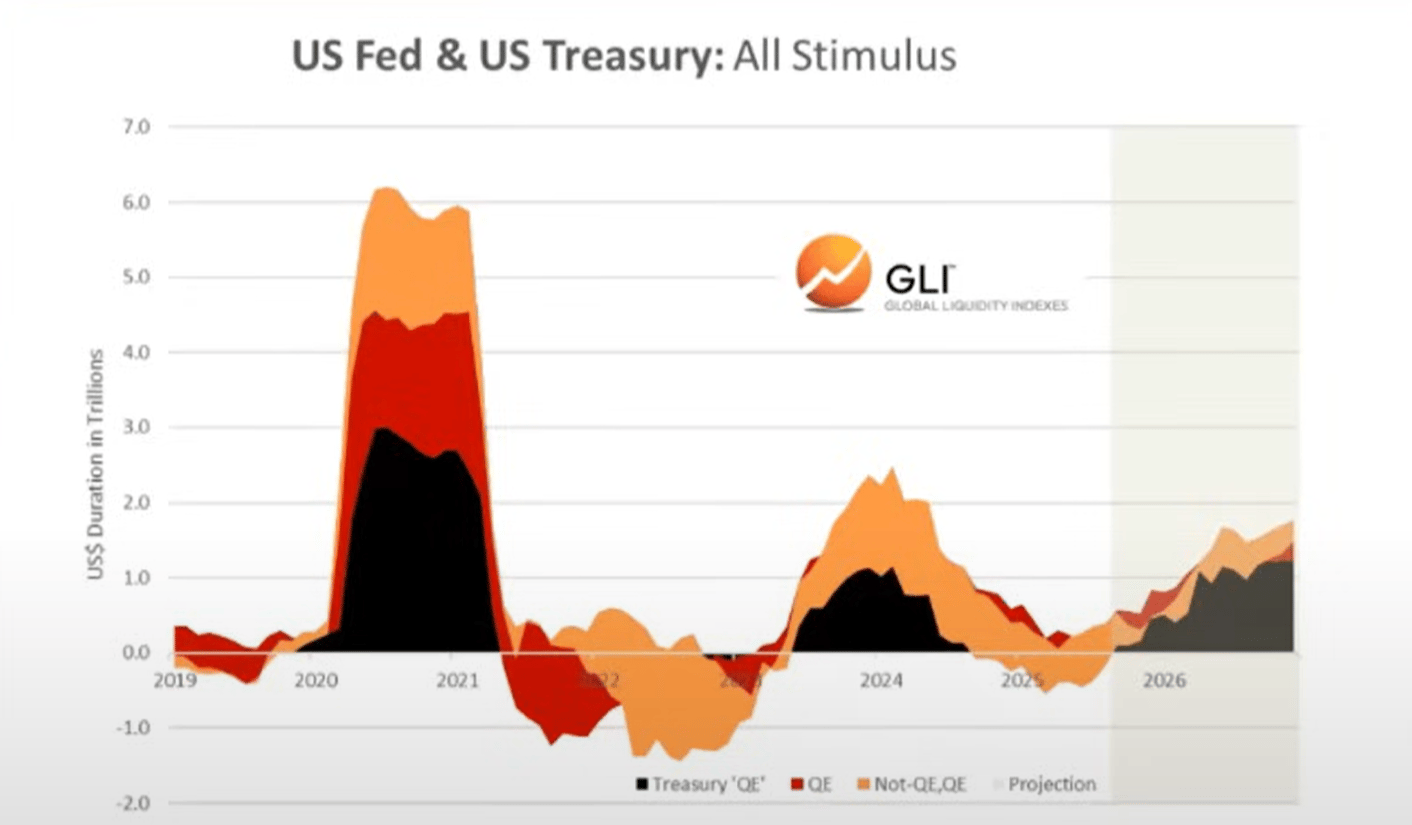
Data: Global Liquidity Index
We believe it was precisely fiscal spending and Treasury QE that drove the "debasement trade" and the "everything bubble" we've seen over the past few years.
But now we are transitioning into "Trump economics," where the private sector takes over from the Treasury.
Again, this is why they need lower interest rates—to kickstart the private sector through bank lending.
As we enter this transition period, the global liquidity cycle appears to be peaking...
Global Liquidity Cycle Peaking and Turning Down
Current Cycle vs. Average Cycle
Below, we can observe the current cycle (red line) compared to the historical average cycle since 1970 (gray line).
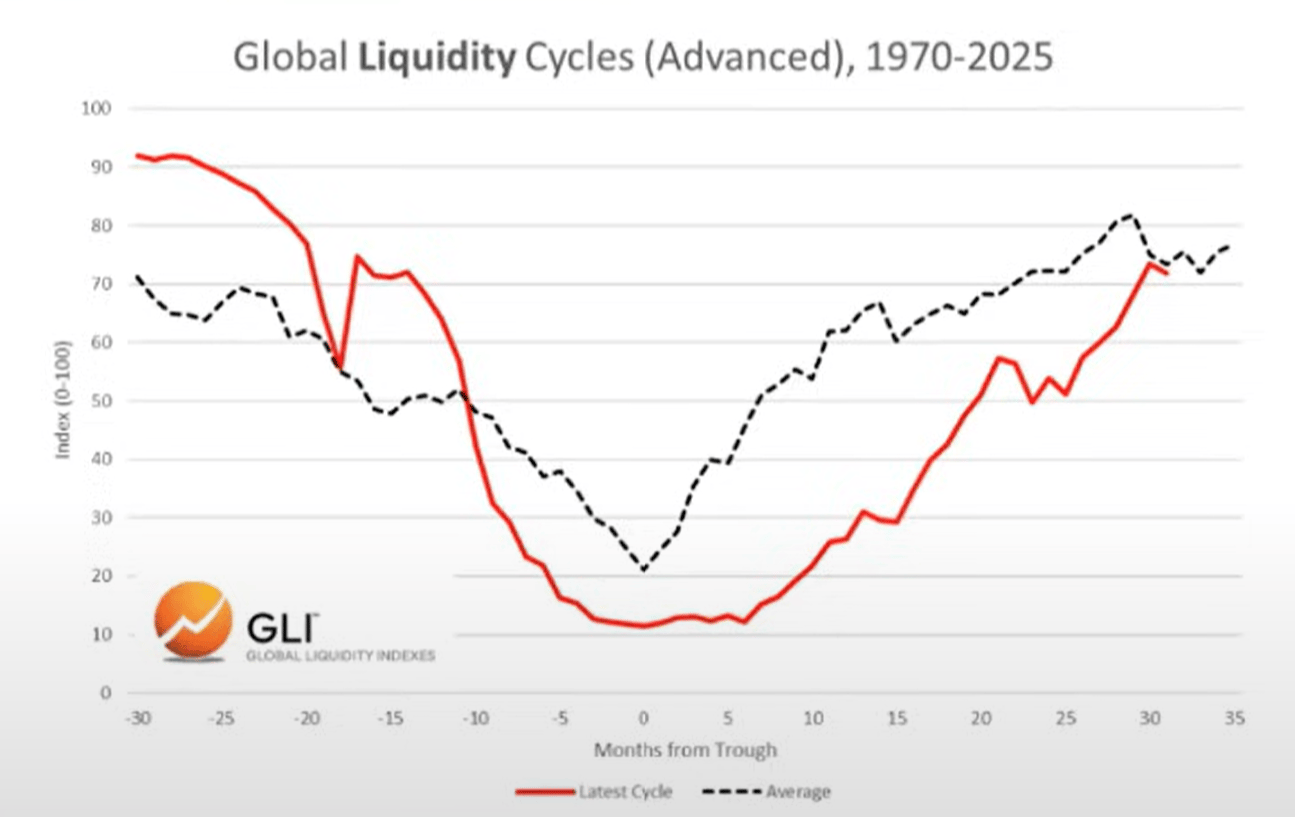
Data: Global Liquidity Index
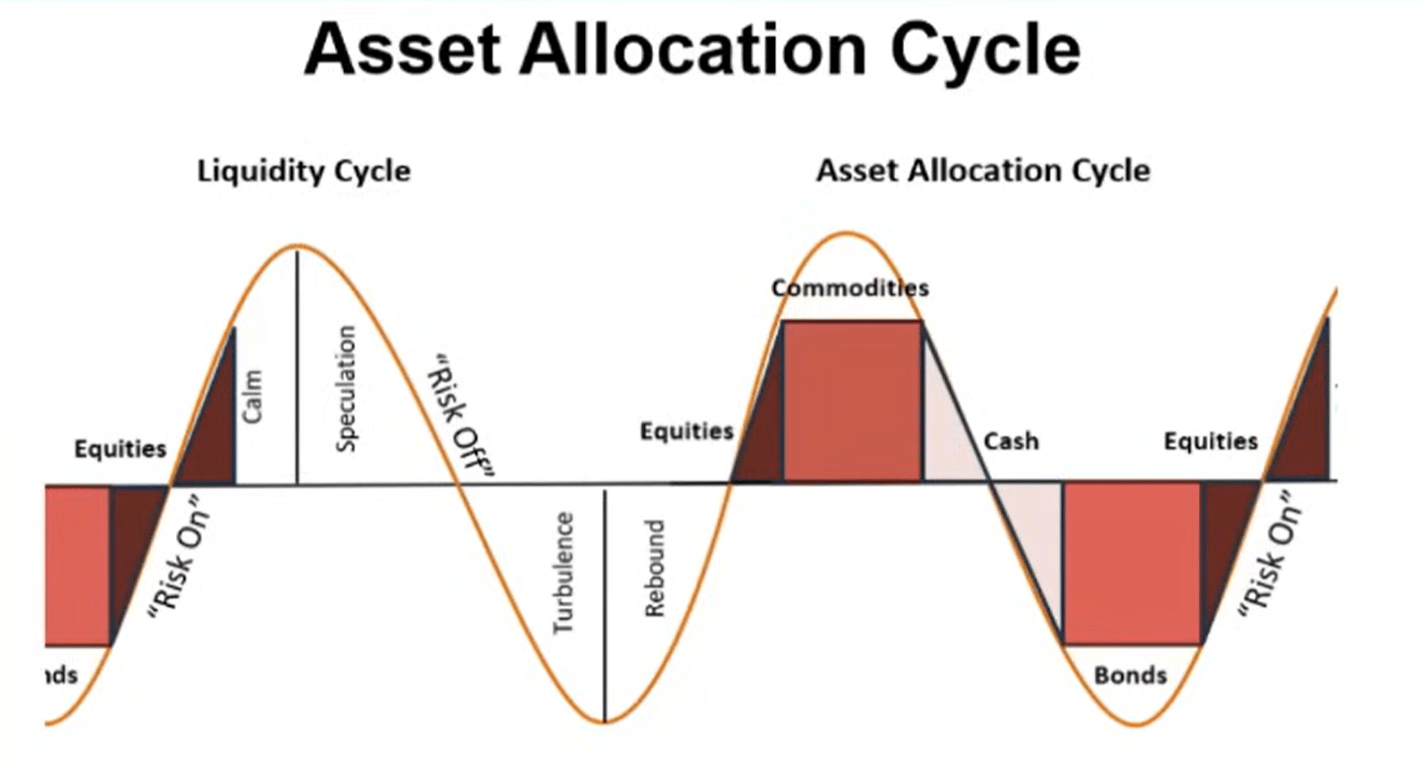
Asset Allocation
Based on Mr. Howell's work on the Global Liquidity Index, we can observe a typical liquidity cycle and how it aligns with asset allocation.
Commodities are often the last assets to decline, which is exactly what we see today (gold, silver, copper, palladium).
From this perspective, the current cycle looks very typical.
Data: Global Liquidity Index
So, if liquidity is indeed peaking, we expect investors to rotate into cash and bonds as the environment changes. To be clear, this part of the process hasn't started yet (markets remain risk-on).
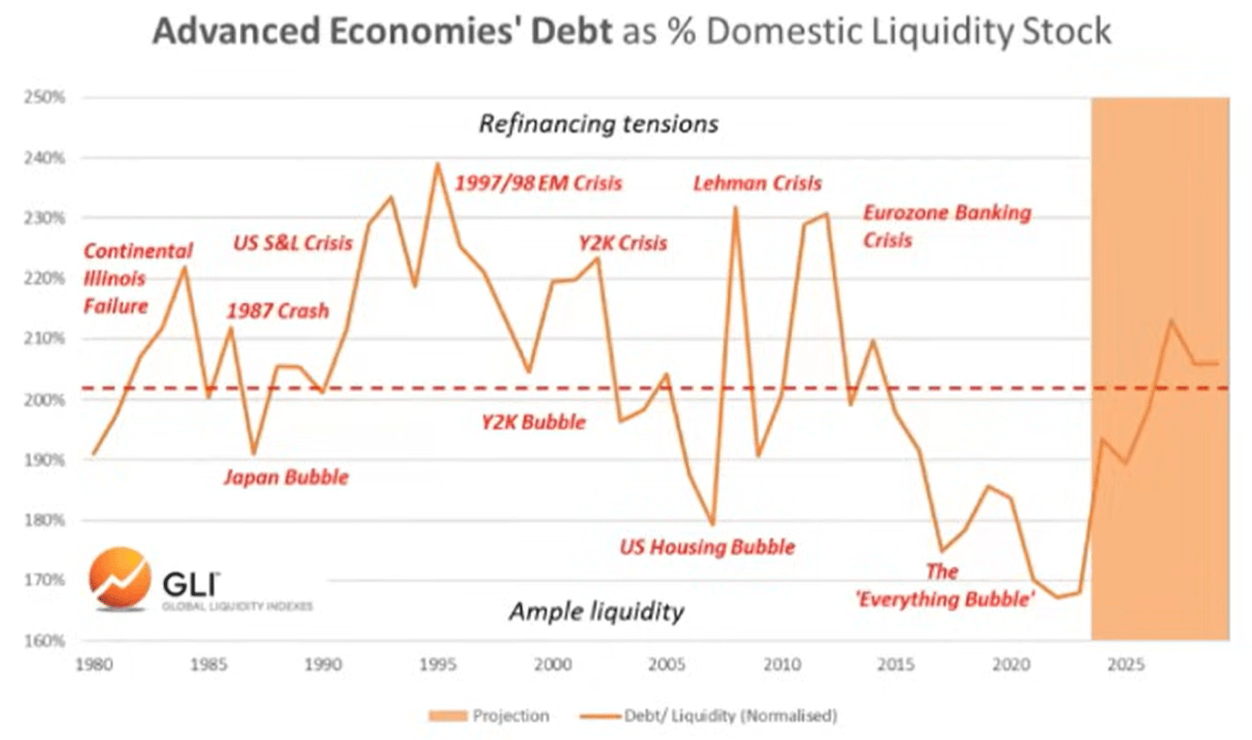
Debt and Liquidity
According to the Global Liquidity Index, the debt-to-liquidity ratio in major economies reached its lowest level since 1980 at the end of last year. It is now rising and is expected to continue climbing through 2026.
Data: Global Liquidity Index
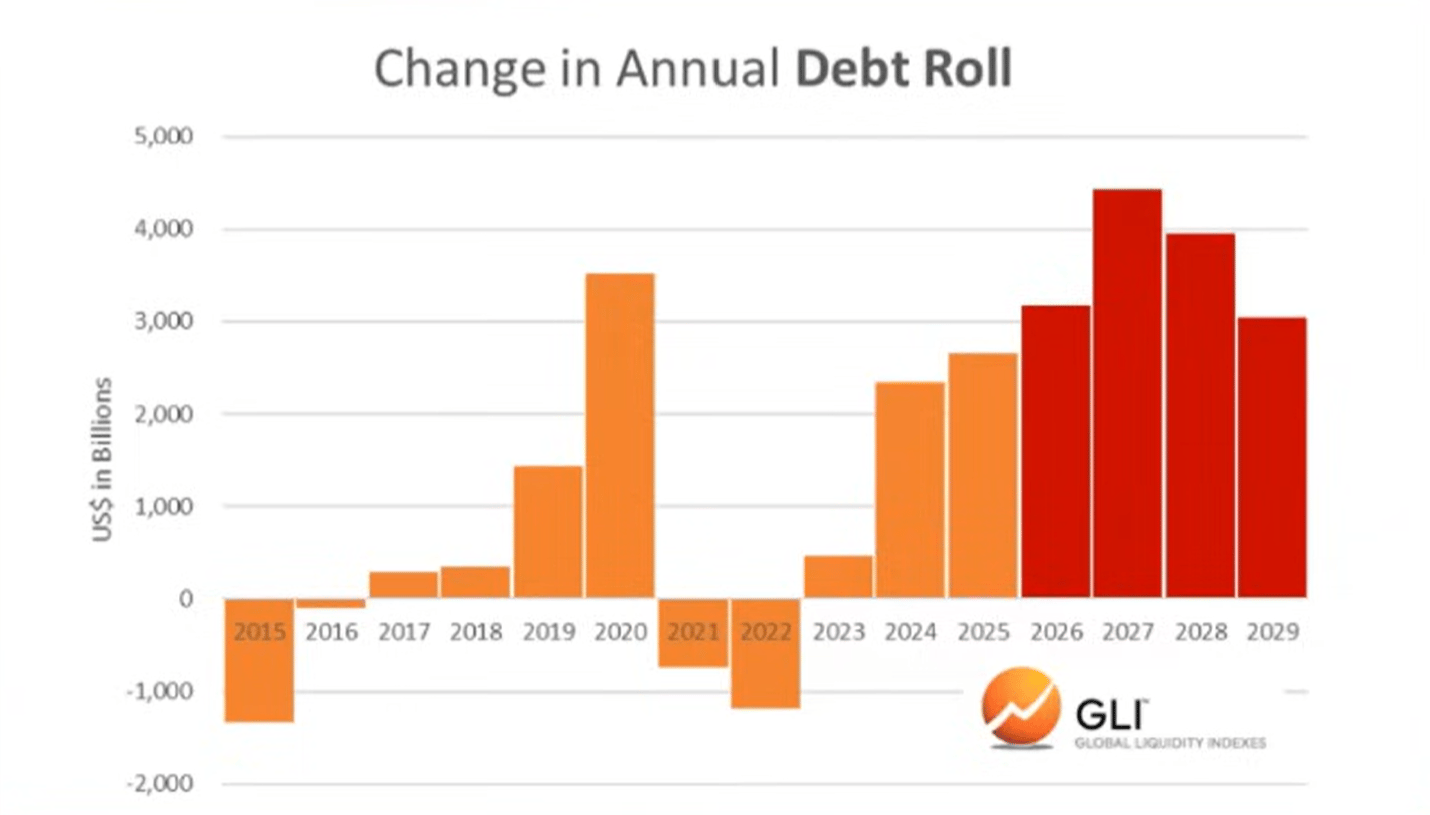
Rising debt-to-liquidity ratios make it harder to service trillions of dollars in debt that needs refinancing.
Data: Global Liquidity Index
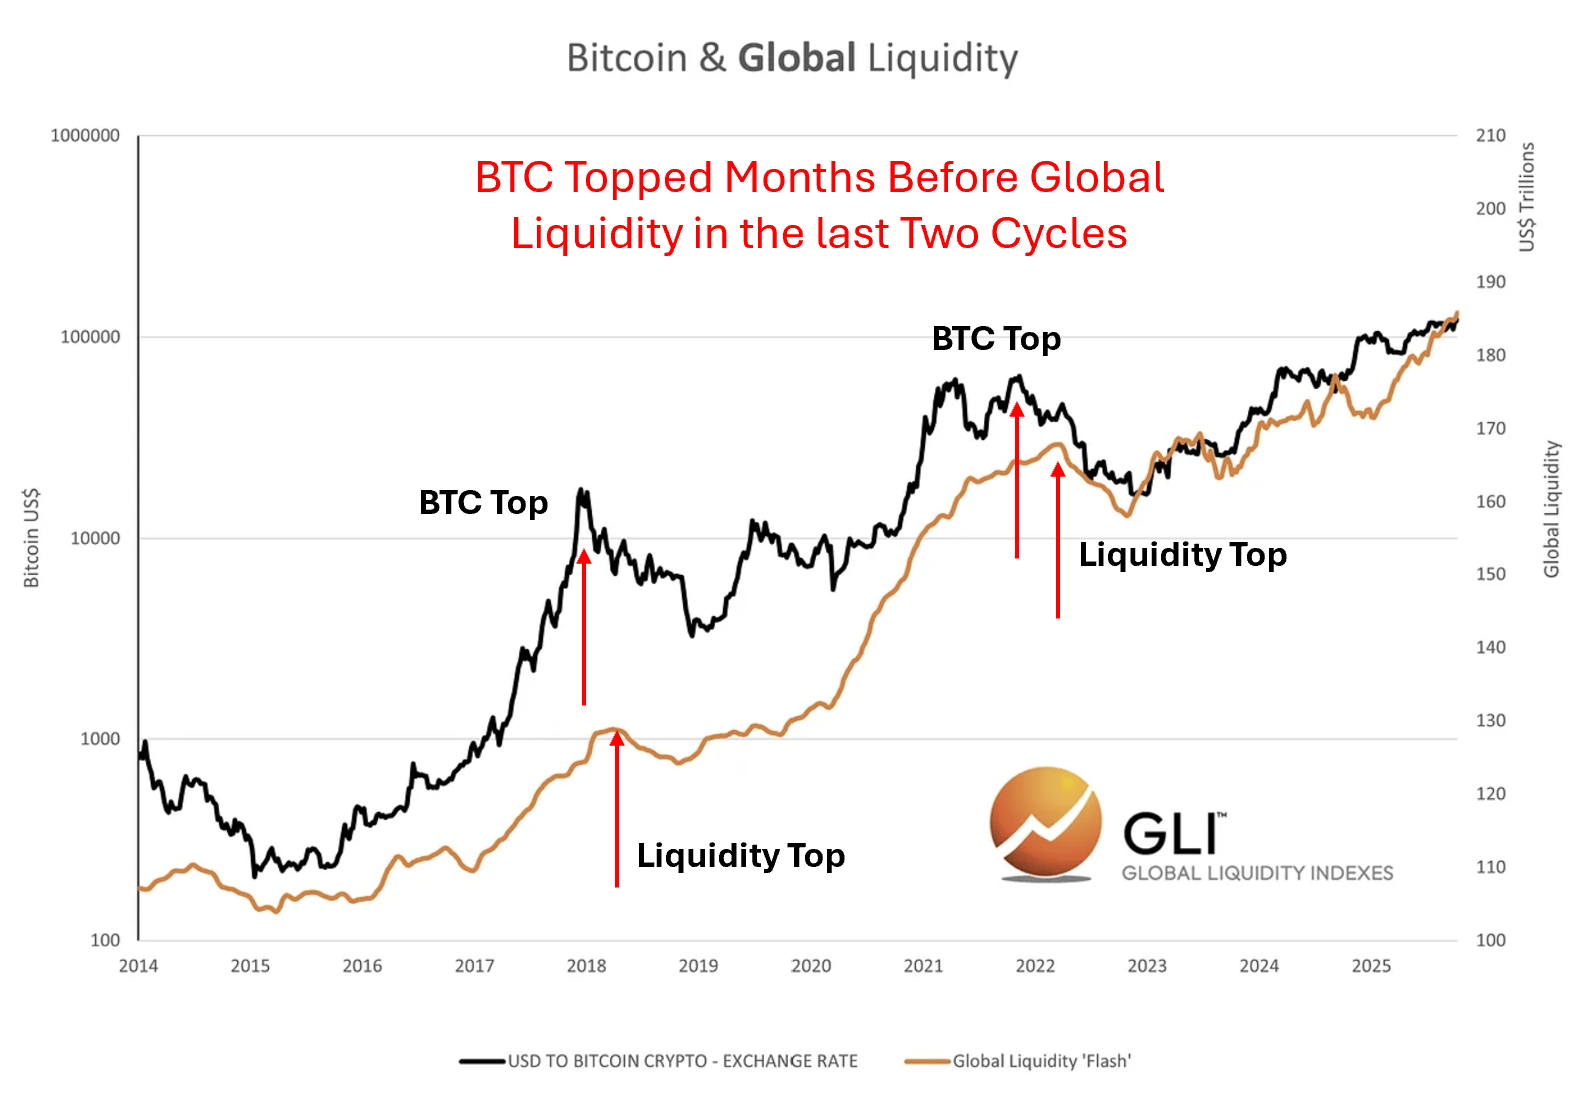
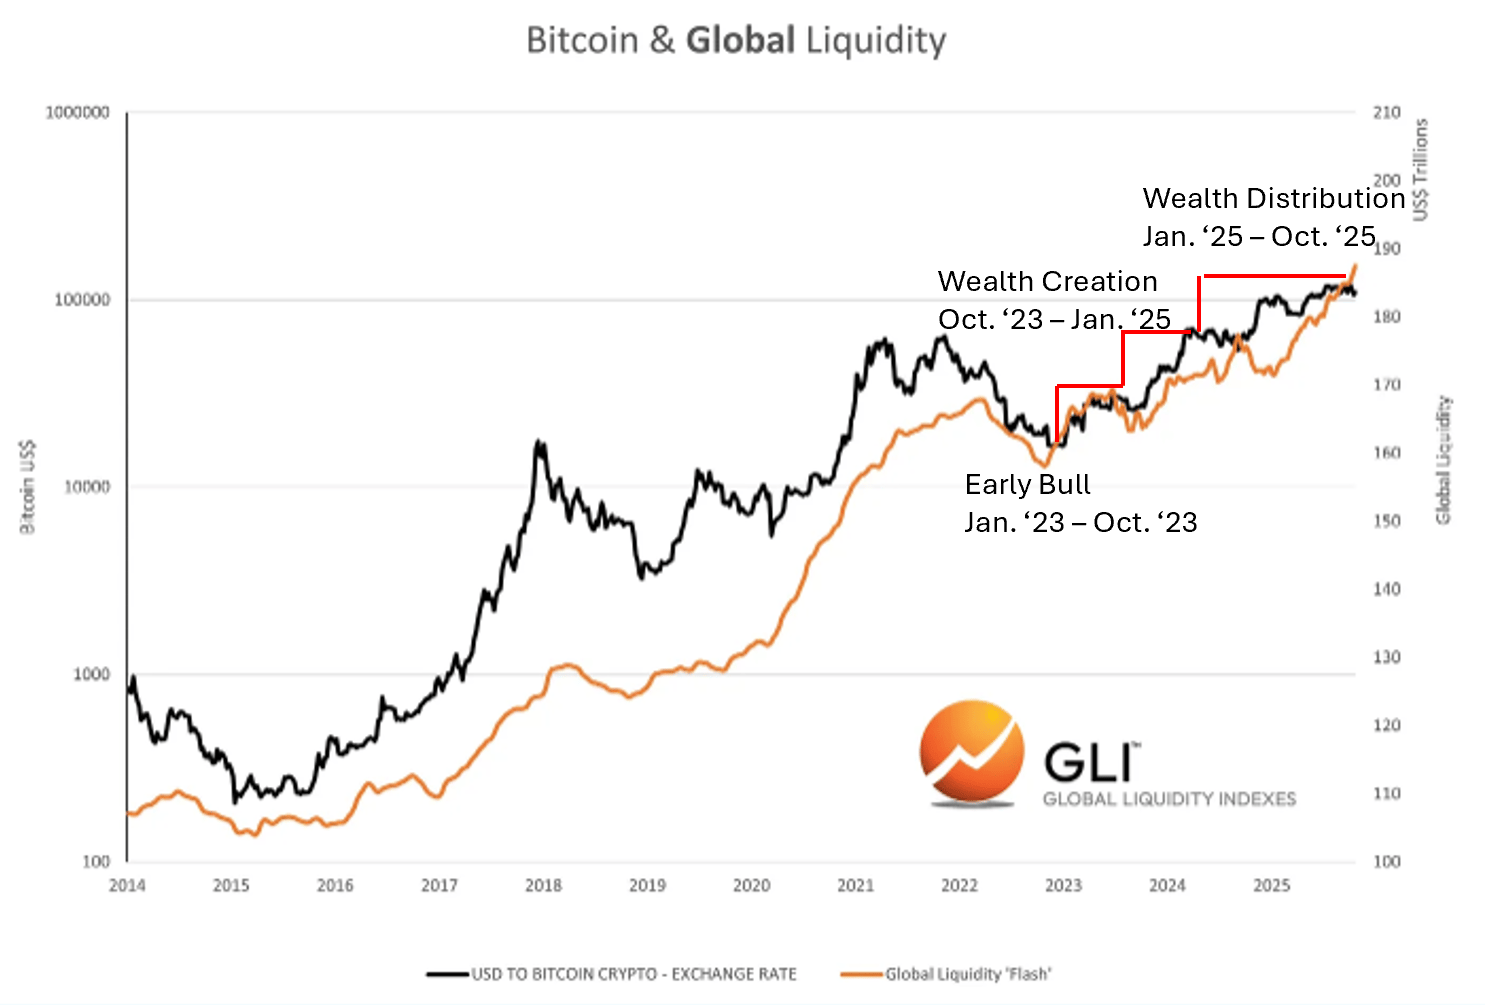
Bitcoin and Global Liquidity
Certainly, Bitcoin has "foreshadowed" the peak in global liquidity over the past two cycles. In other words, Bitcoin peaked months before liquidity peaked and turned down, seemingly anticipating the subsequent decline.
Data: Global Liquidity Index
We don't know if this is happening again now. But we do know that crypto cycles have consistently followed liquidity cycles.
Alignment with Crypto Cycles
Data: Global Liquidity Index
Join TechFlow official community to stay tuned
Telegram:https://t.me/TechFlowDaily
X (Twitter):https://x.com/TechFlowPost
X (Twitter) EN:https://x.com/BlockFlow_News