Arthur Hayes: Bitcoin Trapped in "USD Liquidity Anxiety" — What Lies Ahead in a Loose Monetary Cycle?
TechFlow Selected TechFlow Selected
Arthur Hayes: Bitcoin Trapped in "USD Liquidity Anxiety" — What Lies Ahead in a Loose Monetary Cycle?
When dollar liquidity expands, both Bitcoin and the Nasdaq index rise.
Author: Arthur Hayes
Translation: Saoirse, Foresight News

The deities I worship manifest as adorable plush toys. Every January to February—the peak ski season in Hokkaido—I pray to “Frowny Cloud,” the goddess of snowfall. The region’s unique climate means that in bountiful snow years, skies are perpetually overcast, with sunlight rarely breaking through. Fortunately, I also pray to the god of vitamins (embodied by a cute little horse🐴), who supplies me with essential reinforcements like vitamin D3.
I love snow, but not all snow is high-quality or safe. The kind of unrestricted, exhilarating skiing I enjoy requires specific snow conditions. Ideal powder forms when nighttime winds are calm and temperatures range between -5°C and -10°C, allowing fresh snow to bond tightly with existing layers, creating deep, soft powder. During the day, “Frowny Cloud” blocks certain wavelengths of sunlight, preventing southern-facing slopes from melting under direct sun exposure and reducing avalanche risks.
Sometimes, however, “Frowny Cloud” abandons us brave skiers at night. On cold, clear nights, snowpacks undergo cycles of warming and cooling that form ice crusts—creating persistent weak layers within the snowpack. These weak layers can remain dormant for extended periods; once a skier's weight transmits energy through the snowpack and triggers collapse of this layer, it may result in a fatal avalanche.
As always, the only way to understand what kind of snowpack “Frowny Cloud” has created is to study history. On the slopes, we dig deep pits to analyze the types of snow deposited over time. But this article isn’t about avalanche theory. In financial markets, our method of studying history involves analyzing charts and examining how past events interact with price movements.
This article explores the relationship between Bitcoin, gold, equities (specifically large-cap U.S. tech stocks comprising the Nasdaq-100 Index), and dollar liquidity.
Those who distrust cryptocurrencies yet swear by gold—or those atop the financial world adorned in luxury brands and preaching that "stocks are meant to be held long-term" (I didn’t score high enough GPA to get into Professor Siegel’s class at Wharton)—are now rejoicing that Bitcoin became the worst-performing major asset class in 2025. These gold devotees sneer at crypto enthusiasts: if Bitcoin truly functions as advertised—an instrument of protest against the established order—why hasn't it outperformed gold?
Proponents of fiat-equity investing mock crypto holders too: they claim Bitcoin is merely a high-beta version of the Nasdaq, yet in 2025 it failed even at that. If so, what justification remains for including crypto in an investment portfolio?
This piece presents a series of charts annotated with my personal insights to interpret the context behind these asset correlations. In my view, Bitcoin performed exactly as expected—it declined alongside falling fiat currency liquidity, particularly U.S. dollar liquidity, because in 2025, the credit impulse generated by Pax Americana (the period of relative global stability enforced by American hegemony) was the dominant market force.
Gold prices surged because price-insensitive sovereign nations have been stockpiling gold: they fear the safety of holding U.S. Treasuries, especially after the U.S. froze Russian Treasury holdings in 2022, and recent actions against Venezuela have further intensified concerns about dollar-denominated assets. Nations are increasingly substituting gold for U.S. Treasuries in their reserves.
Finally, the artificial intelligence (AI) bubble—and all industries benefiting from it—will not disappear. In fact, President Trump must expand government support for AI-related sectors, as AI is now the primary driver of U.S. GDP growth. This implies that even with slower growth in dollar issuance, the Nasdaq can continue rising, as Trump has effectively nationalized the AI industry. Anyone familiar with China’s capital markets knows that during early stages of industrial nationalization, related stocks often perform exceptionally well—but eventually falter as political objectives take precedence over returns for non-patriotic capitalists.
If Bitcoin, gold, and equity price movements in 2025 validate my market model, then going forward, I will continue focusing on fluctuations in dollar liquidity. Let me remind readers: my forecast is that the Trump administration will drive the economy into “overdrive” by expanding credit. A booming economy increases the likelihood of Republican re-election in November. Dollar credit expansion will occur via three channels: central bank balance sheet expansion, increased commercial bank lending to “strategic industries,” and quantitative easing to lower mortgage rates.
Given this historical analysis, does this mean I should boldly deploy newly acquired fiat assets into risk positions with extremely high exposure—like carving freely down a snowy slope? That judgment is left to the reader.
One Chart to Rule Them All
First, let’s compare Bitcoin, gold, and Nasdaq-100 Index returns during the first year of Trump’s second term (2025), along with how these assets correlate with changes in dollar liquidity.
I’ll elaborate later, but here’s a hypothesis upfront: if dollar liquidity declines, these asset prices should fall accordingly. Yet in reality, both gold and equities rose, while only Bitcoin behaved as expected—performing abysmally. Next, I’ll explain why gold and stocks managed to rise despite tightening dollar liquidity.

Chart labels: Bitcoin (red), Gold (gold), Nasdaq-100 Index (green), Dollar Liquidity (magenta)
All That Glitters
My journey into cryptocurrency began with gold. From 2010 to 2011, amid escalating Federal Reserve quantitative easing (QE) policies, I started buying physical gold coins in Hong Kong [1]. In absolute terms, I didn’t acquire many coins, but relative to my net worth at the time, the allocation was massive. Ultimately, I learned a harsh lesson in position management: in 2013, I had to sell my gold at a loss to fund arbitrage trades on the ICBIT exchange, using the proceeds to buy Bitcoin.
Fortunately, everything worked out in the end. After all this, I still hold substantial physical gold coins and bars stored in vaults around the world, and gold and silver mining stocks dominate my equity portfolio. Readers might wonder: if I’m a devoted follower of “Satoshi-sama,” why do I still hold gold?
Because we are in the early phase of global central banks selling U.S. Treasuries and buying gold. Additionally, nations are increasingly using gold to settle trade deficits—even analyzing U.S. trade deficit data reveals this trend.
Simply put, I buy gold because central banks are buying gold. Gold has served as humanity’s “true money” for thousands of years. Therefore, if central bankers lose faith in today’s dollar-dominated fiat financial system, they won’t turn to Bitcoin as a reserve asset—they will (and are) turning to gold. If gold’s share in global central bank reserves rebounds to 1980s levels, its price could reach approximately $12,000 per ounce. Before dismissing this as fantasy, allow me to demonstrate it with data.
In fiat systems, conventional wisdom holds that gold is an “inflation hedge,” so its price should roughly track official consumer price index (CPI) inflation figures. The chart above shows that since the 1930s, gold prices largely moved in line with inflation indices. However, post-2008—and especially after 2022—gold prices have significantly outpaced inflation. Is gold now in a bubble that will devastate investors like me?

U.S. Consumer Price Index (CPI) vs. Gold Price Analysis Chart
If gold were truly in a speculative bubble, retail investors would be rushing in en masse. The most popular way to trade gold is through exchange-traded funds (ETFs), with “SPDR Gold ETF (GLD US)” being the largest [2]. When retail investors go “all-in” on gold, GLD’s outstanding shares increase. To compare across time and gold price cycles, we divide GLD’s outstanding shares by the spot gold price. The chart below shows this ratio is declining, not rising—indicating a true retail gold speculation frenzy has yet to begin.

Chart label: Ratio of GLD US Shares Outstanding to Spot Gold Price
Since retail investors aren’t driving gold prices higher, who are these “price-insensitive buyers”? The answer: central banks worldwide. Over the past two decades, two key events made these “custodians of money” realize the dollar is no longer a reliable reserve currency.
In 2008, U.S. financial giants triggered a global deflationary panic. Unlike the 1929 crisis—when the Fed did little to counteract credit contraction—this time the Fed abandoned its duty to maintain dollar purchasing power and instead chose to “print” money to “rescue” select large institutions. This marked a turning point in central banks’ allocation between U.S. Treasuries and gold—Treasury holdings peaked, while gold allocations hit rock bottom.
In 2022, President Biden shocked the world by freezing Russia’s Treasury holdings. Remember, Russia possesses the world’s largest nuclear arsenal and is one of the top commodity exporters. If the U.S. dares violate property rights of a nation like Russia, weaker or resource-rich countries know they could face similar actions. Unsurprisingly, other nations refuse to increase Treasury holdings, fearing asset seizure, and are accelerating gold accumulation. Central banks, as gold buyers, are price-insensitive: if a U.S. president can freeze your assets overnight, your loss is 100%; compared to that counterparty risk, what does the cost of buying gold matter?

Foreign Central Bank Reserves: Long-Term Trends in Gold vs. U.S. Treasuries
The fundamental reason sovereign nations demand this “ancient asset” is that global trade deficit settlements are increasingly relying on gold. The record narrowing of the U.S. trade deficit in December 2025 proves gold is re-emerging as the true global reserve currency—the change in the U.S. trade deficit was more than 100% attributable to increased gold exports.
“Data released Thursday by the U.S. Commerce Department showed the U.S. goods trade deficit fell 11% month-on-month to $52.8 billion. This deficit is the smallest since June 2020 and below the $63.3 billion expected by economists surveyed by Reuters. From August to December, U.S. exports rose 3% to $289.3 billion, driven primarily by non-monetary gold exports; imports rose 0.6%.” — Source: Financial Times
Here’s how gold flows: the U.S. exports gold to Switzerland, where it is refined and cast into standardized bars before being shipped globally. The chart below shows the main buyers are China, India, and other emerging economies—nations either skilled in manufacturing tangible goods or exporting commodities. Their goods flow into the U.S., while gold flows toward more “productive” regions globally. Here, “productivity” doesn’t mean excelling at filling out complex reports or correctly denoting gender pronouns in email signatures, but rather exporting energy and critical industrial commodities, and producing steel, refining rare earths, and making real things. Amid declining dollar liquidity, gold prices rise precisely because nations are accelerating the return to a global gold standard.

U.S. Gold Export Data – October 2025
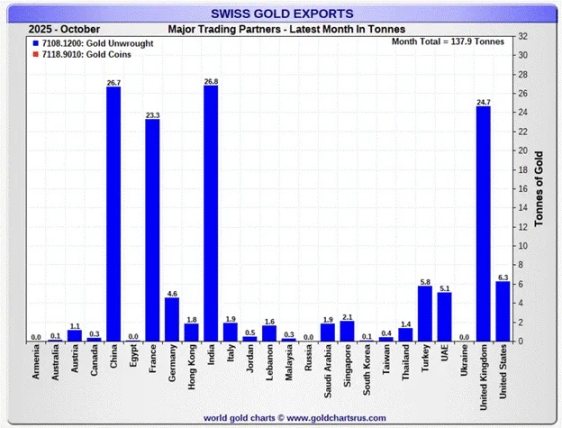
Swiss Gold Export Data – October 2025
Long-Term Assets Favor Liquidity
Every era has its hot tech stocks. In the 1920s U.S. bull market, RCA—the radio manufacturer—was the star tech play; in the 1960s–70s, IBM dominated with new mainframe computers; today, AI supercomputing firms and chipmakers reign supreme.
Humans are naturally optimistic, dreaming of a brighter future—as if investments today by tech companies will inevitably build a societal utopia. For those lucky enough to “own the future” via stock ownership, wealth seems to fall from the sky. To convince investors this bright future is inevitable, tech firms burn cash and take on debt. When liquidity is abundant (low funding costs), betting on the future becomes easy—because people believe these bold entrepreneurs will generate massive cash flows later. Thus, investors willingly spend “worthless” cash today to buy tech stocks for larger future cash flows, pushing up P/E ratios. Hence, in periods of excess liquidity, tech growth stocks often rise exponentially.
Bitcoin is a “monetary technology.” Its value correlates directly with the degree of fiat currency debasement. The invention of Proof-of-Work (PoW) blockchain technology achieved Byzantine fault tolerance—a breakthrough significant enough to ensure Bitcoin’s value exceeds zero. But for Bitcoin’s price to approach $100,000, sustained fiat currency depreciation is required. The surge in dollar supply after the 2008 global financial crisis was the direct cause of Bitcoin’s asymptotic price rise.
Therefore, my conclusion is:
When dollar liquidity expands, both Bitcoin and the Nasdaq Index rise.
But the problem is, recently Bitcoin and the Nasdaq diverged.

I believe the reason the Nasdaq didn’t decline with falling dollar liquidity in 2025 is that both China and the U.S. have effectively “nationalized” the AI industry.
AI “tech evangelists” have convinced leaders of the two largest economies that AI solves everything—it reduces labor costs to zero, cures cancer, boosts productivity, democratizes creativity, and most importantly, grants global military dominance. So regardless of how vaguely “victory” is defined, whichever nation wins in AI will dominate the world.
China already embraces this technological vision, which aligns perfectly with the Chinese Communist Party Politburo’s top-down goal-setting through Five-Year Plans. Chinese stock investors closely study each plan and annual revisions to identify which industries—and related stocks—will receive cheap government credit and policy advantages in competition.
In the U.S., at least in this era, such “policy-driven investment analysis” is still novel. Industrial policy is actually a shared choice between the U.S. and China—only marketed differently. Trump has been captivated by AI’s allure, and “winning in AI” has become a core component of his economic agenda. The U.S. government has effectively nationalized every segment deemed critical to “victory” in AI: through executive orders and public investment, Trump has muted free-market signals, channeling capital into all AI-related fields regardless of actual return on equity.
This is precisely why the Nasdaq Index diverged from Bitcoin and dollar liquidity trends in 2025, rising逆势.
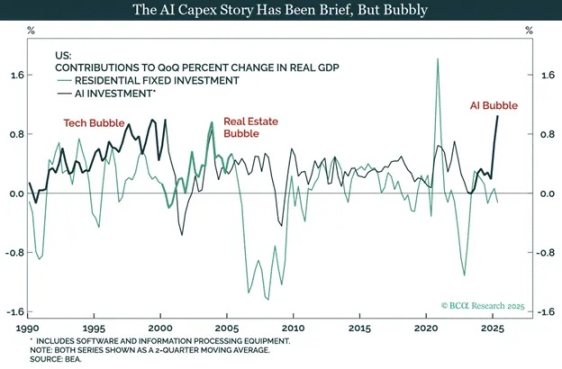
The Bubble Path of AI Capital Expenditure

Sales Growth Comparison Across S&P 500 Sectors: Tech/Communication Services vs. Others
Regardless of bubbles, increased spending to “win the AI race” is driving U.S. economic growth. Trump promised a “hot-running economy” during his campaign, so even if we look back in coming years and find these expenditures delivered ROEs below capital costs, he won’t stop now.
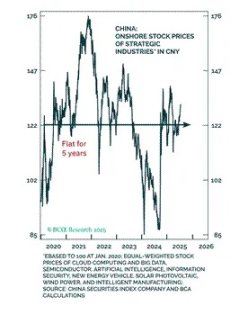
Stock Prices of Strategic Industries in China (Priced in CNY)
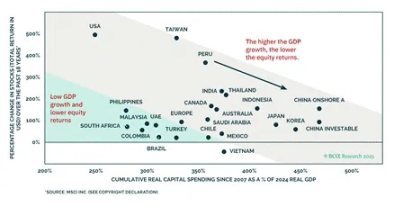
GDP Growth vs. Stock Returns: Global Economies Compared
U.S. tech investors should temper their expectations. America’s industrial policy aimed at “winning the AI race” is highly likely to waste investor capital. Trump’s (or his successor’s) political goals will ultimately clash with shareholder interests in firms labeled “strategic.” Chinese investors have already learned this lesson the hard way. As Confucius said: “Study the past.” But judging by the Nasdaq’s stellar performance, American investors clearly haven’t.

Change in Private Employment: U.S. Data Processing / Hosting Industry

Change in Private Employment: U.S. IT Services Industry

U.S. ISM Manufacturing Index Subcomponents
Chart note: Values below 50 indicate contraction. GDP growth has not revived manufacturing.
Did I think Trump was the “champion of the white working class”? Don’t be naive, friend. Former President Clinton sold your jobs to China; Trump brought factories back to America, but today’s factory floors are filled with Elon Musk’s AI robots. Sorry, you’ve been fooled again—though ICE (Immigration and Customs Enforcement) is still hiring [3]!
These charts clearly show the Nasdaq rally is backed by the U.S. government. Thus, even as overall dollar credit growth stagnates or contracts, AI industries still receive all funding needed to “win.” This explains why the Nasdaq diverged from my dollar liquidity index in 2025 and outperformed Bitcoin. I believe the AI bubble hasn’t burst yet. This “outperformance vs. Bitcoin” will remain a “normal state” in global capital markets until circumstances change—the most likely pivot being, as Polymarket predicts, Democrats taking control of the House in 2026, possibly even winning the presidency in 2028. If Republicans are “futurists” (Jetsons-style), Democrats are “conservatives” (Flintstones-style).
With gold and the Nasdaq surging, how can Bitcoin regain momentum? Answer: dollar liquidity must expand. Clearly, I believe dollar liquidity will expand in 2026—next, let’s explore the pathways.
Making the Economy “Run Hot”
First, I believe dollar liquidity expansion in 2026 will rest on three pillars:
- The Fed will expand its balance sheet through “money printing”;
- Commercial banks will increase lending to strategic industries;
- The Fed will use “money printing” to lower mortgage rates.

As shown above, in 2025 the Fed’s balance sheet shrank steadily due to Quantitative Tightening (QT) [4]. In December 2025, QT ended, and the Fed introduced a new “money-printing program”—Reserve Management Purchases (RMP)—at its monthly meeting. I detailed RMP mechanics in my article “Love Language.” The chart clearly shows the Fed’s balance sheet bottomed in December 2025. Under RMP, the Fed injects at least $40 billion monthly into markets, with purchases scaling up as U.S. government financing needs grow.

The above chart shows weekly U.S. banking system loan growth data published by the Fed, called “Other Deposits and Liabilities (ODL).” I began tracking this indicator after reading Lacy Hunt’s research. Starting Q4 2025, banks began increasing lending. The act of banks issuing loans is inherently a process of creating deposits “out of nothing”—i.e., creating money.
Banks like JPMorgan are eager to lend to enterprises directly supported by the U.S. government—JPMorgan launched a $1.5 trillion lending facility for this purpose. The mechanism works like this: the U.S. government makes an equity investment in a company or signs a procurement agreement (committing to buy its products), after which the company applies to JPMorgan or another major commercial bank for a loan to scale production. Government backing reduces default risk (by guaranteeing demand), so banks are willing to “create money” and finance these strategic industries. This mirrors China’s credit creation model—credit creation shifts from central bank to commercial banks, and at least initially, velocity of money rises sharply, driving nominal GDP growth above trend.
The U.S. will continue projecting military power, and building weapons of mass destruction requires financing from the commercial banking system. This is why bank credit growth will enter a long-term upward trend in 2026.

Trump comes from real estate and deeply understands project financing. Recently, he issued a directive requiring government-sponsored enterprises (GSEs) Fannie Mae and Freddie Mac to deploy funds sitting on their balance sheets to purchase $200 billion in mortgage-backed securities (MBS) [5]. Prior to this order, these funds were idle, so this policy directly increases dollar liquidity. If successful, Trump will likely roll out similar measures.
Lowering mortgage rates to heat up the housing market will enable many Americans to tap record home equity via mortgages. This “wealth effect” will make ordinary citizens feel economically satisfied on election day, leading them to vote for Republicans (the red team). For us risk asset holders, the key outcome is more credit creation to purchase various financial assets.

Bitcoin (gold curve) and dollar liquidity (white curve) nearly bottomed simultaneously. As previously stated, with massive dollar liquidity expansion ahead, Bitcoin’s price will follow. Forget Bitcoin’s dismal 2025 performance—the liquidity environment simply couldn’t support crypto portfolios. But we must not draw the wrong conclusion from Bitcoin’s poor showing: its price trajectory remains tightly linked to liquidity shifts, just as it always has been.
Trading Strategy
I am a radical speculator. Although Maelstrom Fund is nearly fully invested, given my strong conviction in expanding dollar liquidity, I want to increase risk exposure further. Thus, I’ve taken long positions in Strategy (ticker: MSTR US) and Metaplanet (ticker: 3350 JT)—gaining leveraged Bitcoin exposure without trading perpetual futures or options derivatives.

I divided Metaplanet’s stock price (white curve) by yen-denominated Bitcoin price, and Strategy’s stock price (gold curve) by dollar-denominated Bitcoin price. Results show both stocks’ “Bitcoin exchange rate” is near two-year lows, significantly off their mid-2025 peaks. If Bitcoin rebounds to $110,000, investors will again favor indirect Bitcoin exposure via these stocks. Due to their inherently leveraged capital structures, these stocks will outperform Bitcoin itself during upward price phases.
Additionally, we continue accumulating Zcash (ZEC). The departure of developers from Electric Coin Company (ECC) is not bearish. I firmly believe these developers, now in independent profit-driven entities, will create superior, more impactful products. I’m glad to have bought ZEC at low prices from panicked sellers.
Fellow speculators, press forward, climb higher. The outside world is risky—protect yourselves. May peace be with you, and hail to the goddess “Frowny Cloud”!
Join TechFlow official community to stay tuned
Telegram:https://t.me/TechFlowDaily
X (Twitter):https://x.com/TechFlowPost
X (Twitter) EN:https://x.com/BlockFlow_News