Huobi Growth Academy | Cryptocurrency Market Macro Report: Repricing of Crypto Assets Amid Liquidity Withdrawal
TechFlow Selected TechFlow Selected
Huobi Growth Academy | Cryptocurrency Market Macro Report: Repricing of Crypto Assets Amid Liquidity Withdrawal
When leverage is liquidated, speculators exit the market, and valuations return to rational levels, projects with genuine long-term value will present ideal entry opportunities.
Executive Summary
In Q1 2026, the crypto market experienced a historic deleveraging storm. Bitcoin retreated over 40% from its peak; Ethereum fell even deeper; and most altcoins were cut in half. This plunge was not merely triggered by cooling market sentiment or regulatory rumors. Rather, it resulted from the confluence of three simultaneous liquidity-tightening forces: large-scale unwinding of yen carry trades; U.S. Treasury General Account (TGA) balance rebuilding—draining funds from financial markets; and systemic margin hikes across derivatives markets. These factors, combined with crypto’s inherently high-leverage structure and valuation bubbles, collectively triggered a cascading liquidation event. Looking ahead, the crypto market has moved beyond the “liquidity-abundance-driven” phase of rapid, undisciplined growth and entered a new macro-driven normal. Against the backdrop of uncertain Fed policy paths and global central bank balance sheet contractions, crypto assets face persistent repricing pressure.
I. U.S. Equity Valuations at Historic Highs: The “Ceiling Effect” on Risk-Asset Pricing
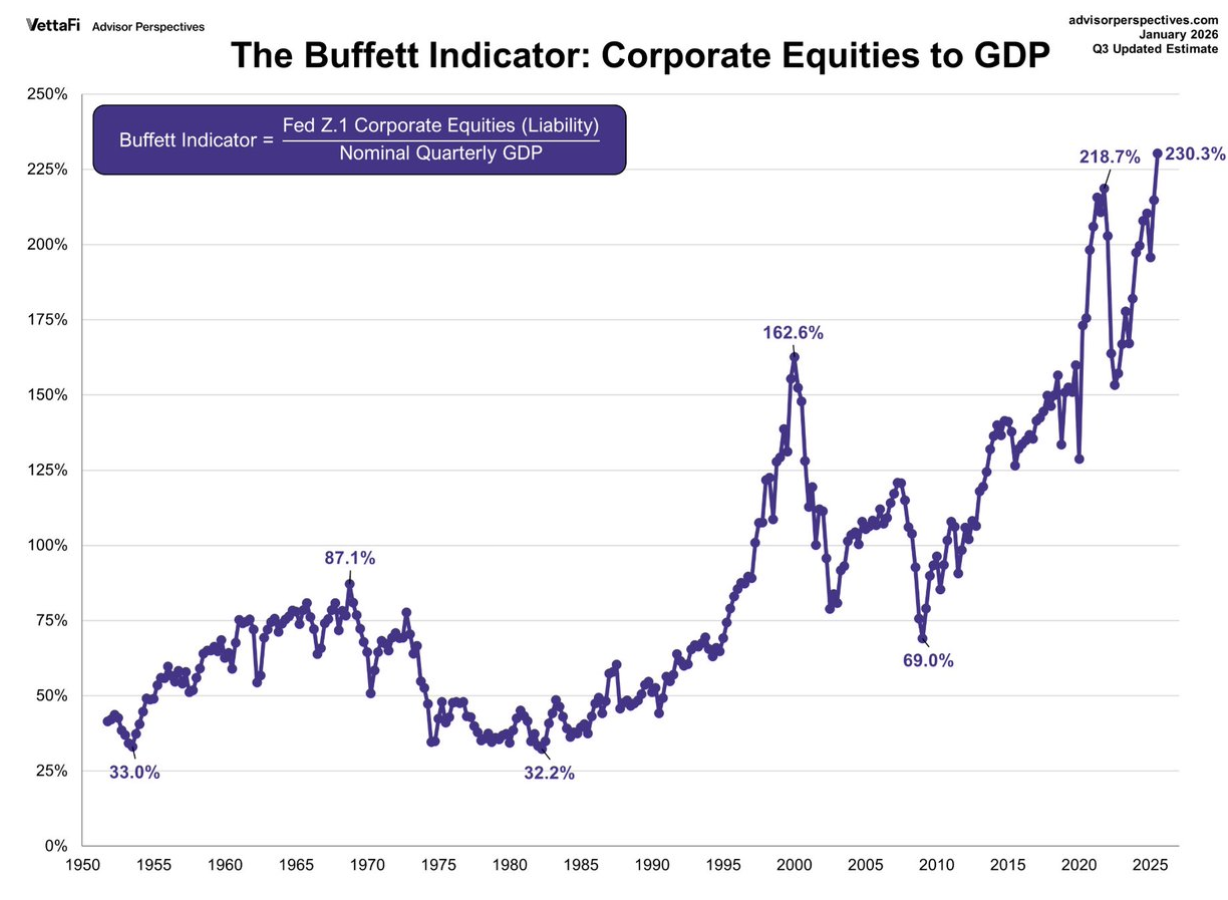
A critical macro backdrop for analyzing crypto market movements is the current historic elevation of U.S. equity valuations. As the global risk-asset pricing anchor, U.S. equity valuations reflect not only expectations for corporate earnings but also deeply influence crypto’s valuation ceiling via asset substitution effects, investor risk appetite, and global capital flows. Multiple indicators confirm today’s extreme equity valuations. The Buffett Indicator—the ratio of total U.S. stock market capitalization to GDP—has surged to an unprecedented 230%, far exceeding levels seen before both the 2000 dot-com bubble and the 2007 financial crisis. The S&P 500’s 12-month forward P/E stands at 22.0x, significantly above its 30-year historical average of 17.1x and nearing the 25.2x peak observed during the dot-com bubble. The Shiller CAPE ratio sits at ~38x—second only to the 44x peak in 2000. The price-to-sales (P/S) ratio has breached 3.0x, hitting an all-time high. Collectively, these metrics point unambiguously to significant U.S. equity overvaluation.
This elevated equity valuation transmits pressure to crypto markets through multiple channels. From an asset substitution perspective, when U.S. equity valuations reach historic highs, their expected future returns decline, prompting rational investors to reassess overall risk-asset allocations. Crypto—being a higher-volatility, “peripheral risk asset”—is typically the first category to be trimmed. Regarding Fed policy constraints, elevated equity valuations place the Fed in a policy dilemma, constraining its room for easing and potentially forcing a more prolonged hawkish stance than markets anticipate—a headwind for all risk assets. On profit-taking, institutional investors have accumulated substantial U.S. equity exposure after years of gains; at extreme valuations, they systematically reduce risk exposure—often beginning with the highest-performing, most liquid assets, including Bitcoin. Lastly, as the global risk-asset barometer, elevated U.S. equity valuations trigger investor caution toward all assets that have surged excessively and lack transparent valuation frameworks—making crypto especially vulnerable to abandonment.
Historically, every time valuations reached comparable extremes, painful mean reversion inevitably followed—lessons etched by 1929, 2000, and 2007. What makes today’s valuation environment unique is that it is the direct outcome of the longest and largest monetary easing experiment in the past 15 years. When such policies begin reversing while valuations remain at historic peaks, the adjustment may prove more violent than prior cycles. For crypto, this implies that even if industry fundamentals continue improving, macro-level valuation headwinds will remain a major constraint over the next 1–2 years. Only once U.S. equity valuations revert to reasonable ranges—either gradually over time or sharply via price correction—can crypto truly embark on a new, healthy upward cycle.
II. Yen Carry Trade Unwinding: The “Invisible Siphon” on Global Liquidity
The reversal of the yen carry trade was the immediate catalyst—and most critical macro driver—behind this crypto crash. For years, the Bank of Japan’s zero-interest-rate policy rendered the yen the world’s cheapest funding currency. International investors borrowed vast sums in yen, converted them into dollars or other high-yield currencies, and deployed the proceeds into global high-return assets—including highly volatile cryptocurrencies.
At the start of 2026, the foundational logic of this carry trade began crumbling. Rising domestic inflation pressures in Japan dramatically increased market expectations for the BOJ’s exit from negative rates. Japanese government bond yields spiked repeatedly; the 10-year JGB yield breached 1.2%, reaching a multi-year high. This directly compressed the interest-rate differential between yen and dollar: as the cost of borrowing yen rose while expected returns on dollar-denominated assets remained flat—or even declined—the carry trade’s appeal evaporated.
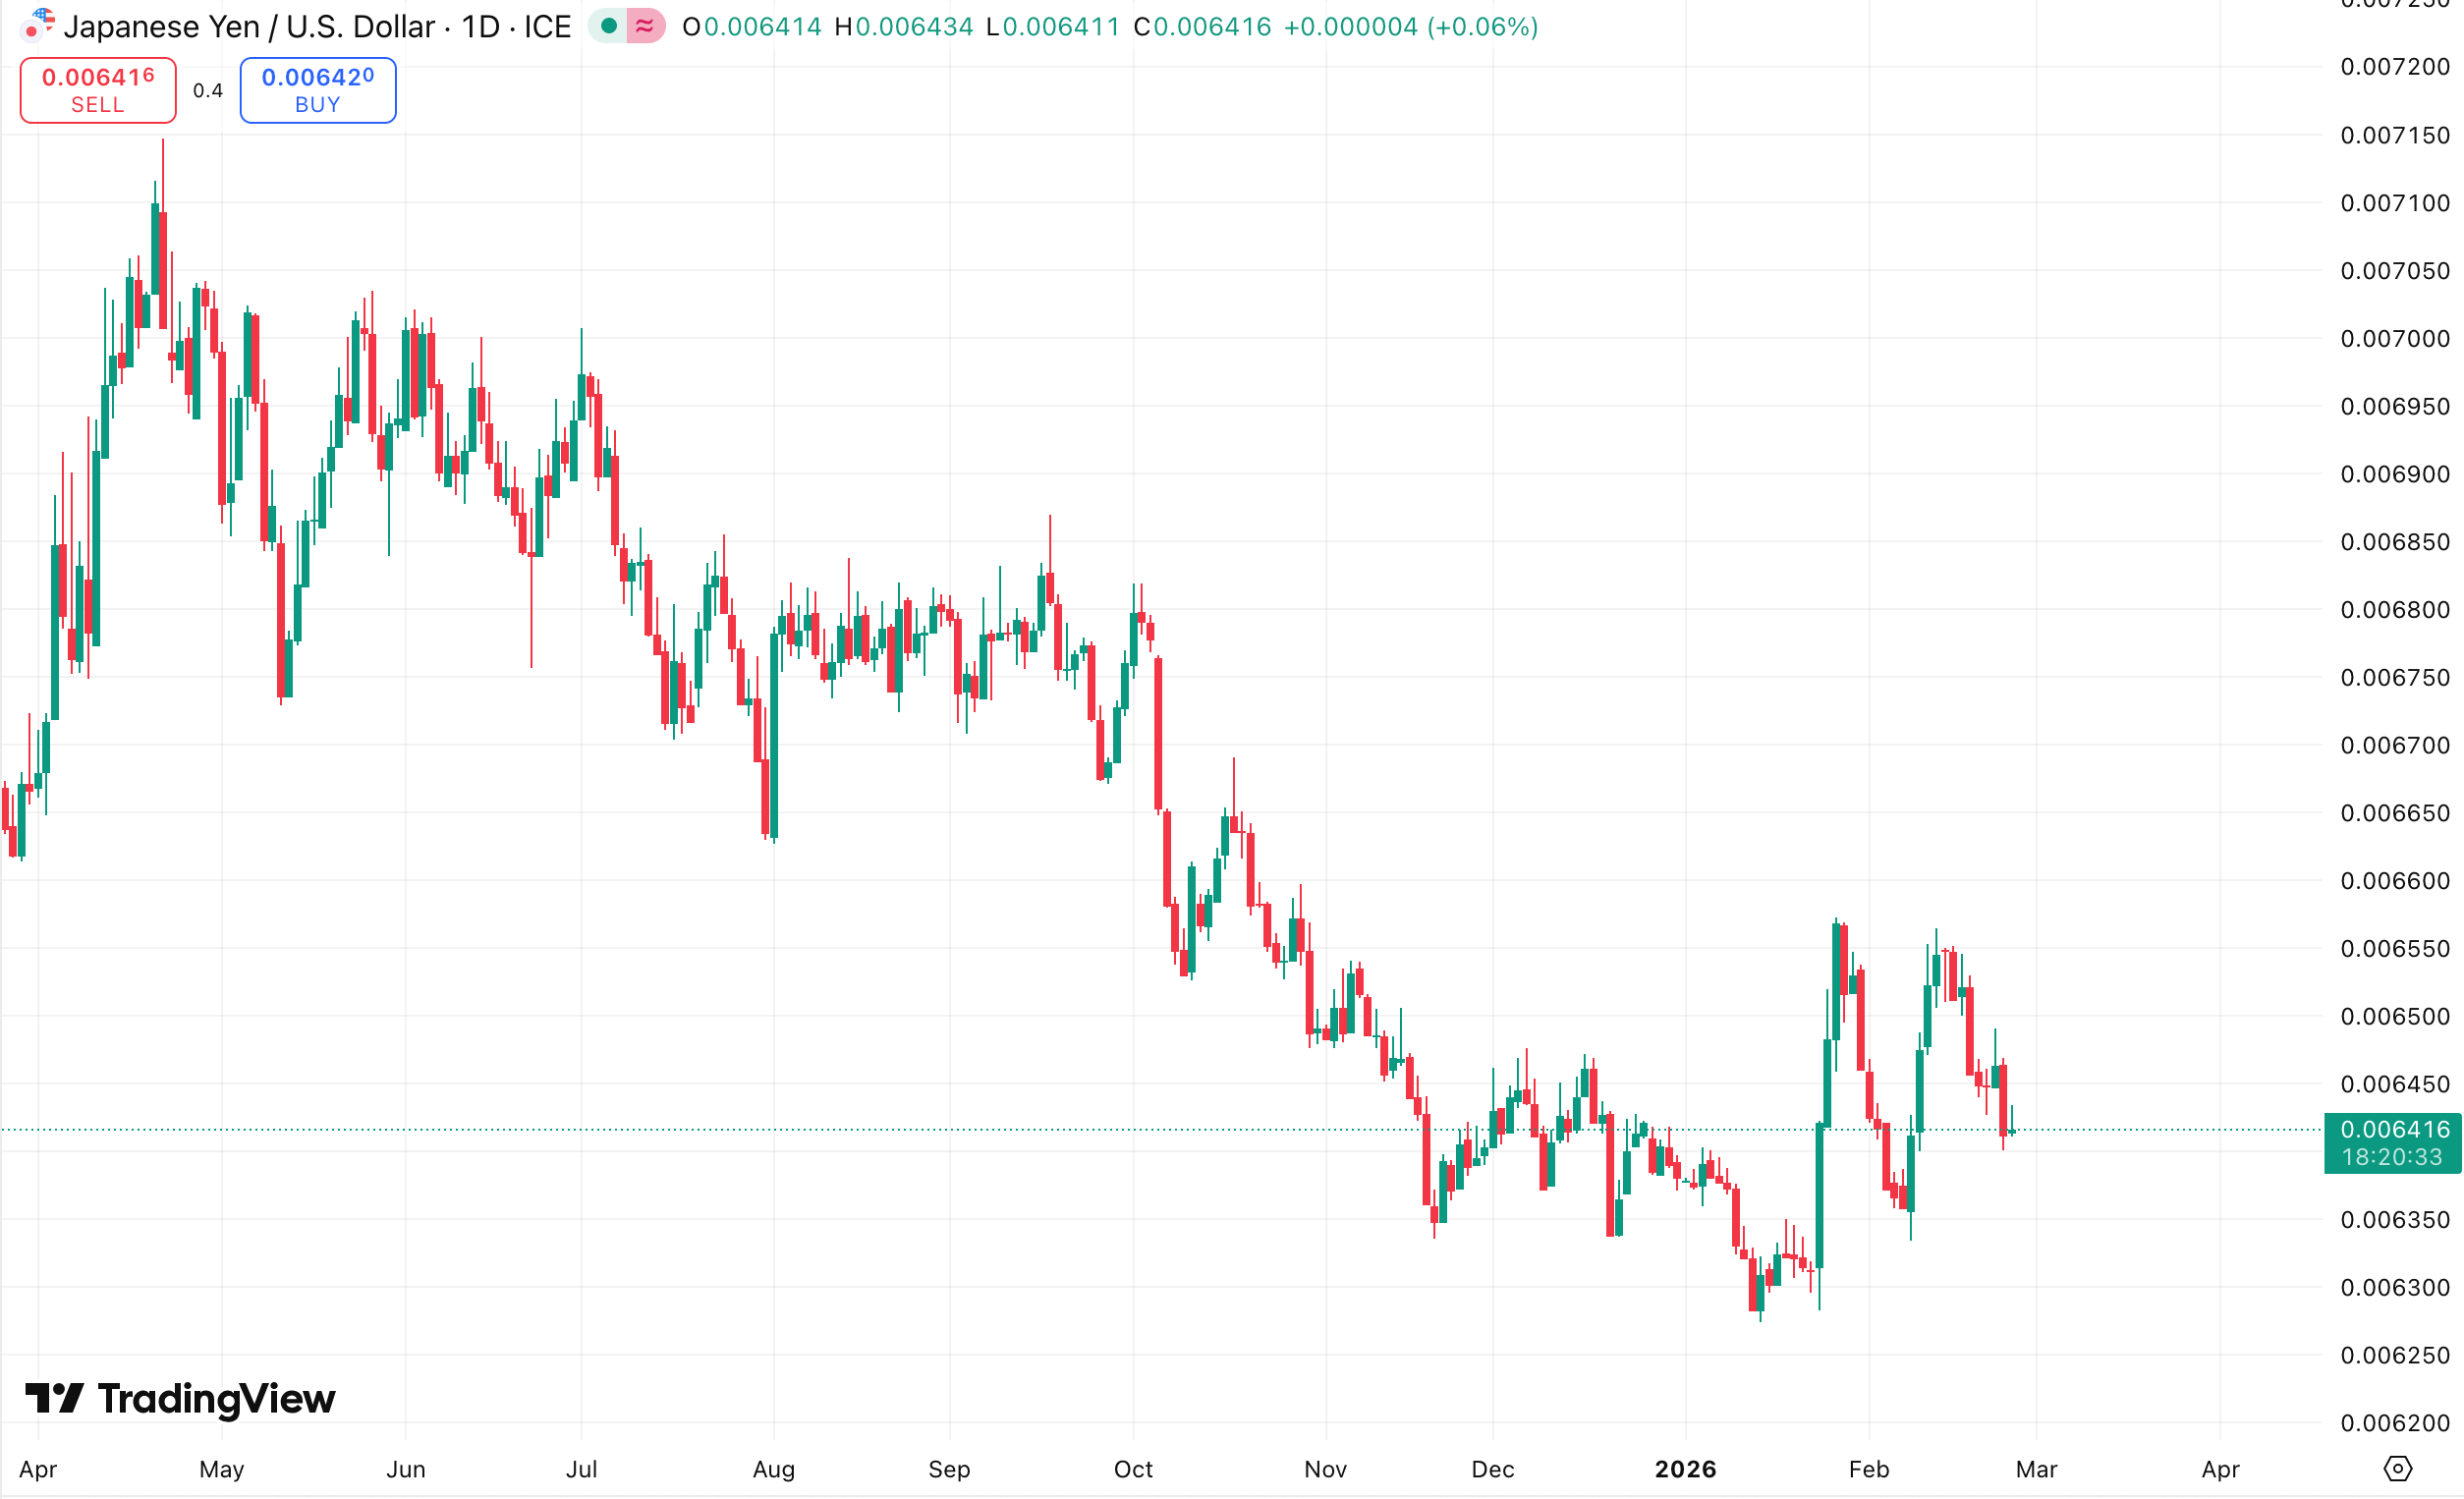
Even more damaging, as the yen appreciated (USD/JPY falling from above 150 to the 140 range), carry traders faced not just narrowing spreads—but outright foreign-exchange losses. In such circumstances, the most rational response is to unwind positions: sell overseas holdings—including Bitcoin and Ethereum—to repatriate yen and repay loans. Crypto’s unique characteristics—24/7 trading and high liquidity—make it the “ATM of choice” for carry traders executing rapid exits. Data confirms this clearly: during several trading days in mid-February, as the yen surged, Bitcoin’s price against the yen exhibited strong negative correlation—a textbook signature of carry-trade unwinding.
Notably, estimates suggest the yen carry trade totals several trillion dollars—and its unwinding tends to persist. So long as the U.S.-Japan yield spread fails to widen again and yen appreciation remains intact, this “siphon” will continue draining capital from global risk assets. For a crypto market dependent on fresh inflows, this amounts to pulling the rug out from under its feet.
III. TGA Rebuilding & Treasury Issuance: Fiscal Policy’s Liquidity “Suction Effect”
If yen carry-trade unwinding represents international liquidity tightening, then shifts in the U.S. Treasury General Account (TGA) balance constitute direct liquidity withdrawal within the dollar system itself. The TGA functions as the Treasury’s “wallet”: when the Treasury increases its TGA balance—via debt issuance or tax receipts—it drains funds from the banking system into its own account, reducing bank reserves and tightening market liquidity. Conversely, when the Treasury spends (e.g., on contracts or social security), funds flow back into markets, boosting liquidity.
From February to March 2026, markets faced rapid TGA balance rebuilding. Per the Treasury’s published financing plan, the TGA target stood at $850 billion by end-March—and would surge to ~$1.025 trillion by April’s tax season peak. This implies the Treasury will extract nearly $200 billion from the financial system in just two months. Simultaneously, to replenish the TGA and finance the fiscal deficit, the Treasury announced a massive quarterly refinancing program in early February—issuing more Treasuries than markets anticipated.
This dual operation—“issuing debt + building up TGA”—directly drove down bank reserves. For crypto, the transmission channel is more indirect but equally lethal: declining bank reserves → tighter credit conditions for financial institutions → reduced funding capacity for hedge funds and market makers → forced risk reduction → crypto asset sales. Stablecoin issuers hold primarily U.S. Treasuries as reserves; TGA rebuilding amplifies Treasury yield volatility, indirectly straining stablecoin redemption pressures and liquidity support.
Historically, sharp TGA fluctuations correlate strongly with risk-asset prices. In early 2021, the TGA’s rapid drawdown (reflecting fiscal spending) coincided with Bitcoin’s bull-market climax; conversely, the 2026 TGA rebuild aligns precisely with crypto’s sustained downtrend and eventual collapse. This is no coincidence—it reflects the inevitable mapping of liquidity cycles.
IV. Margin Hikes & Derivatives Deleveraging: Exchange-Level Forced Liquidations
Beyond macro liquidity tightening, the inherent fragility of crypto’s own derivatives structure amplified the crash. In early February, amid extreme volatility in gold and silver markets, the Chicago Mercantile Exchange (CME) repeatedly raised margin requirements for precious metals futures. Though targeting metals directly, the ripple effects rapidly spilled over to crypto.
First, as the world’s premier derivatives exchange, CME’s margin adjustments set a de facto benchmark. Observing rising volatility, major crypto exchanges’ risk departments swiftly followed suit—raising margin ratios and lowering maximum leverage for perpetual and futures contracts. For a market where leveraged trading dominates, this amounted to forced deleveraging. A wave of high-leverage positions was liquidated, pushing prices lower and triggering further cascading liquidations—a vicious negative spiral.
Second, crypto and precious metals share overlapping long-side participants—macro hedge funds and trend-following traders. When margin hikes inflicted losses on these firms in metals markets, they often sold other assets—including crypto—to meet margin calls or offset losses. Cross-asset risk unwinding thus intensified crypto’s selling pressure.
More critically, during this crash, Bitcoin and Ethereum’s futures premiums rapidly flipped to negative (i.e., contango turned into backwardation), while perpetual contract funding rates remained persistently negative—signaling a decisive shift from long-dominant to short-dominant market structure. When funding rates stay negative for extended periods, longs bear not only price losses but also ongoing payments to shorts—further eroding long conviction and prolonging the bottoming process. Historically, true stabilization only emerges once funding rates return to neutral—or turn positive—and futures premiums recover.
V. Crypto’s Own Structural Vulnerabilities: Dual Fragility of High Valuation & Liquidity Dependence
Against the backdrop of macro liquidity tightening, crypto’s internal high-valuation and high-leverage traits magnified the severity of the downturn. Although crypto lacks traditional P/E metrics, we can assess its valuation through multiple dimensions:
First, Bitcoin’s market-cap share. Prior to this crash, Bitcoin’s market-cap share briefly dipped below 40%, as capital flooded into myriad altcoins and DeFi tokens—a classic late-bull-market signal. Capital chases high-risk, high-return “tail assets” rather than blue-chip leaders. When liquidity reverses, these high-beta assets are invariably the first to fall—and drop hardest.
Second, total stablecoin market cap. Stablecoins serve as crypto’s “dry powder”; their aggregate market cap reflects off-chain capital inflow intentions. Data shows USDT and USDC market caps stagnated—or even slightly declined—since January 2026, indicating new capital inflows have failed to keep pace with market expansion. When markets rely solely on existing capital and leverage to sustain elevated prices, any liquidity shock risks collapse.
Third, divergence between on-chain activity and price. In the months preceding the crash, Bitcoin’s price held near highs—but on-chain active addresses and transaction counts failed to hit new highs, even declining. This reveals price gains were driven primarily by exchange-based leveraged trading—not genuine fundamental improvement or adoption growth. Leverage-fueled rallies tend to rise fast and fall faster; once liquidity tightens, prices rapidly revert.
Crypto’s uniqueness lies in its participants’ extraordinary sensitivity to macro liquidity—far exceeding other asset classes. Because crypto lacks traditional “intrinsic cash flows,” its price depends entirely on marginal buyers’ willingness to enter. When macro liquidity is abundant, these marginal buyers—mostly risk-tolerant retail investors and hedge funds—have ample capital to push prices higher. When macro liquidity tightens, they’re also the first to exit. This crash vividly illustrates that mechanism.
VI. Outlook: Crypto Asset Repricing Within a Liquidity-Indicator Framework
Looking ahead, crypto’s trajectory will no longer hinge on single variables—but will operate within a macro-dominated new paradigm. Investors must adopt a liquidity-indicator–centric analytical framework, focusing on these key variables:
First, the Fed’s policy path. While market concerns about incoming Fed Chair Warsh’s hawkish stance are understandable, what matters more is actual economic data. If labor markets show clear softening and inflation continues falling, the Fed’s tightening pace could slow more than expected. Though CME FedWatch shows market expectations for 2026 rate cuts have been drastically scaled back—and this is already partially priced in—the pivotal question is when the Fed signals an unambiguous policy pivot.
Second, TGA balance and net liquidity dynamics. Investors should closely track the Treasury’s weekly TGA updates, alongside Federal Reserve balance sheet data and Overnight Reverse Repurchase (ON RRP) balances. Net liquidity—calculated as Fed’s total assets minus TGA minus ON RRP—is the most intuitive gauge of available cash in markets. Persistent net liquidity declines will keep crypto under pressure; conversely, a sustained bottoming and rebound could spark a tactical rally.
Third, evolution of the yen carry trade. USD/JPY and the U.S.-Japan 2-year yield spread are two key watchpoints. If yen appreciation halts and the yield spread stabilizes—or widens—carry-unwinding pressure eases, delivering a positive signal for global risk assets, including crypto. Conversely, continued yen strength warrants vigilance for further deleveraging.
Finally, crypto’s internal structural indicators. Resumption of stablecoin market-cap growth, stabilization of Bitcoin’s market-cap share, and a return of perpetual funding rates to positive territory—all serve as crucial markers for assessing whether the market has truly bottomed. Historically, real confidence recovery only occurs when funding rates sustain positivity, futures premiums recover, and stablecoins begin flowing back onto exchanges.
On a time horizon, Q2 is typically the year’s most liquidity-constrained quarter (tax season pushes TGA to peak), compounded by ongoing Fed balance-sheet runoff—suggesting crypto may continue its choppy, bottoming process. A genuine turning point may only emerge in H2—once TGA balances begin declining and market consensus crystallizes around the Fed’s policy path.
VII. Conclusion: Farewell to Undisciplined Growth, Welcome to the Macro Normal
The Q1 2026 crypto crash was a systemic deleveraging event—macro liquidity-driven, yet structurally amplified by crypto’s own vulnerabilities. It marks the definitive end of the undisciplined, liquidity-fueled growth phase that began in 2023—and ushers in crypto’s macro-normal era.
In this new normal, crypto assets—like all risk assets—will be profoundly shaped by global central bank balance sheets, fiscal policy, exchange-rate dynamics, and other macro variables. Narratives claiming crypto’s “macro immunity” or its “digital gold safe-haven status” were debunked in this crash: during the true liquidity crisis, Bitcoin’s drawdown rivaled tech stocks’, and its correlation with the Nasdaq soared to record highs.
For investors, this means adopting a broader macro lens—not just project fundamentals or technical progress. Liquidity indicators must become core decision-making inputs: monitor net liquidity trends; watch for abnormal SOFR spikes; track the MOVE index (U.S. Treasury volatility); and observe widening high-yield credit spreads. These macro variables dictate crypto’s beta direction—while fundamentals only offer alpha opportunities once beta is established.
Of course, crashes often sow seeds of opportunity. Once leverage is purged, speculators exit, and valuations reset, genuinely long-term value projects present ideal entry points. Yet until macro liquidity conditions show an unambiguous inflection, prudence prevails. For crypto, cash is the ultimate scarce resource—and liquidity, the sole truth.
Join TechFlow official community to stay tuned
Telegram:https://t.me/TechFlowDaily
X (Twitter):https://x.com/TechFlowPost
X (Twitter) EN:https://x.com/BlockFlow_News