Has your portfolio kept pace with the shifting liquidity cycle?
TechFlow Selected TechFlow Selected
Has your portfolio kept pace with the shifting liquidity cycle?
We haven't reached the surge stage yet.
Author: hoeem
Translation: Saoirse, Foresight News
Wealth that lasts across generations is often built during the transition from a tightening to an easing phase in the liquidity cycle. Therefore, understanding your position within this cycle is key to positioning assets accurately. So where are we now? Let me walk you through it...
Why You Must Watch the Liquidity Cycle (Even If You Hate Macroeconomics)
Central bank liquidity acts like lubricant for the global economic engine:
Too much injection causes markets to “overspeed”; excessive withdrawal leads to “piston seizure,” much like your well-dressed date suddenly ghosting you. The crucial point is: if you can follow the rhythm of liquidity, you can anticipate bubbles and crashes ahead of time.
The Four Phases of Liquidity (2020–2025):
1. Surge Phase (2020–2021)
Central banks sprayed cash like fire hoses on full blast: zero interest rates, record-scale quantitative easing (QE), and $16 trillion in fiscal relief poured into markets.
In context, the growth rate of global money supply (M2) was faster than any period since World War II.
2. Drought Phase (2021–2022)
Interest rates spiked by 500 basis points, quantitative tightening (QT) began, and crisis support programs expired.
To put it simply, 2022 saw the largest annual bond market decline in history (approximately -17%).
3. Steady Phase (2022–2024)
Policies remained tight with no new actions.
Policymakers held steady, allowing existing measures to fully take effect in suppressing inflation.
4. Initial Pivot Phase (2024–2025)
Global central banks begin cutting rates and loosening restrictions, although rates remain relatively high—yet a downward trend has started.
Mid-2025 Status: One foot remains in the steady phase, while the other tentatively steps into the first stage of the initial pivot. Rates remain elevated and QT continues, but unless a new shock pulls us back into surge mode, the next move will likely be further easing.
More details in the "Traffic Light Quick Reference Guide" below...
Yes, I had GPT help me make an awesome table! This chart gives you an instant view of three critical years—2017, 2021, and 2025:
Twelve Key Liquidity Levers Traffic Light Quick Reference Guide:
🔴 Not Activated 🟧 Mildly Activated 🟢 Strongly Activated
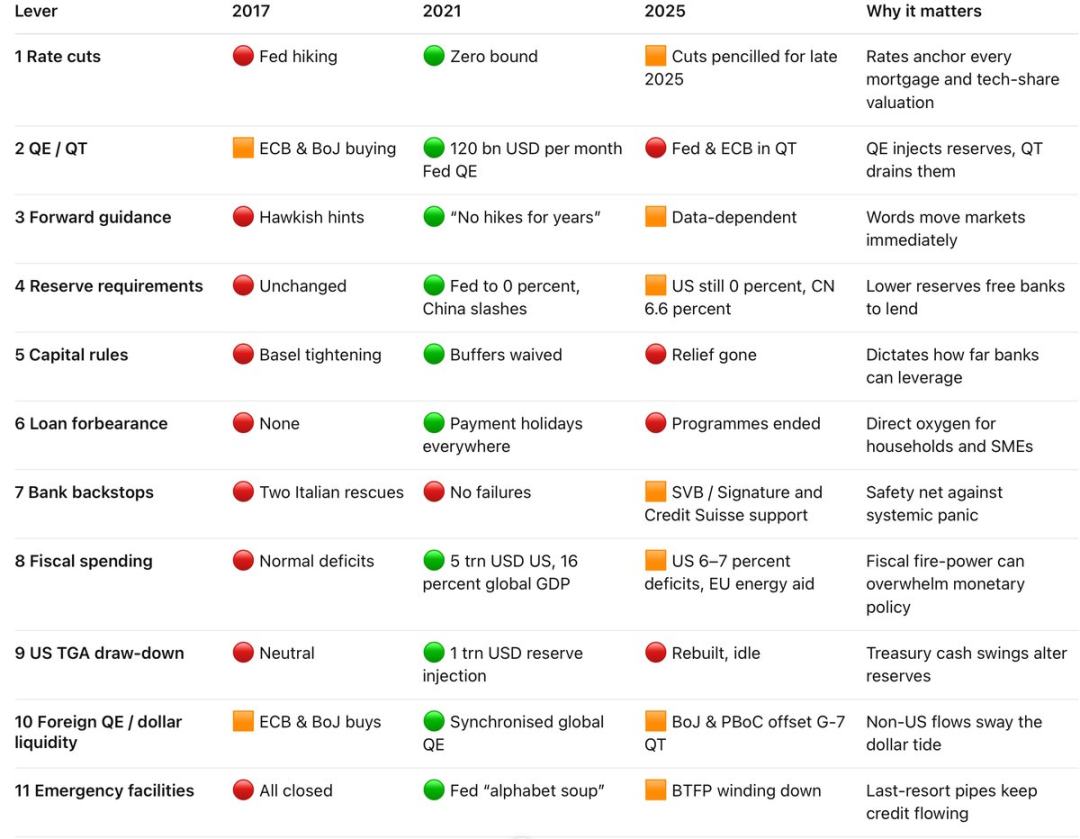
🔑 Which single lever controls activation of the other 11?

Breakdown by Category:
Interest Rate Cuts—In 2017, the Fed raised rates with almost no global easing; in 2021, emergency rate cuts brought policy rates near zero globally; in 2025, rates stay high to maintain credibility on inflation control, but core countries like the U.S. and Europe plan small initial cuts by end-2025.
Quantitative Easing / Tightening (QE/QT)—In 2017, the Fed was reducing its balance sheet while other major central banks still bought bonds; from 2020 to 2021, record QE rolled out worldwide; by 2025, the policy stance reverses: the Fed continues QT, Japan’s central bank still buys bonds without limits, and China selectively injects liquidity.
In plain terms: QE is like giving the economy a “blood transfusion,” while QT is “slowly draining blood.”
You need to know when we’ll enter QE or QT phases—and where we currently stand in the liquidity cycle...
Mid-2025 Situation Dashboard:
-
Rate Cuts: Policy rates remain high; first cuts possible in Q4 2025 if progress continues.
-
QE/QT: QT is ongoing; no new QE yet, but early stimulus signals have appeared.
Key Signals to Watch:
Signal 1: Inflation Falls to 2% and Policymakers Declare Balanced Risks
-
Watch for: Explicit neutral language shift in statements from the Fed or ECB
-
Significance: Removes final rhetorical barrier to rate cuts
Signal 2: Pause in Quantitative Tightening (QT) (Set Cap at 0 or 100% Reinvestment)
-
Watch for: FOMC or ECB announces full reinvestment of maturing bonds
-
Significance: Shifts balance sheet reduction to neutral, boosting market liquidity buffers
Signal 3: 3-Month FRA-OIS Spread Exceeds 25 bps or Repo Rates Spike Suddenly
-
Watch for: 3-month FRA-OIS spread (Note: The difference between Forward Rate Agreement (FRA) and Overnight Index Swap (OIS) rates, a key indicator of credit and liquidity risk in financial markets.) or General Collateral (GC) repo rate jumps to around 25 bps
-
Significance: Signals dollar funding stress, often forcing central banks to provide liquidity support
Signal 4: PBoC Fully Cuts Reserve Requirement Ratio (RRR) by 25 Basis Points
-
Watch for: Nationwide RRR falls below 6.35%
-
Significance: Injects ¥400 billion in base money, often triggering the first domino in emerging market easing
In Summary…
We’re not yet in the surge phase.
Therefore, until many of these levers turn green, markets will continue experiencing volatile risk appetite swings and won’t truly enter a euphoric phase.
Join TechFlow official community to stay tuned
Telegram:https://t.me/TechFlowDaily
X (Twitter):https://x.com/TechFlowPost
X (Twitter) EN:https://x.com/BlockFlow_News