393% Annualized: In-Depth Analysis of Pendle YT Leveraged Points Strategy's True Returns and Risks
TechFlow Selected TechFlow Selected
393% Annualized: In-Depth Analysis of Pendle YT Leveraged Points Strategy's True Returns and Risks
Taking sUSDe as an example, this article introduces how to measure the returns and risks of YT leveraged points strategies.
Author: @Web3Mario
Summary: In the previous article, we explained the realization rate risk of leveraging AAVE's Pendle PT yield strategy. We received a lot of positive feedback from readers—thank you all for your support. As I've been researching market opportunities within the Pendle ecosystem recently, this week I'd like to continue sharing an observation about Pendle: the real yield and risks of the YT leveraged points strategy. Overall, taking Ethena as an example, the current potential return of the Pendle YT leveraged points strategy can reach 393%, but investors should still be aware of the associated investment risks.
Leveraging the Leverage Property of YT Assets to Gamble on Point’s Potential Yield
First, let’s briefly introduce this yield strategy. In fact, since early 2024, with LRT projects represented by Eigenlayer choosing point mechanisms to determine subsequent airdrop reward distributions, this strategy has attracted market attention. Users can leverage purchased Pendle YT assets to increase capital leverage, acquire more points, and thereby obtain larger shares when rewards are distributed.
The reason purchasing YT assets creates a leverage effect lies in Pendle’s mechanism. We know that Pendle uses synthetic assets to convert interest-bearing tokenized instruments into Principal Tokens (PT) and Yield Tokens (YT). One interest-bearing token can be split into one PT and one YT. The PT functions as a zero-coupon bond, which can be redeemed 1:1 for the underlying native asset upon maturity. Its fixed interest rate is determined jointly by the discount ratio of PT relative to the native asset in Pendle’s AMM-created secondary market and the remaining term. Meanwhile, YT represents the accumulated yield rights of a locked interest-bearing asset over its term. Holding a YT means owning the yield rights of a native asset over a future period.
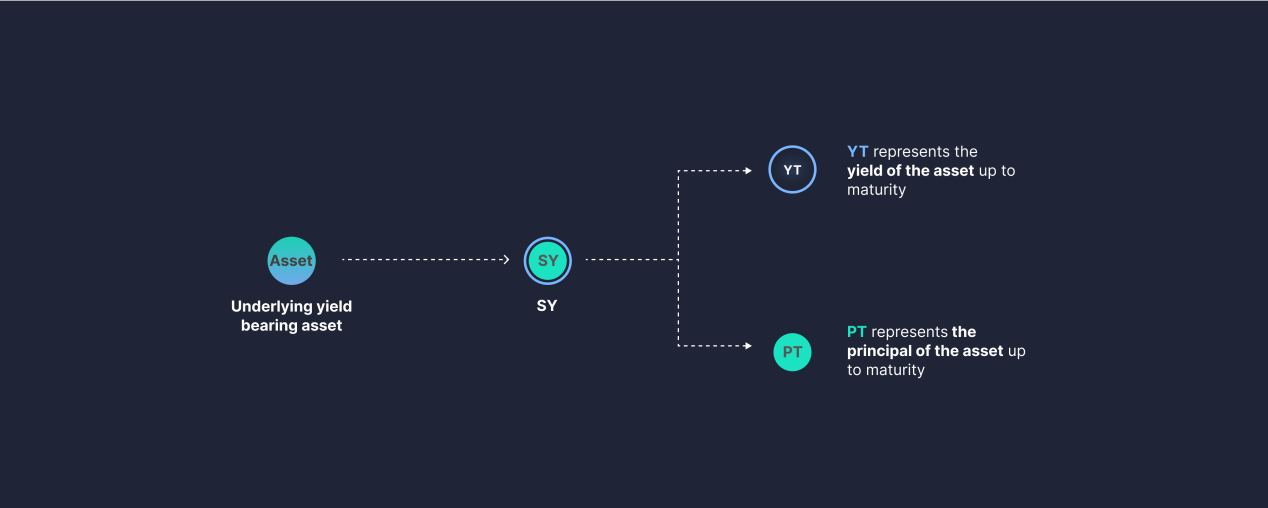
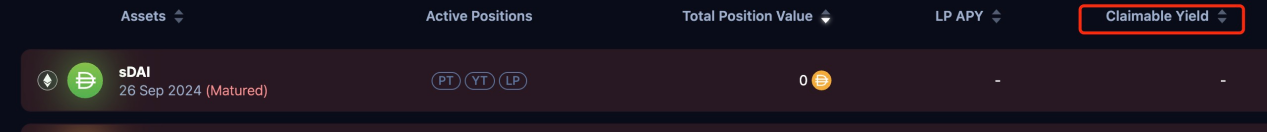
Since holding YT only grants yield rights without principal redemption capability (which is carried by PT), the residual value of YT decreases as the maturity date approaches, eventually reaching zero at expiration. This does not mean value erosion—rather, part of the value has already been realized as rewards distributed to YT holders. Therefore, after holding a YT for some time, you will notice two phenomena:
1. The value of your held YT keeps decreasing;
2. On the Pendle Dashboard page, you see some claimable rewards;
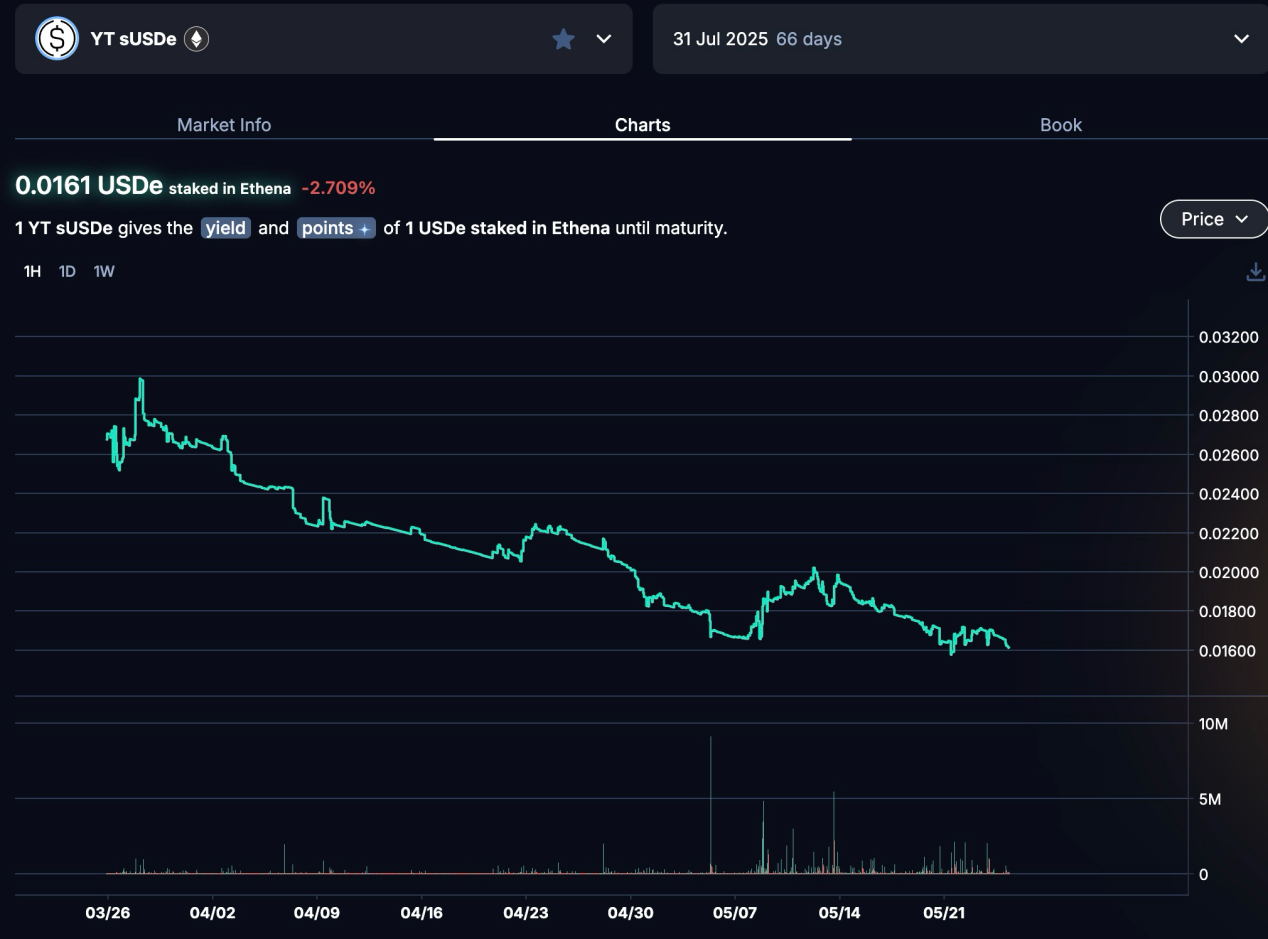
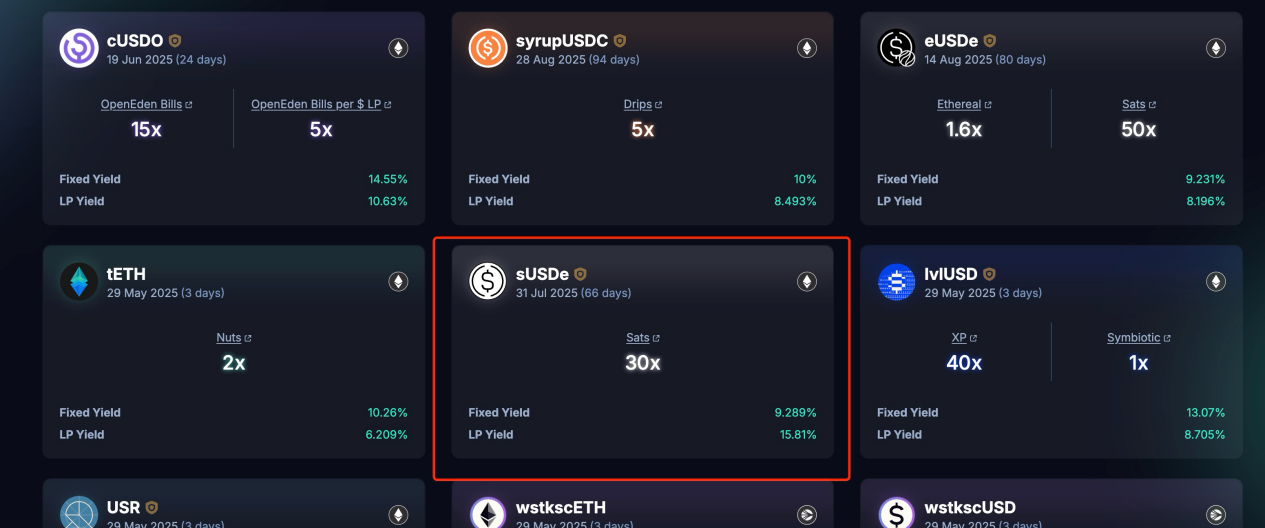
The capital leverage capability of YT arises precisely from this structure. Since YT only confers yield rights, its price is far below that of one unit of the interest-bearing asset. Thus, buying YT allows you to use a small amount of capital to control a much larger scale of interest-bearing assets to capture yield. Taking the above example of YT sUSDe Jul 25, the market price of YT is 0.0161 USDe. This means, ignoring trading slippage, if your capital is 1 USDe, you can purchase 62 YTs. That equates to gaining yield rights over 62 USDe over the next 66 days—this is the essence of financial leverage.
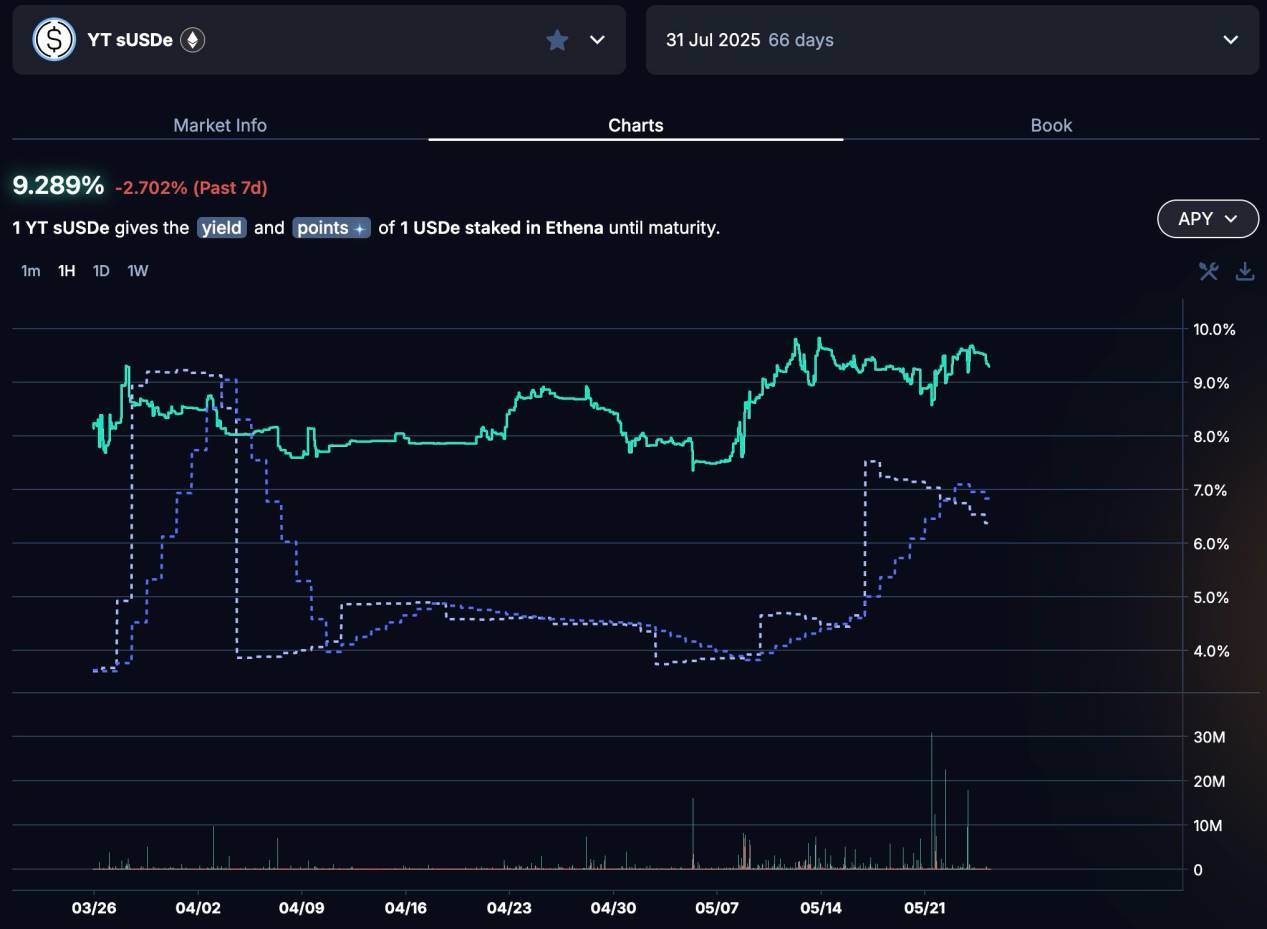
Of course, because there is no principal redemption right, this strategy only makes sense if future yield exceeds the initial investment in YT. Let’s do a simple calculation: as shown in the figure, the current official annual yield rate of sUSDe is around 7% (from funding fee distribution). Assuming the rate remains constant over the coming period, holding for 66 days would generate approximately 1.26% interest. However, the leverage from purchasing YT is only 62x. Doesn’t this imply that at expiry, the return would be just 62 * 1.26% ≈ 78%? This suggests investing in YT yields little or even results in a loss. From the chart, we can see that recently the implied yield and actual yield have converged. But before this, for most of the time, the spread was significant, meaning YT prices could have been even lower—indicating the strategy might have been unprofitable during those periods. This is why I chose not to focus on this strategy a year ago.
However, reality differs because our rough estimate above overlooks another source of return: Points. In fact, Points are the core motivation and primary source of excess returns for YT holders purchasing YT.
How to Quantify Expected Point Returns
On Pendle’s Point Market page, we can see that holding YT earns point rewards from certain projects. For example, holding 1 sUSDe YT currently earns 30 Sats points issued daily by Ethena. How effectively we quantify expected point returns determines the profitability of this strategy.
To correctly calculate potential point yield, understanding each project’s point distribution mechanism is crucial. Still using Ethena as an example: so far, Ethena has conducted three rounds of point campaigns and launched its fourth season on March 25, 2025, lasting six months, allocating no less than 3.5% of total ENA rewards. Ethena assigns different Sats point incentive speeds across various USDe usage scenarios, distributing points daily based on the fiat-denominated amount involved, multiplied by different “multipliers” depending on the participation scenario.
To calculate the potential yield of investing in YT to earn points, we need several key parameters: current total daily point generation, already distributed points, estimated airdrop ratio after season completion, and ENA price at distribution. Let’s run through a sample calculation:
1. First, we can use Ethena’s official API to retrieve the total number of points issued this season: https://app.ethena.fi/api/airdrop/stats. So far, a total of 10.1159 trillion Sats points have been distributed over a two-month period.
2. Next, record changes in total points every 24 hours to estimate how many more points may be generated in the remaining time, assuming the same release rate continues. Here, we assume the current daily issuance rate stays constant, i.e., an average of 168.6 billion new points per day.
3. Based on your position size, calculate the total points you could earn over the remaining period. Suppose you hold $10,000 worth of YT sUSDe assets, meaning you earn approximately 10,000 * 62 * 30 = 18.6 million points per day.
4. Combine the current ENA price of $0.359 with the projected total ENA reward of 3.5% post-season. Perform the following calculation:

In other words, assuming you buy YT now to participate in point farming, and all conditions remain unchanged over the coming period, you would earn an additional 415.8% APY from the point-based airdrop portion, totaling $13,861 in ENA rewards. After accounting for the -22% loss from sUSDe funding fee distributions, the net APY reaches 393%. Of course, staking ENA can boost this yield by 20%–100%, though we won’t elaborate on that here. Interested readers are welcome to discuss further with me.
How to Reduce Yield Volatility Risk
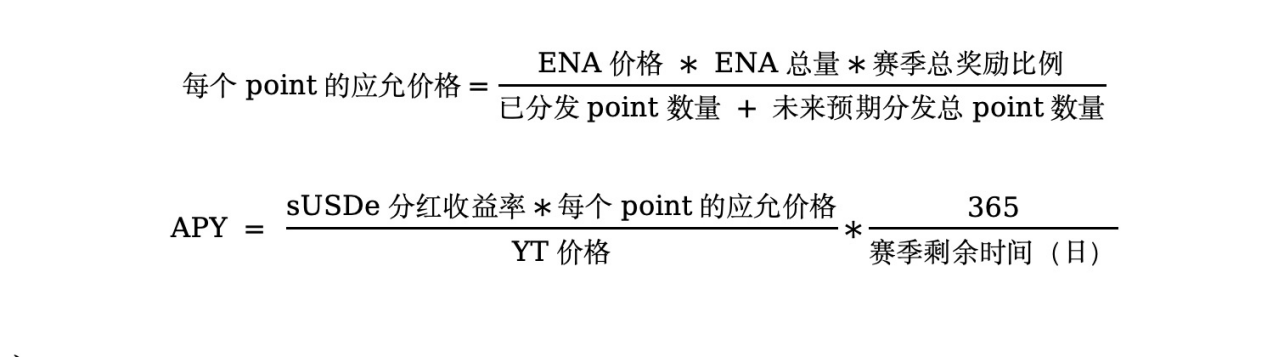
Next, let’s briefly analyze the risks of this strategy. As mentioned above, five main parameters affect yield: sUSDe dividend yield, YT sUSDe price, ENA price, the project’s planned total reward allocation ratio for the season, and daily new point count. We can express the impact of these parameters on total annualized yield using the following formula:
So how can we reduce the yield volatility risk of this strategy? We generally have three hedging strategies:
1. When ENA price is high, short ENA to lock in the expected ENA price at reward distribution, avoiding ENA price volatility. However, consider the margin required for shorting ENA and its impact on capital utilization, which affects overall yield.
2. On third-party Point OTC exchanges such as Whales Market, cash out part of the airdrop value of points early when point prices are favorable.
3. Regarding sUSDe funding fee yield, only partial hedging via shorting major assets like BTC or ETH is possible. We know that sUSDe funding rates tend to be higher during bull markets, as long positions are willing to pay higher fees. As market sentiment reverses, currently the only indirect way to hedge against falling funding rates is by shorting major assets. However, Pendle’s Boros product feature allows users to hedge rate risks directly, so this channel is also worth watching.
Conclusion
This article mainly used sUSDe as an example to illustrate how to evaluate the yield and risks of the YT leveraged points strategy. Readers can apply this methodology to other assets and are welcome to discuss further with me.
Join TechFlow official community to stay tuned
Telegram:https://t.me/TechFlowDaily
X (Twitter):https://x.com/TechFlowPost
X (Twitter) EN:https://x.com/BlockFlow_News