

Le fonds Ark Invest de « Cathie Wood » publie son modèle d'évaluation du bitcoin : un prix plancher de 500 000 dollars par unité en 2030
TechFlow SélectionTechFlow Sélection
Le fonds Ark Invest de « Cathie Wood » publie son modèle d'évaluation du bitcoin : un prix plancher de 500 000 dollars par unité en 2030
Ce modèle décompose la valeur du BTC en six grands secteurs, qu'il estime individuellement avant de les additionner (ce n'était donc pas une simple proclamation aveugle).
Source: David Puell, Analyst at Ark Invest;
Translator: CryptoLeo
Editor's Note:
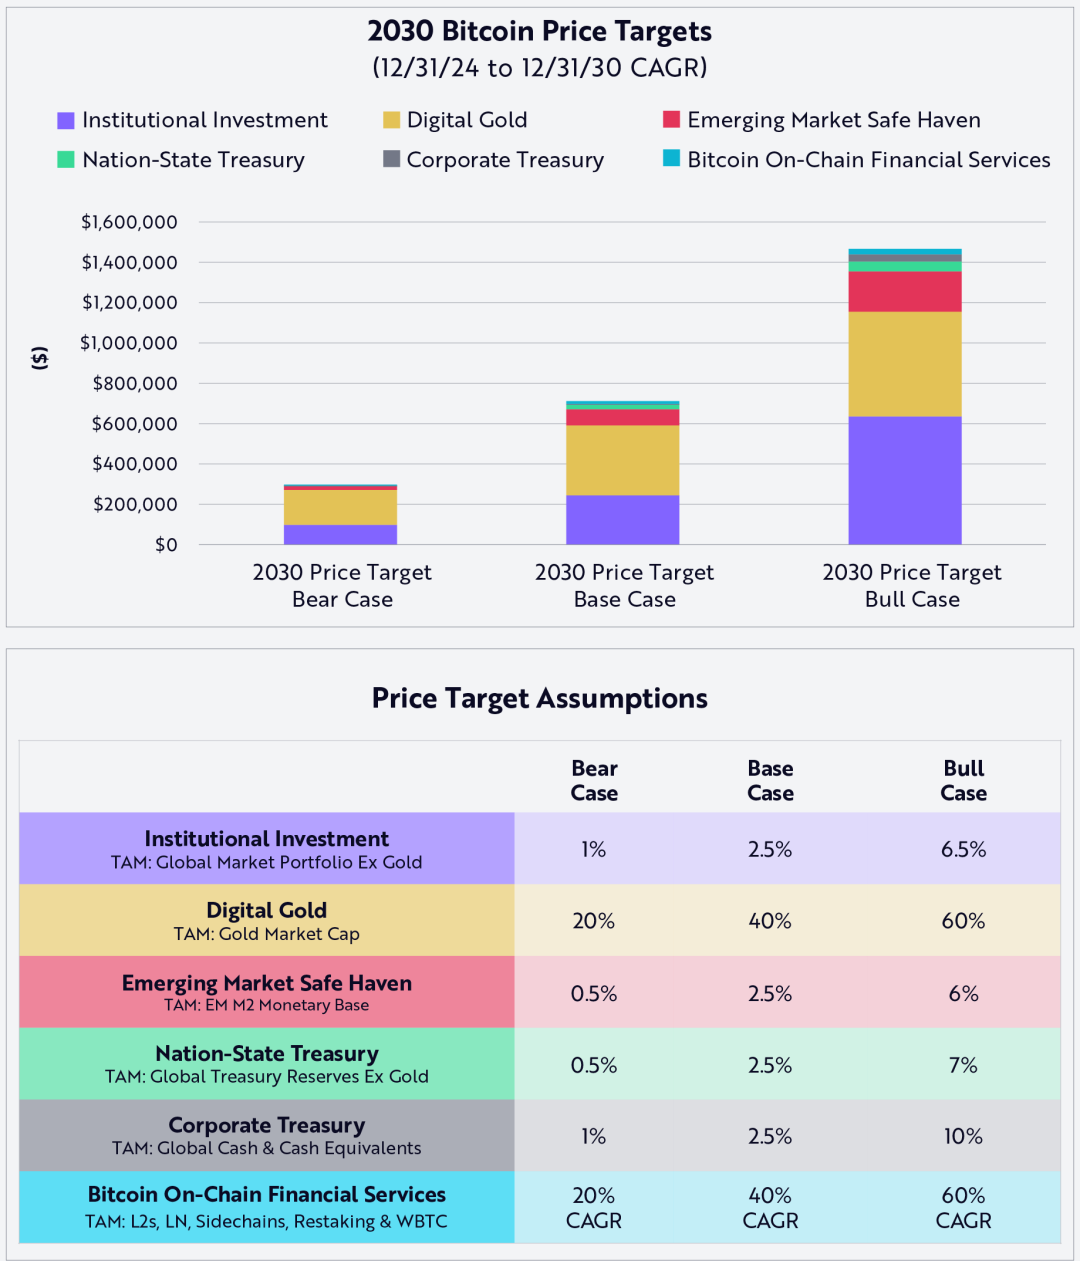
At the beginning of the year, Bitcoin maximalist and Cathie Wood’s Ark Invest released its Big Ideas 2025 report, outlining three potential price targets for Bitcoin by 2030: $300,000 (bear case), $710,000 (base case), and $1.5 million (bull case). At that time, these figures were seen as wildly optimistic projections—akin to Plan B’s bold forecasts—without any detailed methodology disclosed.
Two months later, Ark Invest finally unveiled the modeling framework and underlying assumptions behind its Bitcoin price targets for 2030. The model estimates Bitcoin’s value based on its Total Addressable Market (TAM) and adoption rate (penetration or market share), ultimately projecting its price in 2030.
Even more ambitious (or exaggerated) are the results from Ark Invest’s alternative calculation using a Bitcoin active supply metric, which yields even higher price projections for 2030: $500,000 (bear case), $1.2 million (base case), and $2.4 million (bull case). Should either TAM or adoption fall short of expectations, Bitcoin may fail to reach these levels. Thus, the model carries certain risks and biases. Below is the detailed breakdown of Bitcoin price forecasting, compiled and translated by Odaily Planet Daily.
Price Targets and Assumptions
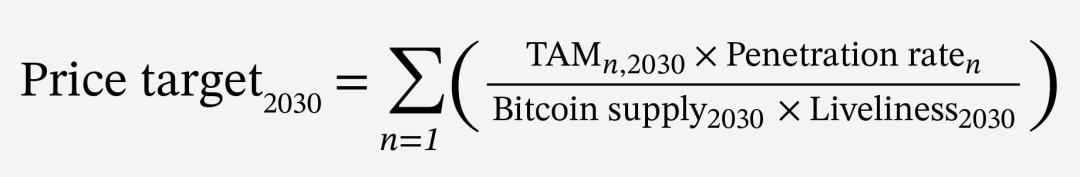
Our price targets represent the sum of contributions from the total addressable market (TAM) by end-2030, based on the following formula:
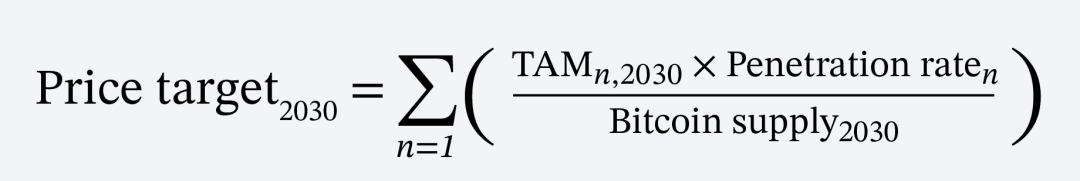
Odaily Planet Daily Note: This formula predicts Bitcoin’s 2030 price by quantifying the dynamic relationship between market demand and Bitcoin circulation. It multiplies each segment’s maximum dollar-denominated demand base (TAM) by Bitcoin’s penetration rate within that market, divides it by Bitcoin’s circulating supply, then sums up all segments (listed below) to arrive at the projected Bitcoin price in 2030.
We estimate Bitcoin’s circulating supply will approach approximately 205 million BTC mined by 2030. Each variable’s contribution to the price target is outlined below:
Primary contributors to capital accumulation (main drivers):
1. Institutional investment, primarily through spot ETFs;
2. Bitcoin being referred to as “digital gold,” offering a more flexible and transparent store of value compared to physical gold;
3. Investors in emerging markets seeking a safe haven to protect against inflation and currency devaluation.
Secondary contributors to capital accumulation:
4. National treasury reserves, with other countries following the U.S. example by establishing strategic Bitcoin reserves;
5. Corporate treasury reserves, as more companies diversify fiat cash holdings into Bitcoin;
6. On-chain financial services built on Bitcoin, serving as an alternative to traditional finance.
Excluding digital gold (since it represents Bitcoin’s most direct zero-sum competitor, we exclude it from our model), we conservatively assume that the TAM of the above contributors (specifically points 1, 3, 4, and 5) will grow at a compound annual growth rate (CAGR) of 3% over the next six years. For the sixth contributor—on-chain financial services on Bitcoin—we assume a 6-year CAGR between 20% and 60%, using cumulative value as of end-2024 as the baseline, as shown below:
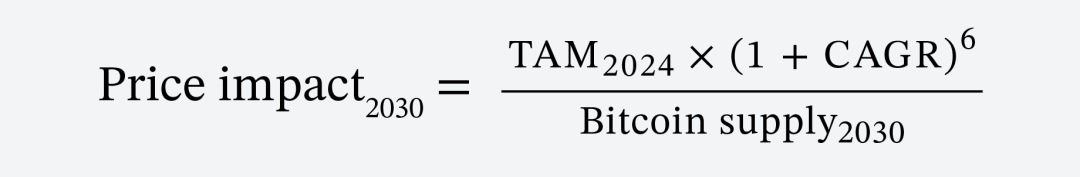
Odaily Planet Daily Note: This formula calculates Bitcoin’s TAM six years forward from 2024’s total value using annual CAGR, then divides by Bitcoin’s estimated circulating supply in 2030 to derive its price.
Finally, we break down how TAM and penetration rates contribute to bear, base, and bull case price targets respectively, as illustrated below:
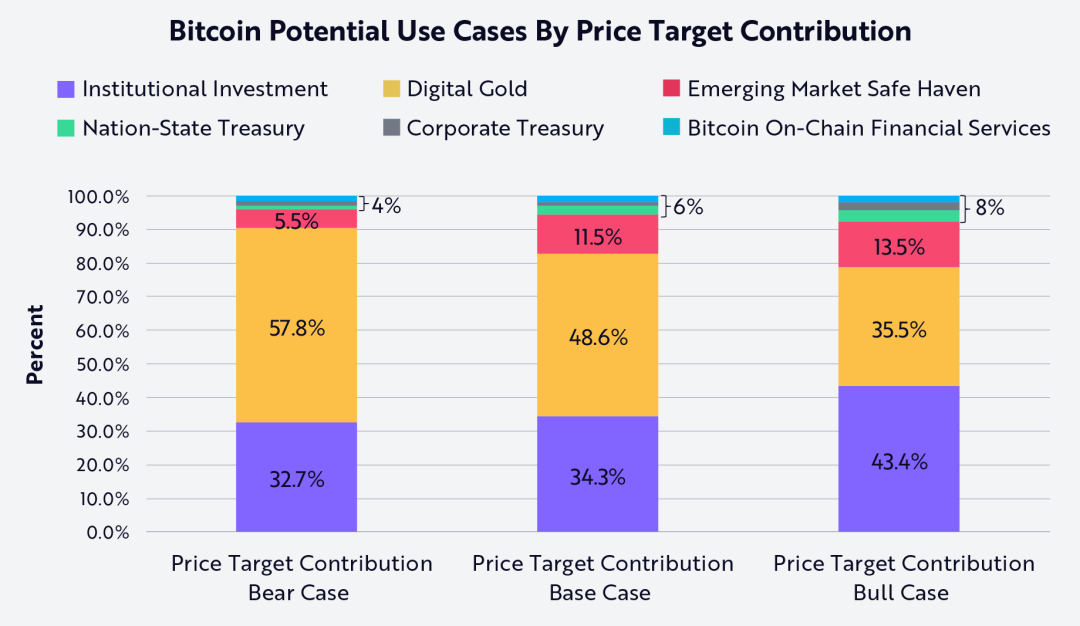
As shown above, “digital gold” contributes most significantly to our bear and base scenarios, while institutional investment drives the bull scenario. Interestingly, national treasuries, corporate treasuries, and Bitcoin on-chain financial services play relatively minor roles across all cases. In the table below, we detail the relative contribution of each of the six capital accumulation sources under bear, base, and bull market conditions:
Odaily Planet Daily Note: The following charts show the projected TAM for each market segment in 2030, Bitcoin’s penetration rate under three market scenarios, and the proportional contribution depicted in the chart above.
1. Potential Capital Accumulation Contributor: Institutional Investment
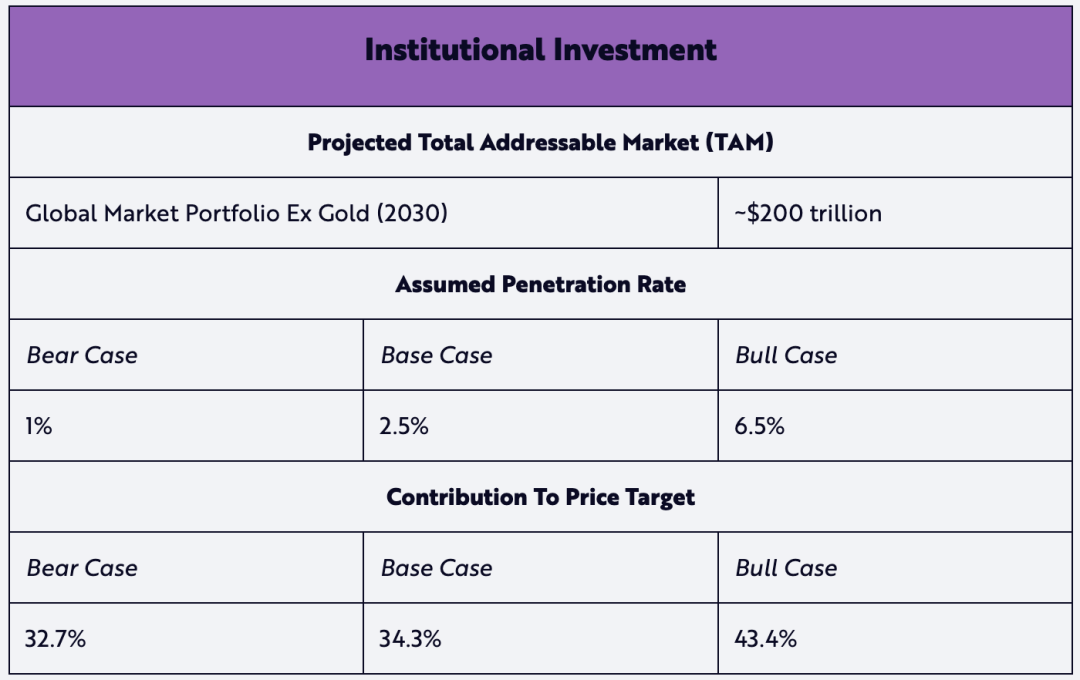
According to State Street, the global market portfolio is defined as follows:
The market capitalization of all investable capital assets divided by the sum of all asset valuations. As the collective outcome of decisions made by investors, issuers, capital suppliers, and demanders, the global market portfolio can be viewed as a practical representation of the entire set of investable opportunities available globally.
As of 2024, the TAM of the global investment portfolio stands at approximately $169 trillion (excluding gold’s 3.6% share). Assuming a 3% annual CAGR, this would reach about $200 trillion by 2030.
We assume penetration rates of 1% and 2.5% for bear and base cases respectively—both below gold’s current 3.6% share—reflecting conservative views on Bitcoin adoption. In the more aggressive bull case, we project Bitcoin’s penetration reaching 6.5%, nearly double gold’s current share.
2. Potential Capital Accumulation Contributor: Digital Gold
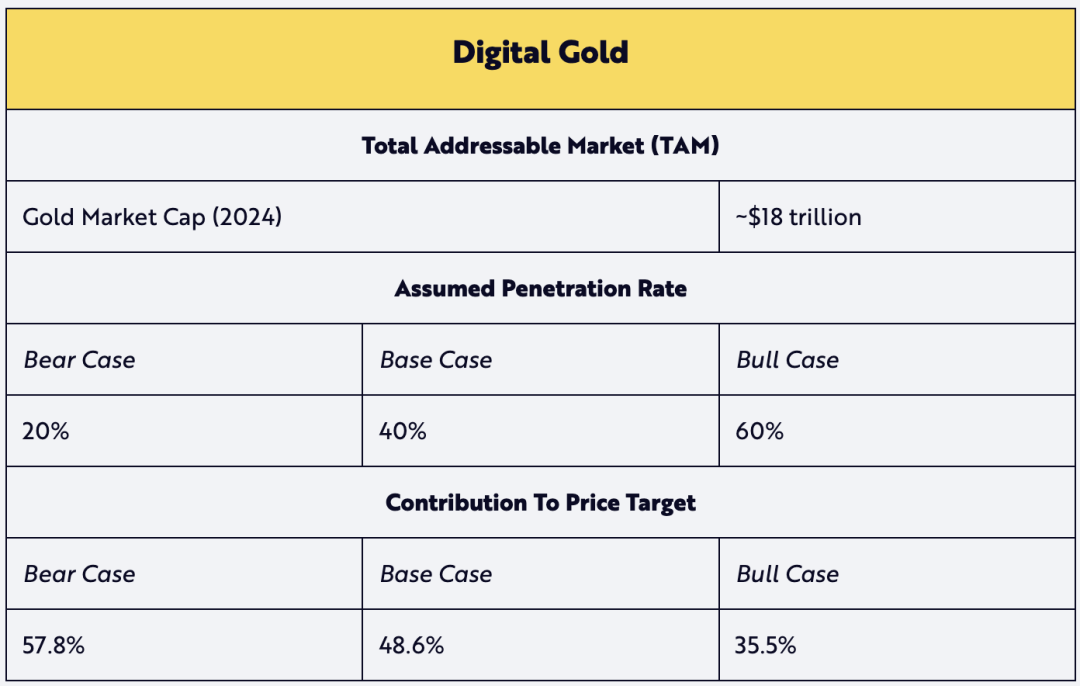
The digital gold contribution assumes a TAM ratio relative to gold’s current market value. Given favorable penetration assumptions, we assume gold’s expected TAM in 2030 remains flat, effectively reducing its projected value. We believe the narrative of Bitcoin as digital gold remains compelling and will drive increasing adoption.
3. Potential Capital Accumulation Contributor: Emerging Market Safe Haven
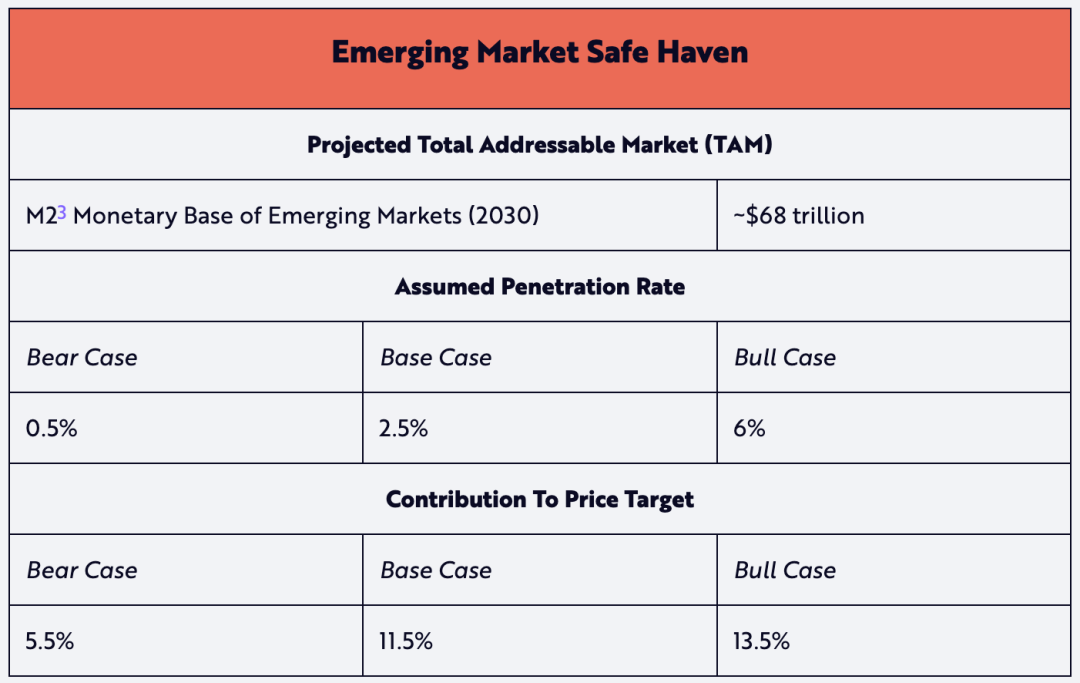
The TAM for the emerging market safe haven use case is based on the monetary base of all developing countries (defined by IMF/CIA, also known as "non-developed" economies). We believe this use case holds the greatest potential for capital appreciation. Beyond its store-of-value properties, Bitcoin’s low entry barrier offers internet-connected individuals an investment vehicle that could generate long-term capital gains—unlike defensive positions in currencies like the U.S. dollar—and thus preserve purchasing power while avoiding domestic currency depreciation.
Odaily Planet Daily Note: “M2” is a measure of U.S. money supply, including M1 (currency held by the public, deposits, checkable deposits, and traveler’s checks) plus savings deposits (including money market deposit accounts), small time deposits under $100,000, and retail money market mutual fund shares.
4. Potential Capital Accumulation Contributor: National Treasury Reserves
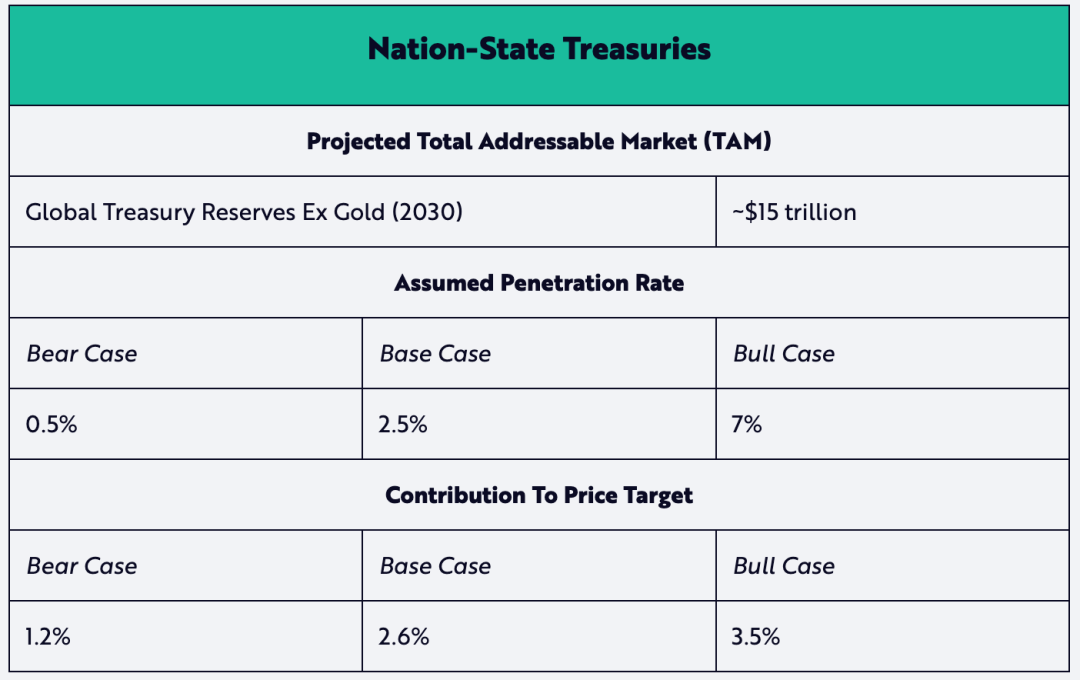
While El Salvador and Bhutan currently lead in national-level Bitcoin adoption, advocates for strategic Bitcoin reserves are growing—especially after Trump took office and issued an executive order on March 6 calling for the establishment of a U.S. BTC reserve. Although our bear and base case assumptions remain conservative, we believe developments in the U.S. could further validate our bull case assumption of 7% penetration.
5. Potential Capital Accumulation Contributor: Corporate Treasury Reserves
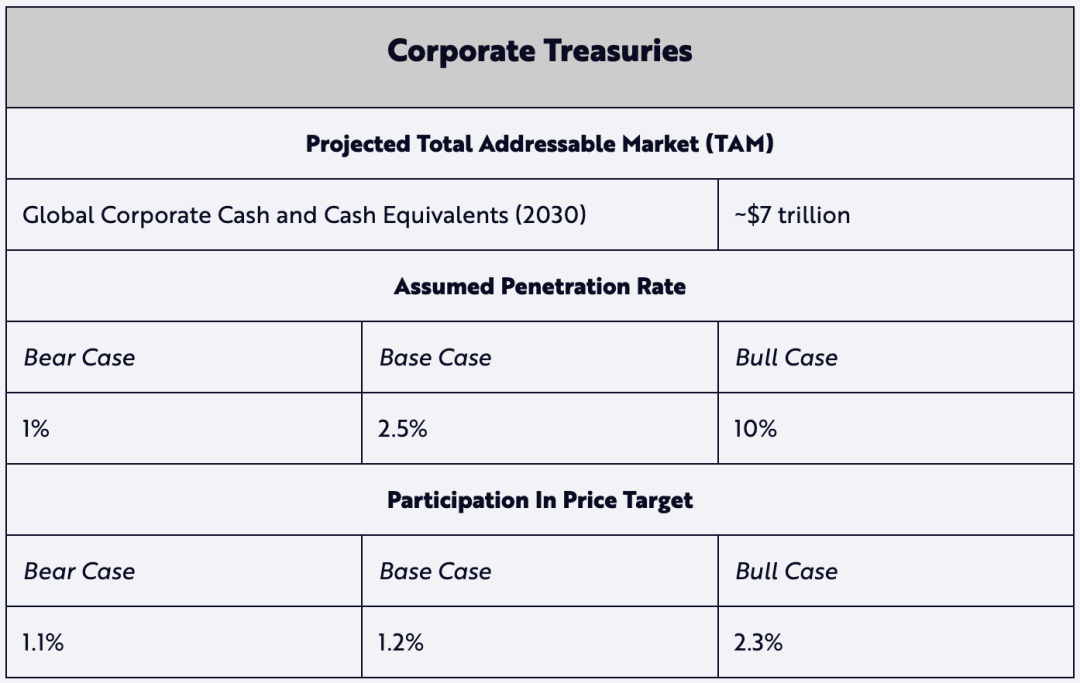
Inspired by MicroStrategy’s successful Bitcoin purchases since 2020, other corporations have begun adding Bitcoin to their corporate treasury reserves. As of end-2024, approximately 74 publicly listed companies held around $55 billion worth of Bitcoin on their balance sheets. If this corporate BTC strategy proves successful over the next six years, our conservative penetration assumptions in bear and base cases (1% and 2.5%) might eventually converge toward the 10% assumed in the bull case.
6. Potential Capital Accumulation Contributor: Bitcoin On-Chain Financial Services
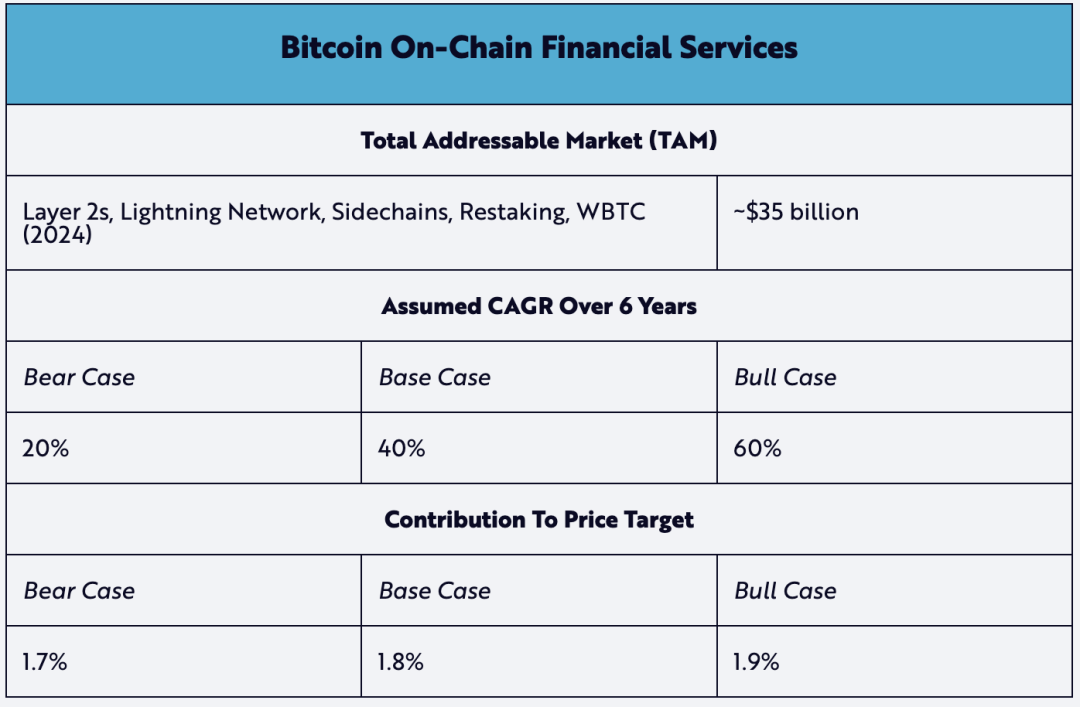
Native financial services on Bitcoin are emerging as new contributors to capital accumulation. Notable examples include Layer 2 solutions like the Lightning Network, which aim to scale Bitcoin’s transaction capacity, and Wrapped BTC (WBTC) on Ethereum, enabling Bitcoin to participate in decentralized finance. These on-chain financial services are becoming increasingly integral to the Bitcoin ecosystem. Therefore, we consider a 40% CAGR in the base case scenario from now to 2030 to be a realistic expectation.
ARK’s Assumptions Based on Active Bitcoin Supply
Although not included in ARK’s Big Ideas 2025 report, another experimental modeling approach estimates Bitcoin’s 2030 price by calculating lost or long-term held coins, leveraging Bitcoin’s on-chain transparency to estimate liquid supply—what we call “active” supply.
Under this method, active supply can be calculated by multiplying Bitcoin’s projected 2030 supply by an “activeness” metric measuring the degree of movement over time—from 0% to 100%—in other words, the true “float” of the asset, as illustrated below:
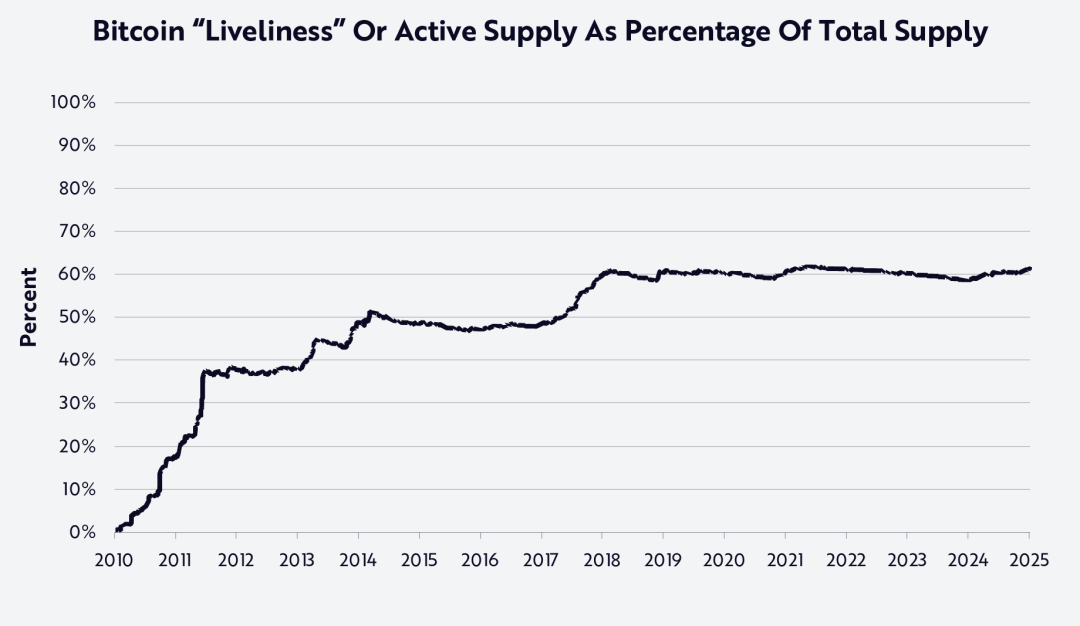
As shown, Bitcoin’s network activeness has remained around 60% since early 2018. We interpret this level of activity to mean roughly 40% of the supply is “vaulted” (i.e., stored and permanently removed from circulation, such as Satoshi Nakamoto’s wallet)—a concept explored in depth in ARK’s whitepaper Cointime Economics: A New Framework for On-Chain Bitcoin Analysis (https://www.ark-invest.com/white-papers/cointime-economics).
We then apply the same bear, base, and bull case TAM and penetration assumptions to a scenario where active supply reaches 60% by 2030 (assuming stable activeness over time), as shown below:
Based on this adjustment, we derive the following price targets—approximately 40% higher than our base model, which does not account for active supply or network activeness:
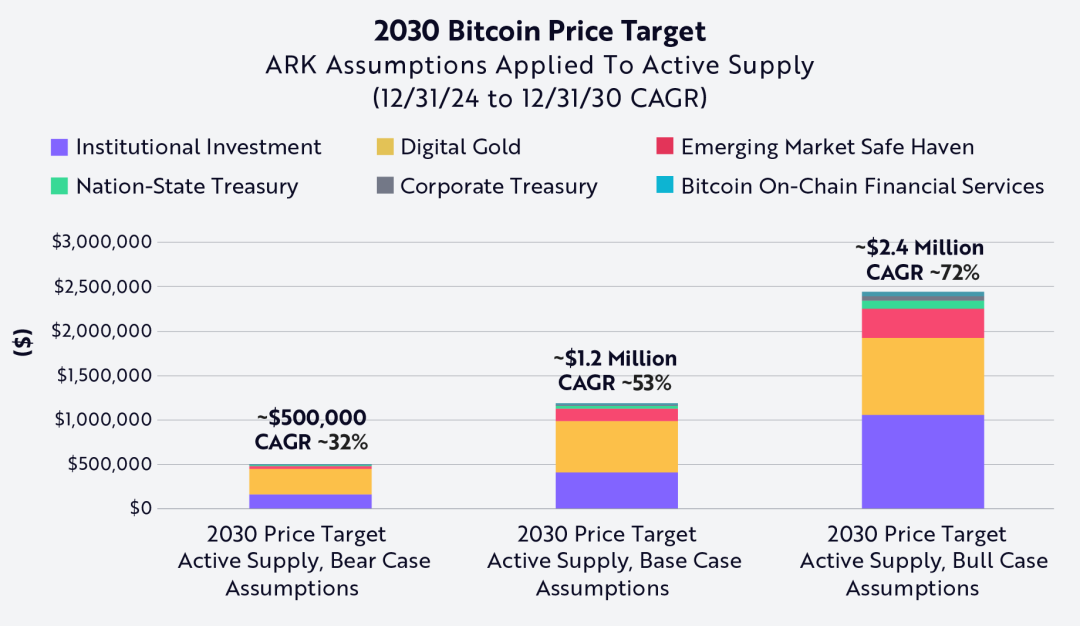
This model suggests revised Bitcoin price estimates for 2030 incorporating the active supply metric: $500,000 (bear), $1.2 million (base), and $2.4 million (bull).
Importantly, this more experimental valuation approach produces significantly more aggressive outcomes than our original bear, base, and bull case estimates. Since our official price targets lean conservative—focusing only on total Bitcoin supply—we do not formally adopt this method. Nevertheless, we believe this experimental framework highlights Bitcoin’s scarcity and the impact of permanently lost or vaulted supply—factors largely unaccounted for in most current valuation models.
Bonus Section
I briefly reviewed the Cointime Economics framework, which introduces a novel system for analyzing Bitcoin valuation and inflation dynamics. By measuring Bitcoin’s “liveliness” and “vaultedness,” it assesses economic states and supply activity on the network, distinguishing between active and dormant (unspent) supplies.
The framework also introduces a new unit of measurement called the “coinblock.” Coinblocks provide a fresh set of on-chain analytical metrics by multiplying the amount of Bitcoin by the duration it has been held. It defines three key concepts: “coinblock creation,” “coinblock destruction,” and “coinblock storage,” forming the basis for new economic indicators such as Bitcoin’s activeness and lock-up degree—offering deeper insights into market dynamics and economic behavior. Furthermore, case studies demonstrate the potential of Cointime Economics to improve valuation models, measure supply activity, and build new predictive frameworks. The coinblock concept and Cointime Economics may become central references for Bitcoin valuation in the future.
Bienvenue dans la communauté officielle TechFlow
Groupe Telegram :https://t.me/TechFlowDaily
Compte Twitter officiel :https://x.com/TechFlowPost
Compte Twitter anglais :https://x.com/BlockFlow_News


