Cobie: Interpretation of market cap, valuation, tokenomics, and unlocks
TechFlow Selected TechFlow Selected
Cobie: Interpretation of market cap, valuation, tokenomics, and unlocks
Compared to market cap, FDV is larger because "market cap" only accounts for tokens that are currently tradable (i.e., in circulation), ignoring certain unvested or locked tokens that have not yet been released or unlocked.
Author: Cobie, Uponly
Translation: TechFlow
This article covers some thoughts on market cap, valuation, tokenomics, and unlocks.
I’ve found that even many seasoned crypto Twitter participants still don’t know how to use certain metrics to make investment or trading decisions.
- The market capitalization of a crypto asset is the price multiplied by the current number of circulating coins or tokens.
- FDV stands for "Fully Diluted Valuation," another valuation metric. FDV is the price multiplied by the total number of coins or tokens that will ever exist (for that asset).
Market cap is always less than or equal to FDV.
FDV tends to be much larger than market cap because “market cap” only counts tokens currently available for buying and selling (i.e., circulating supply), ignoring locked tokens that have not yet been released or unlocked. These locked tokens often come from various sources—they could be team or investor tokens relevant over the next weeks to years, or tokens scheduled to be issued over mining programs spanning the next 100 years.
Market Cap = Demand, FDV = ??
You can think of “market cap” as the total public demand. It expands and contracts with price movements and shifts in demand—but essentially, market cap represents the total amount of public capital willing to buy the token at the current price.
Market cap measures public buying demand, whereas FDV is not a measure of demand at all. Instead, it’s a measure of supply.
As demand for unlocked tokens rises and market cap increases, FDV scales proportionally—even if there isn't necessarily rising demand for those locked tokens. Thus, even if these locked tokens might be sold satisfactorily at much lower prices, FDV increases 1:1 with market cap.
Illustrative Example
Imagine a scenario where a project raised $2.5 million in a funding round in January at a $50 million valuation, selling tokens to private investors at $0.01 each, but their tokens are locked for one year.
The project launches in February, and early users receive an airdrop in March. The project flies under the radar, discovered by only a few. Because it's relatively unknown, only $5 million worth of public capital wants exposure to this new token at any price. In March, the token reaches only a $5 million market cap.
However, the airdrop represents just 1% of total supply. With a $5 million market cap, FDV becomes $5 million * 100 = $500 million (since the $5 million market cap reflects 1%). The token price is now $0.10. Seed investors are up 10x.
Now imagine that by May, the project has become the biggest hype thing around. It’s listed on all major exchanges. Rumors swirl about integrations with Apple, Disney, Oprah Winfrey, and God.
YouTubers start making videos about it. Now significantly more public capital wants exposure to the token, so people go to Binance to buy it. Public capital allocated to the token has increased from $5 million to $100 million—an increase of 20x.
No new tokens have been unlocked, as team and seed tokens remain locked for one year. Market cap is now $100 million. Price is $4. FDV is now $20 billion. Seed investors are up 400x.
An increase in market demand of $95 million led to a "$20 billion" increase in “valuation.” The $2.5 million invested during the seed round now has a market value of $1 billion. The team’s tokens are now “worth” $4 billion.
Yet, seed investors holding locked tokens would happily sell anywhere near a $5 billion valuation, securing a 100x return. This means they’d still be happy sellers even if the price drops 75% after unlocking.
The team is willing to sell their tokens at any valuation above $1 billion to secure long-term funding. Even after their tokens unlock and the price drops 95%, they’ll still be happy sellers.
Bullish Unlocks?
So how can bullish unlocks actually happen if unlocks increase supply without increasing demand?
Well, locked tokens can actually have their own active market. Sophisticated and professional investors trade locked coins using trust and enforceable contracts as guarantees. Essentially, they buy or sell locked tokens at a discount to the market price and sign contractual obligations with counterparties to deliver these tokens upon unlocking. Sometimes, these locked coins may even have extended lock-up periods during OTC sales (especially if the team is the seller).
Imagine some initial seed investors sell their locked positions at a 10x profit to another VC, who then sells their position at 5x. Now the “unlocked” tokens have a cost basis much closer to the current market price, and some market participants expect holders’ profits to be only 100x. Since some investors anticipated the unlock event as bearish, but it turns out neutral, removing a bearish catalyst could result in a net bullish outcome.
If the OTC market for locked coins is very active, and “weak hands” have already sold to more confident investors, the unlock event may simply remove “fear.”
This is what happened with Solana—before its December 2020 unlock, SOL SAFTs were sold at 66–80% discounts. Holders of locked tokens were highly fearful that the unlock would cause price declines, while more confident buyers purchased large quantities of these locked tokens. When the unlock occurred, these professional investors exited at multiples of 3–4x, rather than much higher ones.
Without an OTC market and absent demand for locked tokens, the only way for locked investors to realize profits would be dumping them onto AMMs or Binance at unlock—events that could resemble a game of chicken among seed investors.
I can imagine that 90–95% of unlocks in 2022 were bearish.
How to Identify Bullish Unlocks
Typically, professional funds decide whether buying locked tokens at a discount or public market tokens offers a better risk-adjusted trade. Long-term investors usually try to enter at the lowest possible price, so they don’t mind buying locked tokens.
In practice, the main way to determine whether an unlock might be bullish is simply trying to participate in the OTC market (contacting locked buyers, bidding via OTC services, subscribing to OTC quote lists) and assessing “Is this project good?” A good proxy could be active users, TVL, or product-market fit.
If any token shows institutional interest, it’s likely that funds are attempting to buy locked tokens (if available).
Long-term investors also typically have more sophisticated valuation models, so think of them as “smart money.” They aim to buy at what they believe is the best valuation achievable over a 10-year horizon, so they might wait if they expect to buy at a lower price in a few years. They’re far less likely to buy into parabolic price surges like retail investors.
This means that as prices go parabolic, valuations for locked tokens and public market tokens diverge, since smart money is unlikely to buy at inflated valuations, and holders of locked tokens grow increasingly motivated to sell (and become happier with deeper discounts). In contrast, when the market grows organically and steadily over time, the cost basis of locked tokens is more likely to rise toward the public market valuation.
As bull markets generally progress into later stages, smart money takes on risk and favors liquidity, which may also be a factor—later-stage bull market unlocks are more likely to involve tokens that haven’t changed hands recently.
Unlock Progression
It’s also important to understand unlock schedules and estimate the current cost basis of OTC-traded tokens.
Bitcoin currently has a market cap of $97 billion and a fully diluted valuation of approximately $1.07 trillion. However, this additional $100 billion will be unlocked over the next 100 years as part of diminishing block rewards. If you were to chart Bitcoin’s “token supply” being “unlocked” historically through mining, it would look like this:
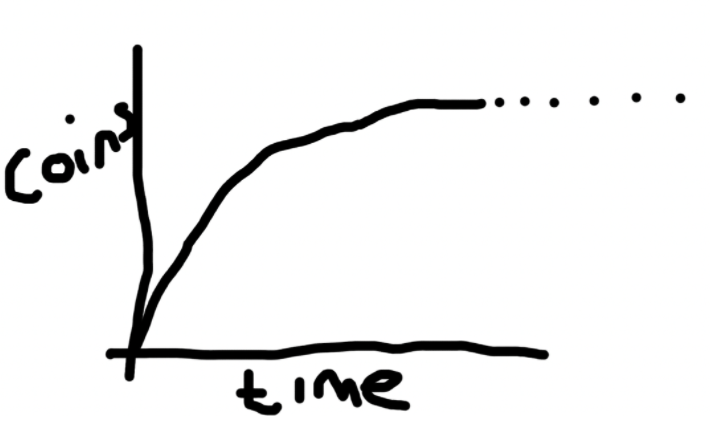
Bitcoin starts with zero supply, then adds 50 coins per block, with the reward halving roughly every four years. This process continues until all 21 million coins are mined by miners.
On the other hand, projects raising funds privately and issuing tokens to investors after lock-up and vesting periods may have a supply schedule like this:
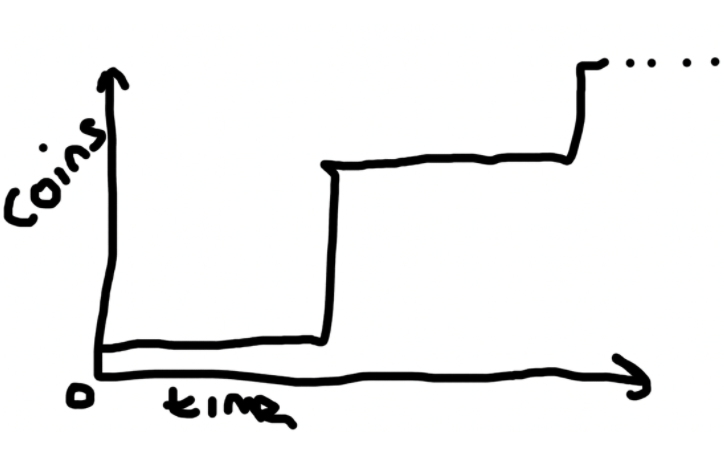
In this example, token supply starts at zero (perhaps they sell to the public or conduct an airdrop), then internal tokens unlock in large batches annually.
There are many other possible chart examples with different inflation timelines—I've only used the two extremes of the spectrum as illustrations.
The most common form of team or investor token vesting schedules I’ve seen is usually X years lock-up, Y years linear unlock, where 0.5
Why Does This Matter?
In your trading or investing process, being able to calculate any changes in supply and demand is crucial. If unlock timing is poor, small gems can quickly turn into large ones.
Conversely, coins with high FDV and upcoming catalysts may occasionally present good trades, because locked tokens might exit the market over time, and other traders might be scared off by high FDV.
Understanding market cap and FDV is important so you can compare them with similar projects. Trying to gather information or form a solid estimate of the cost basis of locked token holders is critical, as it helps identify whether there's additional bid-side demand from professional investors or a large pool of high-multiple holders eager to sell.
Every high-FDV project’s fully diluted valuation will eventually be unlocked, and people should consider the timing and impact of how and when that happens. Sometimes projects must perform exceptionally well to sustain and justify flat pricing.
Summary
Building crypto valuation models is difficult because the upside potential is extremely high, and the direct financialization of everything in a 24/7 liquid market is relatively new. Relative valuation can also be misleading due to anchoring effects.
Projects, investors, and founders appear incentivized to maximize their fully diluted market cap (and private wealth) by injecting as much public market capital as possible into as few circulating tokens as possible. By doing so, they generate massive paper gains for investors and teams.
Some projects drive price-agnostic demand through gating mechanisms (e.g., requiring specific resources to participate), common in GameFi and increasingly seen across crypto. Often in these projects, the gap between public valuation, private valuation, and real-world valuation is the widest.
If a project achieves a fully diluted valuation higher than some established big tech companies just one or two years after launch, it may be worth asking: Who holds this vast new wealth? At what price did they acquire it? And to whom will they ultimately sell it?
Join TechFlow official community to stay tuned
Telegram:https://t.me/TechFlowDaily
X (Twitter):https://x.com/TechFlowPost
X (Twitter) EN:https://x.com/BlockFlow_News