








Bloomberg Long-Form Report: Why the Bull Market Hasn't Ended Yet?
TechFlow Selected TechFlow Selected
Bloomberg Long-Form Report: Why the Bull Market Hasn't Ended Yet?
Ethereum is the main leader in the overall market performance, with an upward trend. The area around $2,000 serves as solid support, while a reasonable resistance level limiting further bullish movement is $4,000.
 Navigating Web3 tides with focused insights
Original Title: Bloomberg Crypto Outlook–Discounted and Refreshed
Report Author: Mike McGlone | Senior Commodity Strategist, Bloomberg Intelligence
Translation & Editing: Mary Liu
Executive Summary
-
Bitcoin: $20,000 or $100,000?
-
The U.S. wins the digital cold war
-
Crypto Top 3: Bitcoin, Ethereum, Tether
-
Bitcoin consolidating, strengthening, and becoming greener
-
Technical Analysis: A discounted Ethereum bull market
1. Bitcoin's Next Move: $20,000 or $100,000?
The trend remains upward.
We believe around $40,000 may be the upper limit of a rest period in the crypto bull market. Ethereum, the second-largest cryptocurrency, is rapidly approaching the top spot in market capitalization and has been the main driver behind the Bloomberg Galaxy Crypto Index (BGCI) in 2021. It’s more likely that Bitcoin will break resistance and rise toward $100,000 than fall below $20,000.
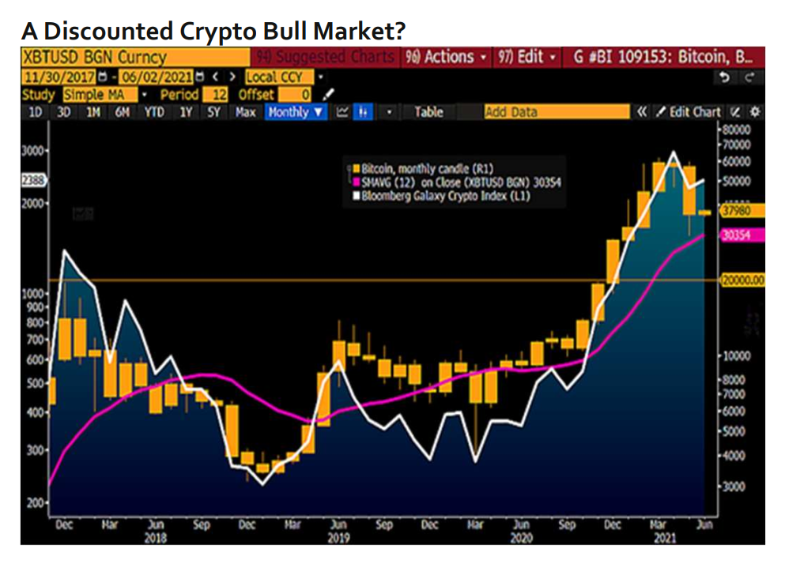
Bitcoin’s “nap time”: $30,000 to $40,000
As we see it, the Bloomberg Galaxy Crypto Index (BGCI) suggests the bull market restarting from June will begin with discounted Bitcoin prices.
Bitcoin has corrected about 50% from its 2021 highs and appears to be establishing a bottom support around $30,000—a level close to last year’s closing price and the 12-month moving average. The BGCI rose approximately 130% in 2021, down nearly 50% from its peak above 250% in early May. Much of the excessive speculation has been eliminated, while Bitcoin’s fundamentals remain intact.
Ethereum’s market cap is poised to surpass Bitcoin’s.
Diversification benefits should be emphasized, especially within an emerging asset class like cryptocurrency. The longer-term trend appears to be Ethereum gaining greater market share relative to Bitcoin. Both have bullish foundations, but Ethereum’s infrastructure and use cases strongly complement Bitcoin’s macro-focused role as a store of value. The chart below illustrates trading volume as a leading indicator for Ethereum’s growth—Ethereum has already reached 50% of Bitcoin’s market cap. From early 2021, ETH’s 10-day average trading volume doubled, reaching 80% of Bitcoin’s. (Coinmarketcap)
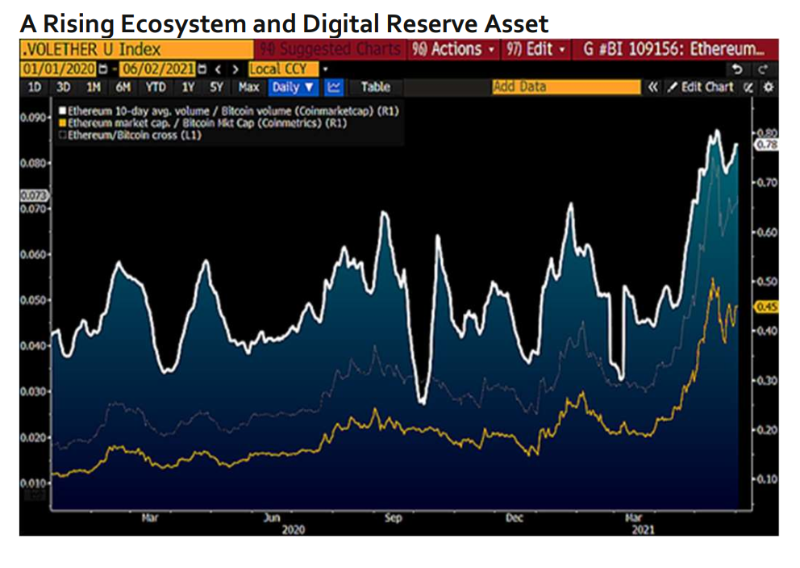
Bitcoin and Ethereum may have unique timing advantages. If economic principles apply, reduced supply combined with historically low interest rates and massive liquidity injections into the system form a solid foundation for appreciation in crypto asset prices. Adoption is still in its early stages, but it’s critical—and Bitcoin seems to be winning the race, as evidenced by Tesla allocating part of its equity wealth to digital assets.
The chart below shows Bitcoin’s annual mining supply declining below 1% by 2025, versus rapidly rising U.S. debt.
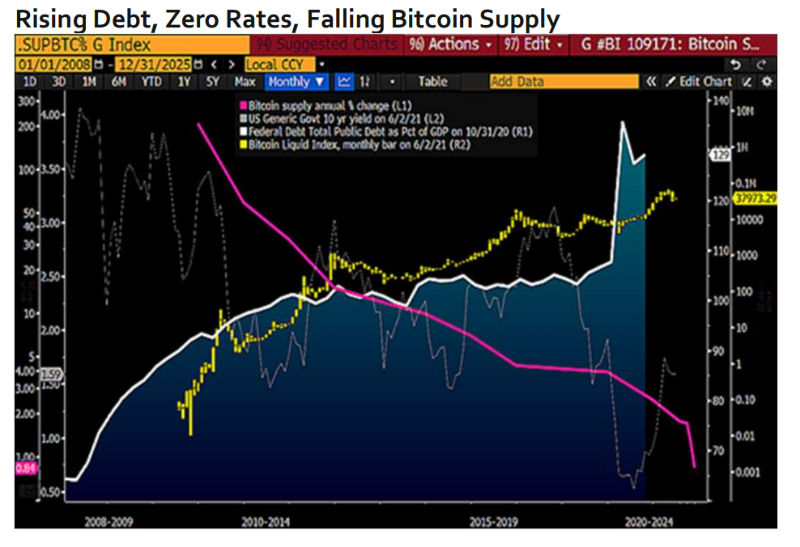
Typically, such a backdrop is ideal for pushing up gold’s dollar price, but old-world reserve assets are being replaced by digital newcomers. We see almost no force capable of stopping this trend, and expect it to accelerate.
The proliferation of 10,000 cryptocurrencies reinforces Ethereum’s foundational role. The ever-growing number of crypto assets listed on Coinmarketcap reflects strong tailwinds driven by Ethereum, their primary base layer.
The chart below depicts the milestone of 10,000 tradable cryptocurrencies, many built on the Ethereum blockchain. Compared to roughly half that number a year ago, the surge in crypto supply might suggest oversupply and excessive bubbles—but Ethereum remains at the top during this crypto gold rush.
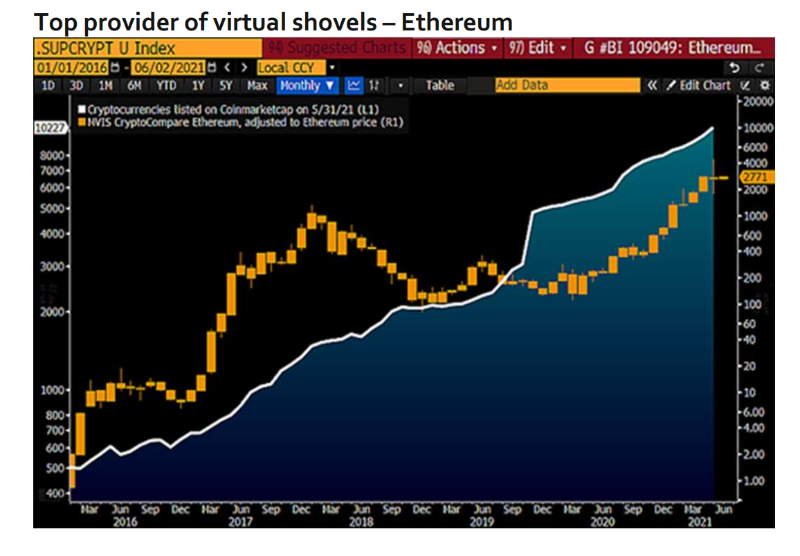
Currently, ETH appears relatively low on valuation metrics, but we view the number of tradable cryptos as a general gauge of overall market sentiment. Ethereum’s trading range in May—from slightly above $4,000 to just under $2,000—may set key support and resistance levels for some time, though the broader trend remains upward.
2. The U.S. Wins the Digital Cold War
The U.S.-China digital cold war resembles a Yankees victory—inevitable and dominant. In this new cold war, China suppresses Bitcoin’s open-source code and new monetary technologies, while we expect the U.S. to embrace them. With appropriate regulation, there's little chance of undermining the dollar’s dominance—as proven by Tether, the world’s most widely traded crypto asset. We believe the arrival of crypto ETFs is only a matter of time.
Currency digitization is here: the dollar reigns supreme. It is the organic adoption of digital assets, anchored by the U.S. dollar, that strengthens our bullish bias, particularly regarding crypto price appreciation. Despite rapidly rising U.S. debt-to-GDP ratios and quantitative easing, the trade-weighted broad dollar index has risen about 30% over the past decade, with the Chinese yuan being the highest-weighted currency in the index.
The chart below juxtaposes the relatively stable USD/CNY exchange rate with Tether’s parabolic rise in market capitalization.
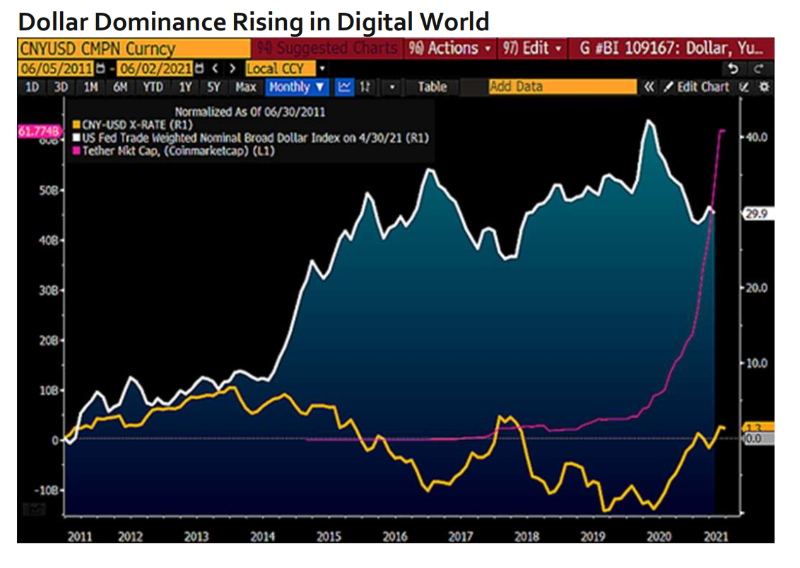
Despite the declining share of the U.S. in global GDP, Tether becoming the world’s most actively traded crypto asset signals clearly where things are headed—the U.S. dollar dominating the digital world.
A U.S. Bitcoin ETF is inevitable. As we see it, the U.S. is highly likely to adopt the technology and regulate crypto appropriately, thereby opening the door for Bitcoin exchange-traded funds in 2021. Crypto assets highlight the drawbacks of authoritarian, centrally planned economies like China’s—lack of free capital flow and public discourse. Given the existence of the Teucrium Wheat Fund (WEAT), the SEC’s continued opposition to futures-based Bitcoin ETPs makes little sense.
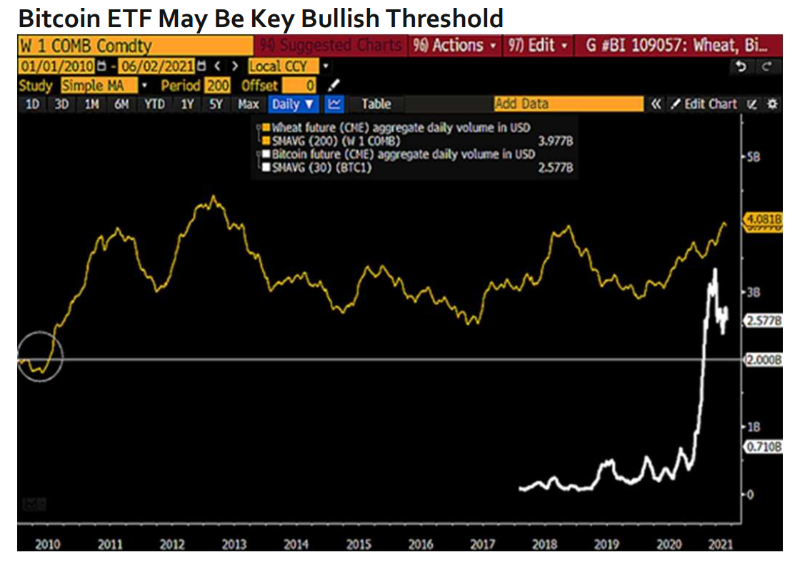
The chart shows the 30-day average trading volume of crypto futures at $2.6 billion, compared to wheat futures’ 200-day average consistently below $4 billion over roughly a decade. There is almost nothing preventing daily Bitcoin futures trading volume in dollar terms from exceeding that of wheat.
High Beta: Bitcoin’s advantage over equities?
When Bitcoin sharply declined on May 19, it proved its importance across nearly all global markets. As we see it, crypto’s outperformance relative to stocks is becoming increasingly evident. Rising stock markets should sustain high-beta Bitcoin gains, but if equities fall, further stimulus would strengthen the foundation for digital reserve assets.
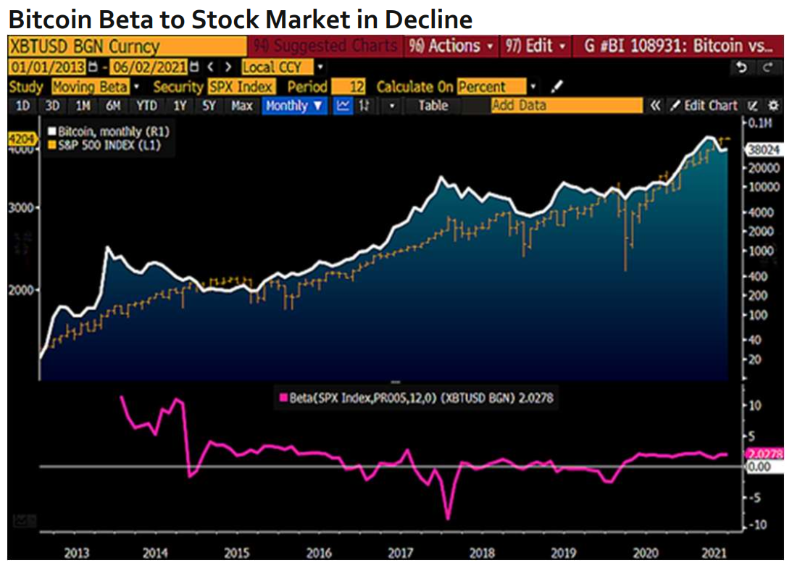
Most assets are increasingly dependent on rising stock prices for support, but Bitcoin may prove to be an exception. The chart depicts Bitcoin’s relatively high 12-month beta to equities at around 2x, down from a peak of nearly 16x in 2013.
3. Crypto Top 3: Bitcoin, Ethereum, Tether
Only when the tide goes out do you discover who’s swimming naked—and Bitcoin, Ethereum, and Tether are all fully dressed, shining brightly in the top three spots of the crypto market. Bitcoin is the digital reserve asset, Ethereum is the leading ecosystem builder, and Tether (an Ethereum-based token) represents a world rapidly digitizing under the umbrella of dollar dominance. Tether’s rise to third place by market cap is one of the most consistent trends in the digital asset space.
Bitcoin, Ethereum, Tether—the resilient survivors. Consistent strength and performance deserve respect, which is how we view the digitization of money represented by Tether. Despite controversies and regulatory crackdowns, the world’s benchmark dollar-pegged token has seen its market cap steadily climb—an ongoing signal of expansion within the digital asset ecosystem. The chart below shows the top three crypto assets on Coinmarketcap in early June: Bitcoin, Ethereum, and Tether.
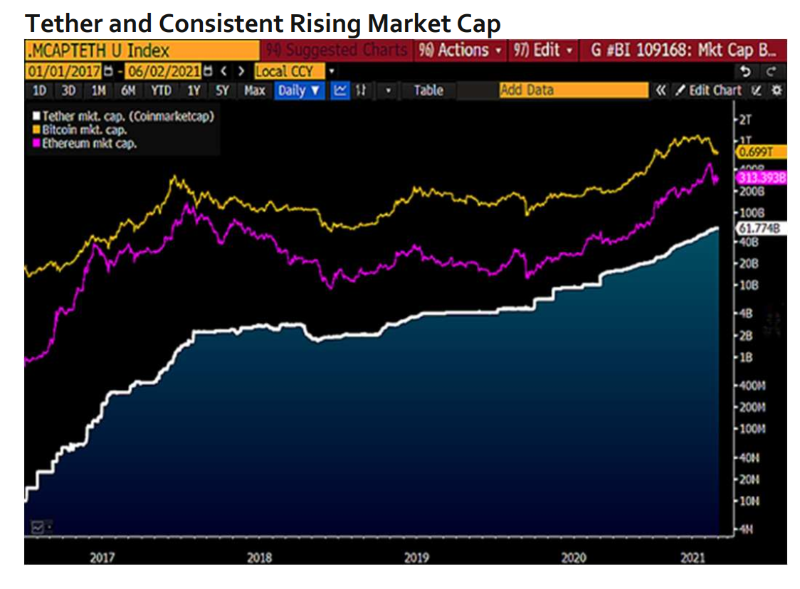
While most crypto assets declined, Tether gained significant ground in 2018, even as its market cap and trading volume continued to rise. Adoption of digital dollars is surging, with Ethereum-based dollar tokens entering the top 10.
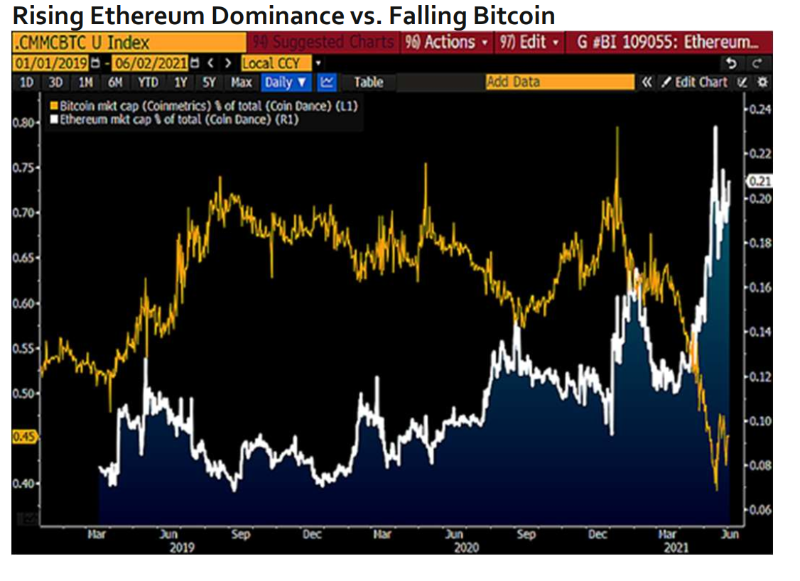
Tether and the wave of digitization. As we see it, Tether and the digitization of currencies—especially the U.S. dollar—reflect the upward trend in crypto assets. Tether’s market cap rose about 190% in 2021, Ethereum’s price surged 280%, and the Bloomberg Galaxy Crypto Index gained nearly 130%, largely due to Bitcoin’s relatively weak performance, which was close to 30%.
Ethereum’s rising dominance. In our view, Ethereum gaining dominance while Bitcoin lags represents a dichotomy within crypto—and a trend with staying power. Ethereum is a key building block for financial digitization, while Bitcoin primarily serves as a macro-level substitute for gold in portfolios. Few smart contracts or tokens can be built on Bitcoin, but it is evolving into a digital reserve asset. The chart below shows Ethereum’s market cap as a percentage of the total.
4. Bitcoin Consolidating, Strengthening, and Becoming Greener
What happened to Bitcoin? It’s becoming stronger, greener, and less volatile. In our view, Bitcoin’s recovery reflects the continuation of the bull market and an inevitable path toward $100,000. The market became overheated in April, and one major factor behind the correction—excessive energy use—actually demonstrates the strength of the world’s largest decentralized network. China’s crackdown inadvertently highlighted Bitcoin’s strengths and accelerated the shift toward renewable energy sources.
Bitcoin fundamentals remained solid in 2021. At the end of 2020, historical trends indicated that cryptocurrencies would surge significantly in 2021—and they did. Bitcoin rose about 35% by May 24, peaking near $65,000, but after dropping about 50% from its peak, it found multi-layered support below $30,000.
The chart below highlights a key fundamental aspect of Bitcoin in 2021: in 2020, its 260-day volatility fell to record lows compared to most major asset classes, especially the S&P 500. Combined with last year’s supply reduction, institutional portfolio allocations, Ethereum futures, and the launch of ETFs in Canada and Europe, we believe Bitcoin has a greater chance of advancing toward $100,000 than remaining below $20,000.
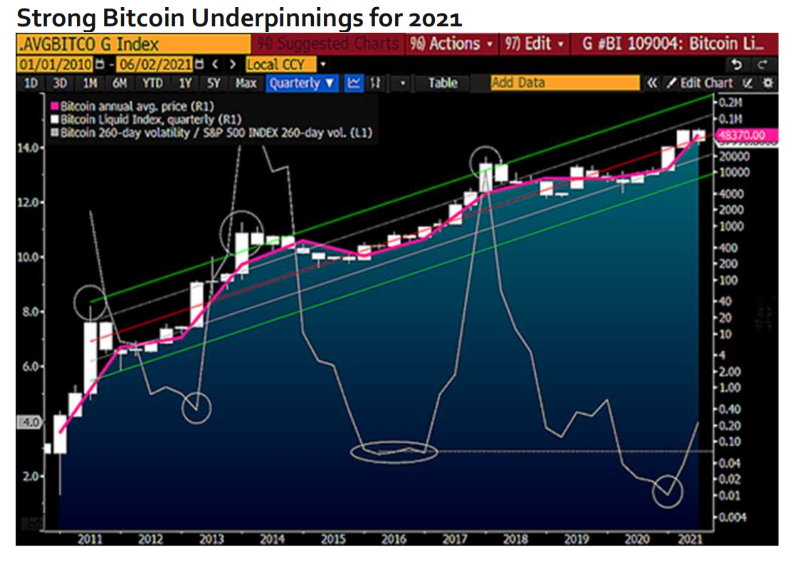
Reaching $100,000 in 2021 was well within reason. The chart below illustrates a potential path for cryptocurrencies toward a ~$100,000 resistance level. Similar to the massive rebounds in 2013 (55x) and 2017 (15x), the 2021 supply reduction occurred amid unprecedented global fiscal and monetary stimulus and growing institutional appetite for Bitcoin. Over the past decade, the likelihood of crypto becoming a digital reserve asset and sticking to its planned trajectory has steadily increased.
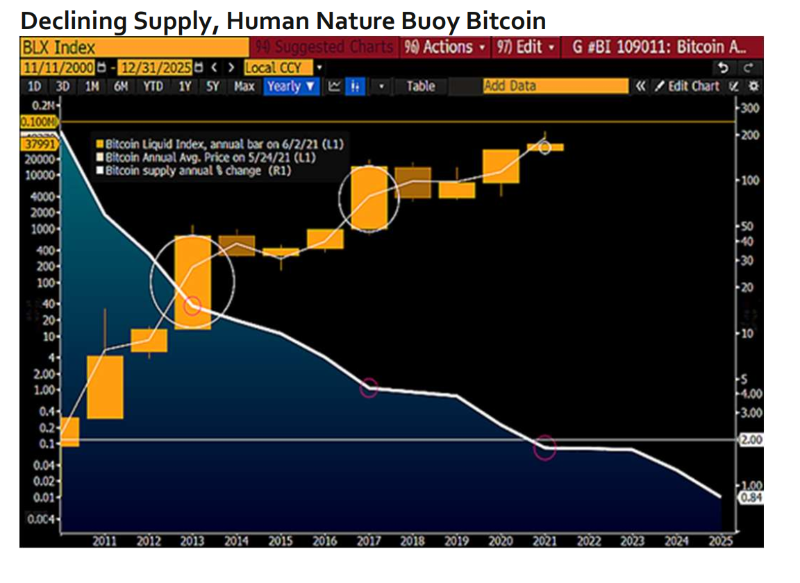
Another supporting point comes from growing recognition of a new asset class. Gold may be losing relevance, making diversification into alternatives a prudent move.
What could drive Bitcoin to $100,000? —Following Ethereum’s lead. If Bitcoin matches Ethereum’s 2021 performance, the top-ranked cryptocurrency could advance toward $100,000. The chart shows that by May 24, the Bloomberg Galaxy Crypto Index (BGCI) had risen about 110%, with Ethereum up 230%. By comparison, Bitcoin’s ~30% gain appears relatively flat. Acceleration, stagnation, or reversal are the three possibilities—we see roughly a two-thirds probability favoring: BGCI rising.
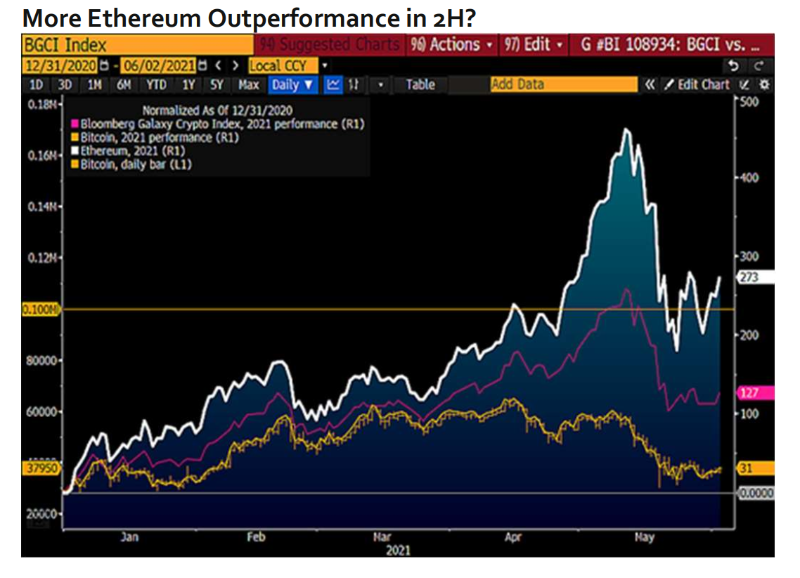
Ethereum may represent the next level of innovation, surpassing even tech-heavy Nasdaq. As the cornerstone of the crypto market and fintech, the second-largest cryptocurrency is becoming increasingly prominent. With declining Ethereum supply and a transition to the less energy-intensive proof-of-stake mechanism, its foundation is solidifying.
5. Technical Analysis: A Discounted Ethereum Bull Market
Ethereum is the preferred platform for cryptocurrency and decentralized finance, and our analysis indicates Ethereum is currently undervalued within a sustained bull market. Resembling Bitcoin in 2017, slightly lagging the broader market, Ethereum has shed excessive speculation and should consolidate between $2,000 and $4,000 for some time.
$2,000–$4,000 may be Ethereum’s sweet spot. Compared to Bitcoin, which aims for six-figure prices as a global digital reserve asset, Ethereum offers pricing advantages. Ethereum briefly surpassed $4,000 in mid-May but corrected about 60% to around $2,800 by May 26—now appearing as a discounted bull market. The chart shows ETH returning to an optimistic trajectory, mirroring Bitcoin’s 2017 price pattern. Like Ethereum at the start of this year, Bitcoin began 2017 around $1,000 and peaked just under $20,000. Ethereum may remain in the $2,000–$4,000 range through October, following a similar upward path to Bitcoin in 2017.
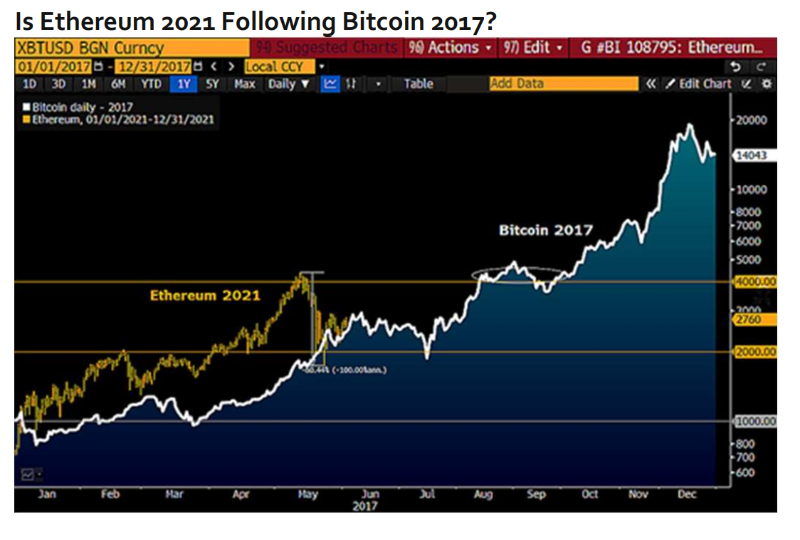
Discounted bull market: Ethereum dips to $2,000. Relative to the broader crypto market, ETH’s price suggests it may remain range-bound for a period. The chart shows the ratio of ETH to the MVIS CryptoCompare Digital Assets 100 Index, now slightly below its 2017 peak. That year, Ethereum hit $350 in June, corrected about 60%, then rebounded to new highs by November. We see parallels: ETH has retraced 60% to just under $2,000 and now appears discounted within a bull market.
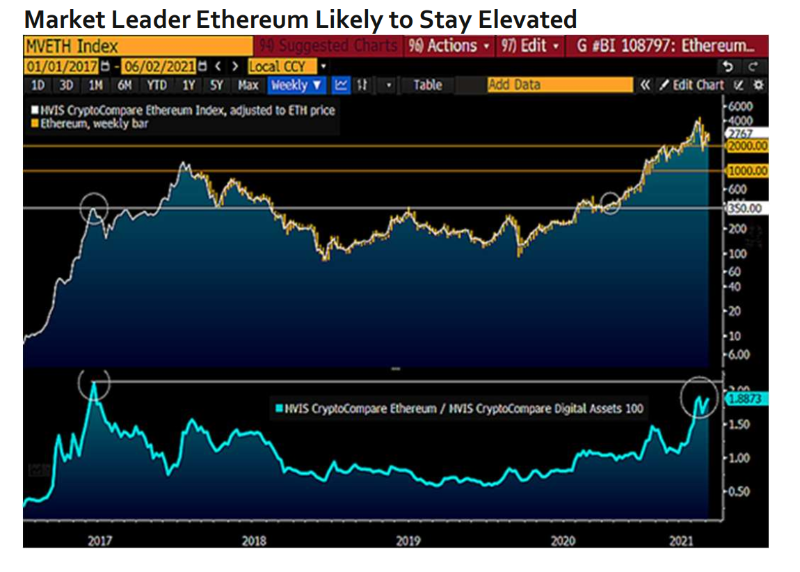
Ethereum is the primary performance leader of the broader market, with an overall upward trend. Around $2,000 is solid support, while $4,000 represents a reasonable resistance level limiting further bullish momentum.
Join TechFlow official community to stay tuned
Telegram:https://t.me/TechFlowDaily
X (Twitter):https://x.com/TechFlowPost
X (Twitter) EN:https://x.com/BlockFlow_News






