The Key to Bull and Bear Transitions: The Second S-Curve Growth
TechFlow Selected TechFlow Selected
The Key to Bull and Bear Transitions: The Second S-Curve Growth
The second S-shaped growth curve is the result of normalizing the structure of finance through yield, labor, and credibility under real-world constraints.
Written by: arndxt
Translated by: AididiaoJP, Foresight News
Liquidity expansion remains the dominant macro narrative.
Recession signals are lagging; structural inflation is sticky.
Policy rates are above neutral but below restrictive thresholds.
The market is pricing in a soft landing, but the real adjustment is institutional: from cheap liquidity to disciplined productivity.
The second curve is not cyclical.
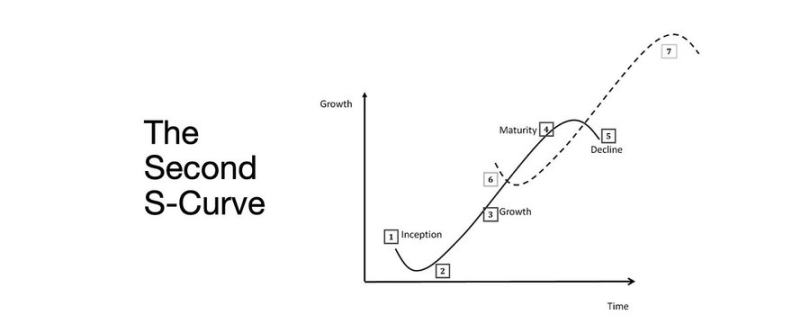
It is the structural normalization of finance through yield, labor, and credibility under real constraints.
Cycle Transition
Token2049 Singapore marks a turning point from speculative expansion toward structural integration.
The market is repricing risk, shifting from narrative-driven liquidity to revenue-supported yield data.
Key shifts:
-
Perpetual decentralized exchanges maintain dominance; Hyperliquid secures network-scale liquidity.
-
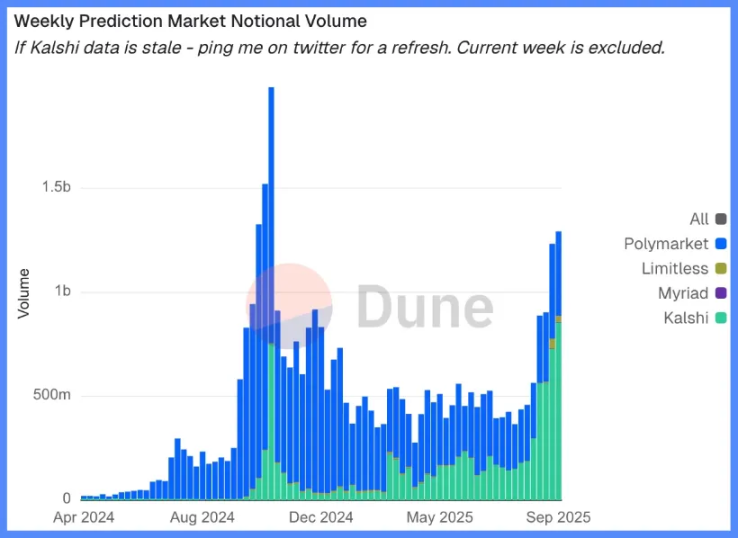
Prediction markets are emerging as functional derivatives for information flows.
-
AI-related protocols with real Web2 use cases are quietly growing revenues.
-
Restaking and DAT have peaked; liquidity fragmentation is evident.
Macro Institutions: Currency Depreciation, Demographics, Liquidity
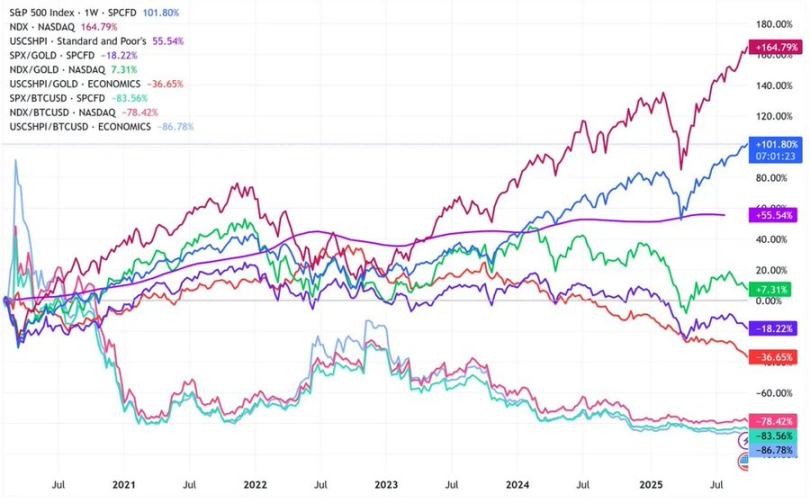
Asset inflation reflects currency depreciation, not organic growth.
When liquidity expands, duration assets outperform the broader market.
When liquidity contracts, leverage and valuations get compressed.
Three structural drivers:
-
Currency depreciation: Sustained balance sheet expansion is required to service sovereign debt.
-
Demographics: Aging populations reduce productivity and deepen reliance on liquidity.
-
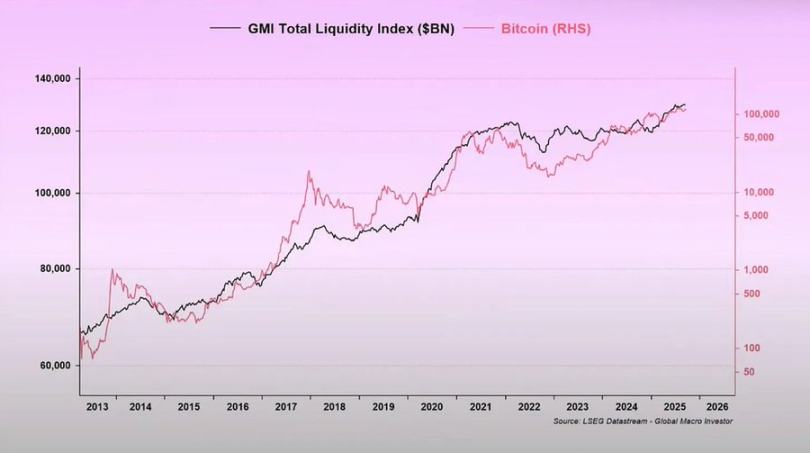
Liquidity channels: Global aggregate liquidity—sum of central bank and banking system reserves—has tracked 90% of risk asset performance since 2009.
Recession Risk: Lagging Data, Leading Signals
Mainstream recession indicators are lagging.
CPI, unemployment rate, and the Sahm Rule confirm downturns only after they begin.
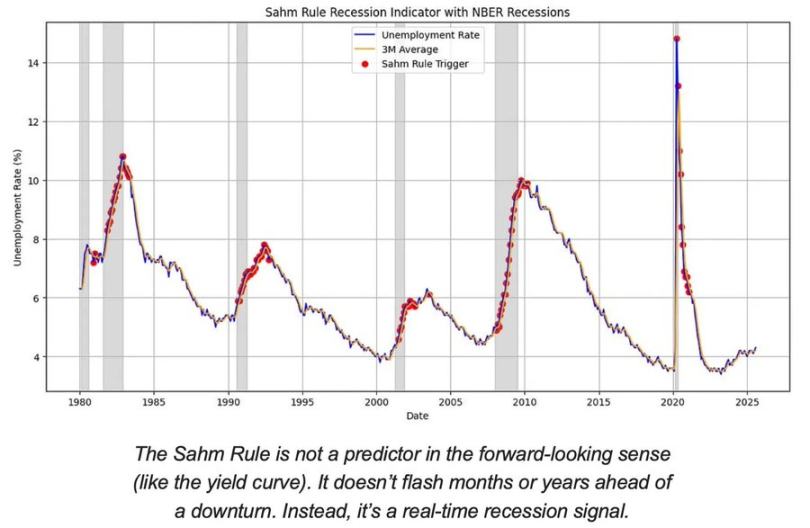
The U.S. is in the late stage of the economic cycle, not in recession.
Soft landing remains more likely than hard landing, but policy timing is the constraint.
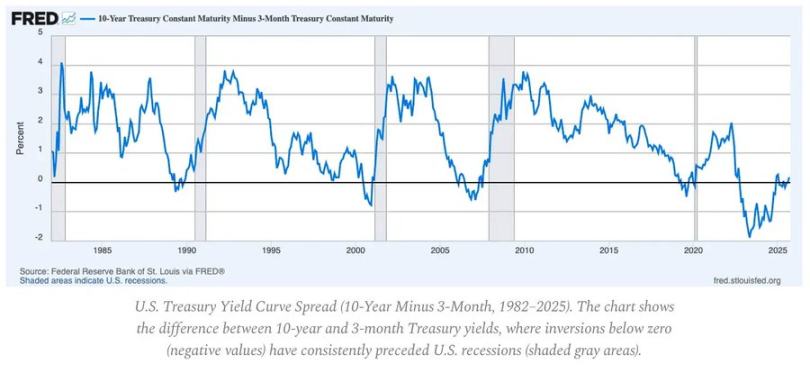
Leading indicators:
-
Yield curve inversion remains the clearest leading signal.
-
Credit spreads are contained, indicating no imminent systemic stress.
-
Labor market is gradually cooling; employment remains tight within the cycle.
Inflation Dynamics: The Last Mile Problem
Goods disinflation is complete; service inflation and wage stickiness now anchor overall CPI near 3%.
This "last mile" is the most complex phase of disinflation since the 1980s.
-
Goods deflation now offsets part of CPI pressures.
-
Wage growth near 4% keeps service inflation elevated.
-
Housing inflation lags in measurement; actual market rents have cooled.
Policy implications:
-
The Fed faces a trade-off between credibility and growth.
-
Early rate cuts risk reigniting inflation; holding too long risks overtightening.
-
The equilibrium outcome is a new inflation floor near 3%, not 2%.
Macro Structure
Three long-term inflation anchors remain:
-
De-globalization: Supply chain diversification increases transition costs.
-
Energy transition: Capital-intensive decarbonization raises short-term input costs.
-
Demographics: Structural labor shortages create persistent wage rigidity.
These constrain the Fed’s ability to normalize policy without higher nominal growth or higher equilibrium inflation.
Join TechFlow official community to stay tuned
Telegram:https://t.me/TechFlowDaily
X (Twitter):https://x.com/TechFlowPost
X (Twitter) EN:https://x.com/BlockFlow_News