Most comprehensive data analysis: BTC falls below the key $100,000 level—has the bull market really ended?
TechFlow Selected TechFlow Selected
Most comprehensive data analysis: BTC falls below the key $100,000 level—has the bull market really ended?
Even if Bitcoin is currently in a bear market, this bear market may not last long.
Compiled & Translated: TechFlow

Podcast Source: 10x Research
Original Title: A Deep Dive into Bitcoin Bear Market On Chain and Market Indicators
Broadcast Date: November 13, 2025
Key Takeaways
About 10x Research
-
Predicted Bitcoin's bottom in October 2022 and forecasted a rise to $63,160 by March 2024 ahead of the halving (halving timing adjusted to April, final price reached $63,491).
-
In January 2023, we predicted Bitcoin would rise to $45,000 before Christmas, which was realized (final price at $43,613).
-
In September 2023, we highlighted that Bitcoin mining companies would be a key investment theme for 2024. More recently, in November 2023, we predicted Bitcoin would rise to $57,000 after ETF approval.
-
Predicted Bitcoin would reach $70,000 in January 2024, followed by a pullback near the March 2024 peak.
In this podcast, 10x Research delivers a deep analytical dive into Bitcoin’s bear market:
What are on-chain data and market signals telling us? Has Bitcoin already entered a bear market? How should traders respond now?
Over the past three weeks, particularly since our October 22 report, we have repeatedly emphasized several key signals. The sharp drop on October 10, subsequent abnormal investor behavior, and Fed Chair Powell’s uncertain stance on December rate cuts are not isolated events—they reflect a shared macroeconomic backdrop.
With the SEC approving Bitcoin ETFs, regulation is no longer a major bull market obstacle. The real reason driving the bull market stall is weakening capital inflows—when profit-taking exceeds new demand, upward momentum fades.
This episode analyzes charts, capital flows, and various data points to help you determine whether Bitcoin is currently in a bull or bear market. Even if Bitcoin is indeed in a bear market now, this downturn may not last long.
Highlights & Key Insights
-
When Bitcoin price falls below the 21-week EMA, the market enters a minor bear market.
-
If Bitcoin drops below the $110,000–$112,000 range, we maintain a bearish outlook; a breakout above this range could turn us bullish.
-
Long-term holders have sold 185,000 BTC over the past 30 days, totaling approximately $20 billion. Long-term holders appear to believe further downside lies ahead, prompting them to exit.
-
On-chain data also suggests a deeper market correction. The market appears to have entered a bear phase dominated by selling pressure. This sell-off may take multiple forms and persist longer.
-
We anticipate Bitcoin may rebound to $110,000 before falling again.
-
Historically, when Bitcoin drops below its true average price (~$82,000), it typically enters a deep bear market. This level marks a critical threshold between bull and bear phases. If breached, the market may first test the key support at $93,000.
-
We will remain bearish as long as Bitcoin trades below $113,000.
-
Whether Bitcoin trades below the 21-week EMA is a crucial indicator for assessing market direction.
-
We expect the next bull cycle may begin only after a shift in Fed monetary policy—one of our core monitoring factors.
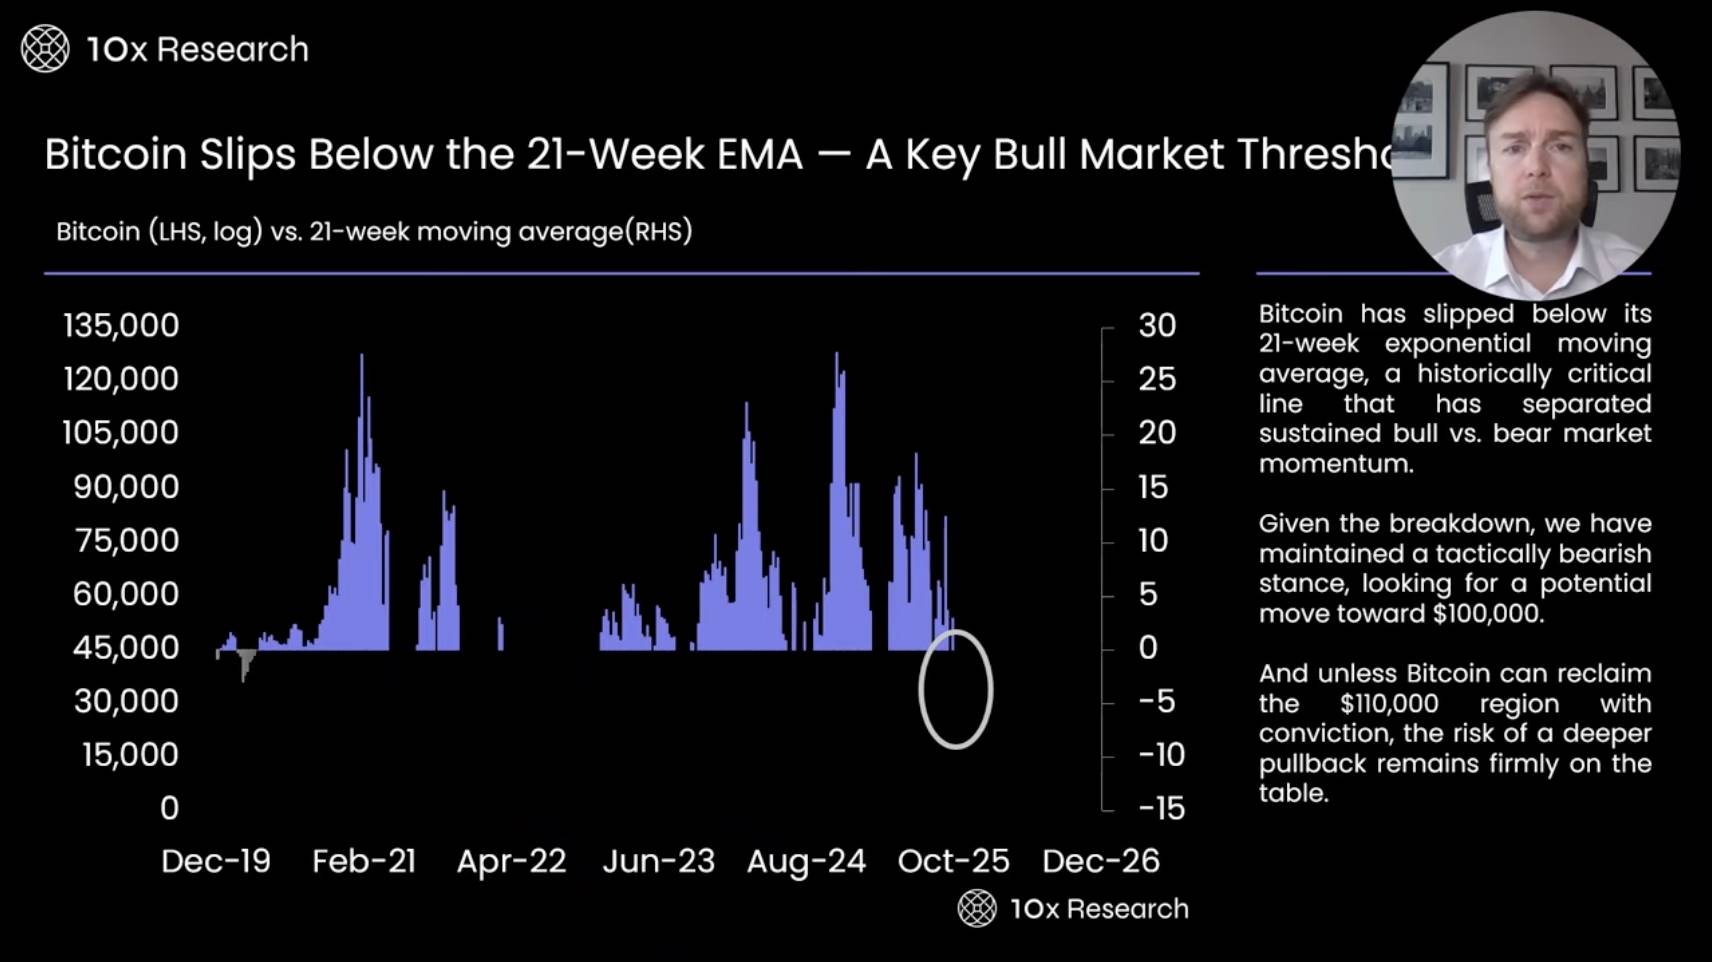
Bitcoin Falls Below 21-Week EMA — A Critical Bull Market Threshold
-
The 21-week exponential moving average (EMA) is our current key metric. Typically, when Bitcoin breaks below this level, the market enters a minor bear market. This indicator played a vital role during the 2022 bull-to-bear transition, helping us avoid the significant drawdowns many investors experienced.
-
We also observed this signal during the summer 2024 market adjustment and the Q1 correction this year. It not only confirmed those corrections but provided early warning. These moves typically result in 30%–40% drawdowns—highly impactful. Therefore, having a clear reference line is essential, and that line today sits around $110,000.
-
Multiple indicators point to the $110,000–$112,000 range as pivotal. If Bitcoin breaks below, investors should manage risk, reduce long exposure, and adopt a neutral or bearish stance.
-
Current EMA levels suggest Bitcoin should trade between $100,000 and $110,000, consistent with actual price action. This forces us to seriously consider: Is the market entering an accelerating bear phase?
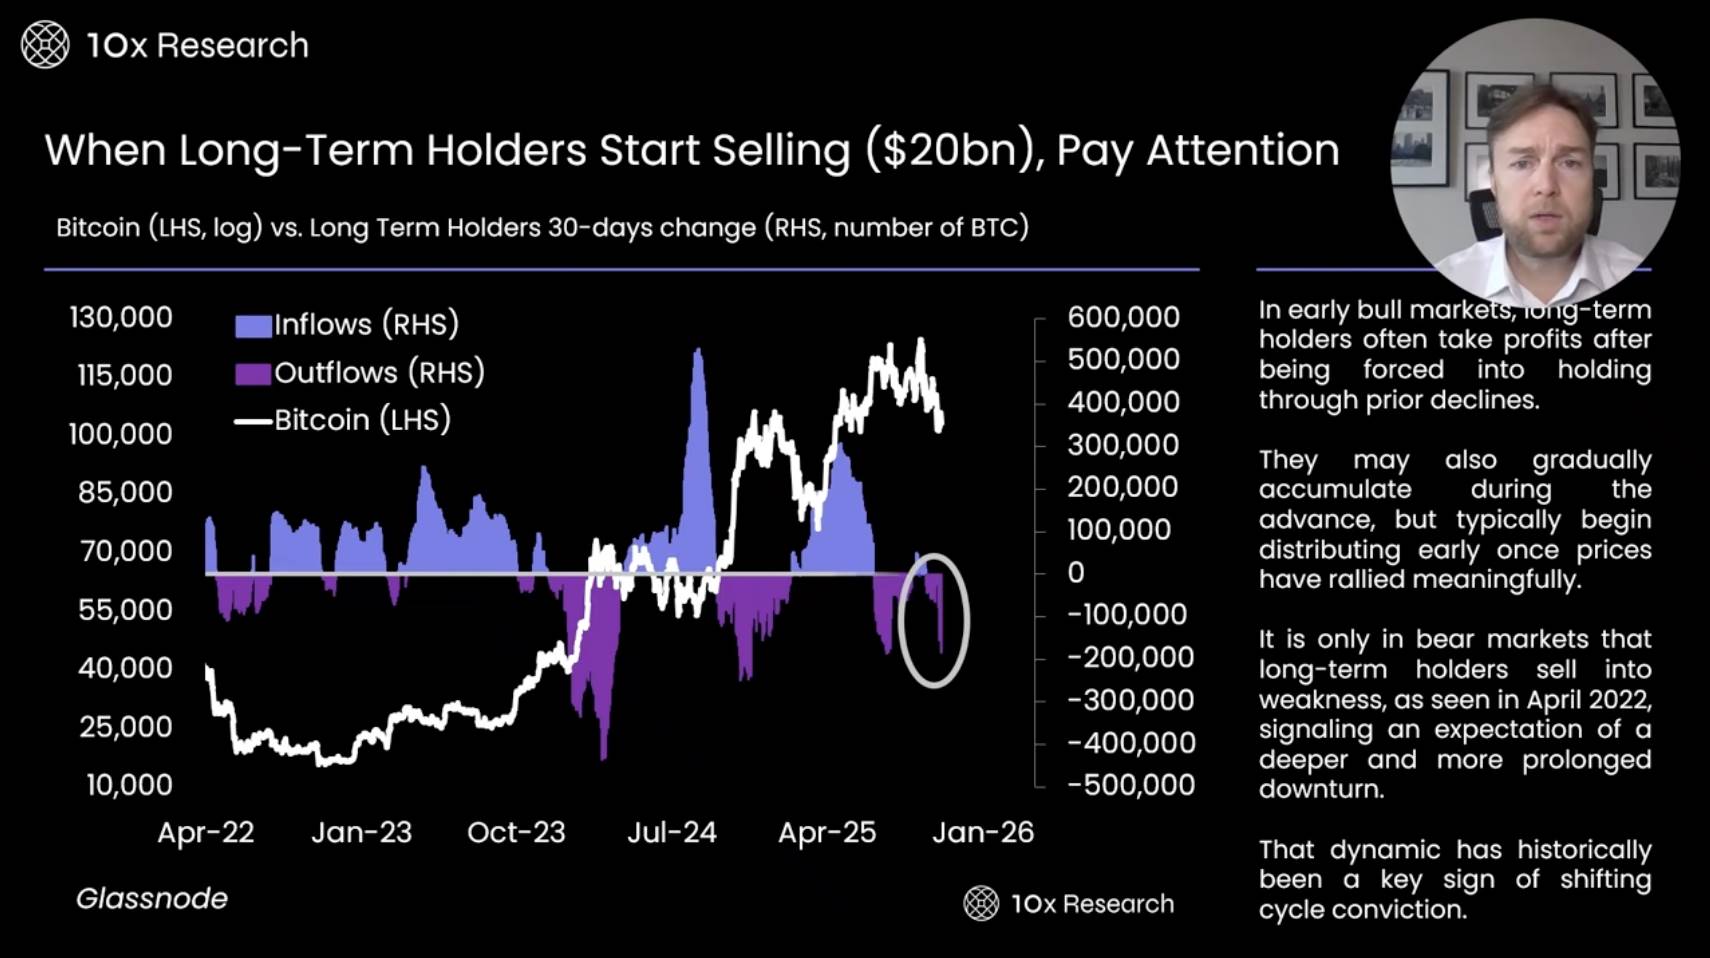
Long-Term Holders Sell $20 Billion Worth of Bitcoin
-
Long-term holder behavior deserves special attention. Over the past 30 days, they’ve sold 185,000 BTC, worth ~$20 billion. Their typical pattern involves selling during rallies and buying during consolidation, bottoms, or early rebounds. As prices rise, they gradually exit and continue reducing holdings at peaks.
-
Looking back at April 2022, heavy long-term holder selling drove Bitcoin from $40,000 down to $20,000—and briefly to $15,000. This is highly significant. In recent weeks, Bitcoin has declined steadily from $126,000 to the current $100,000–$130,000 range, yet long-term holders haven’t stopped selling.
-
This strongly suggests long-term holders believe further downside is likely and are choosing to exit. Whether they’re correct remains to be seen.
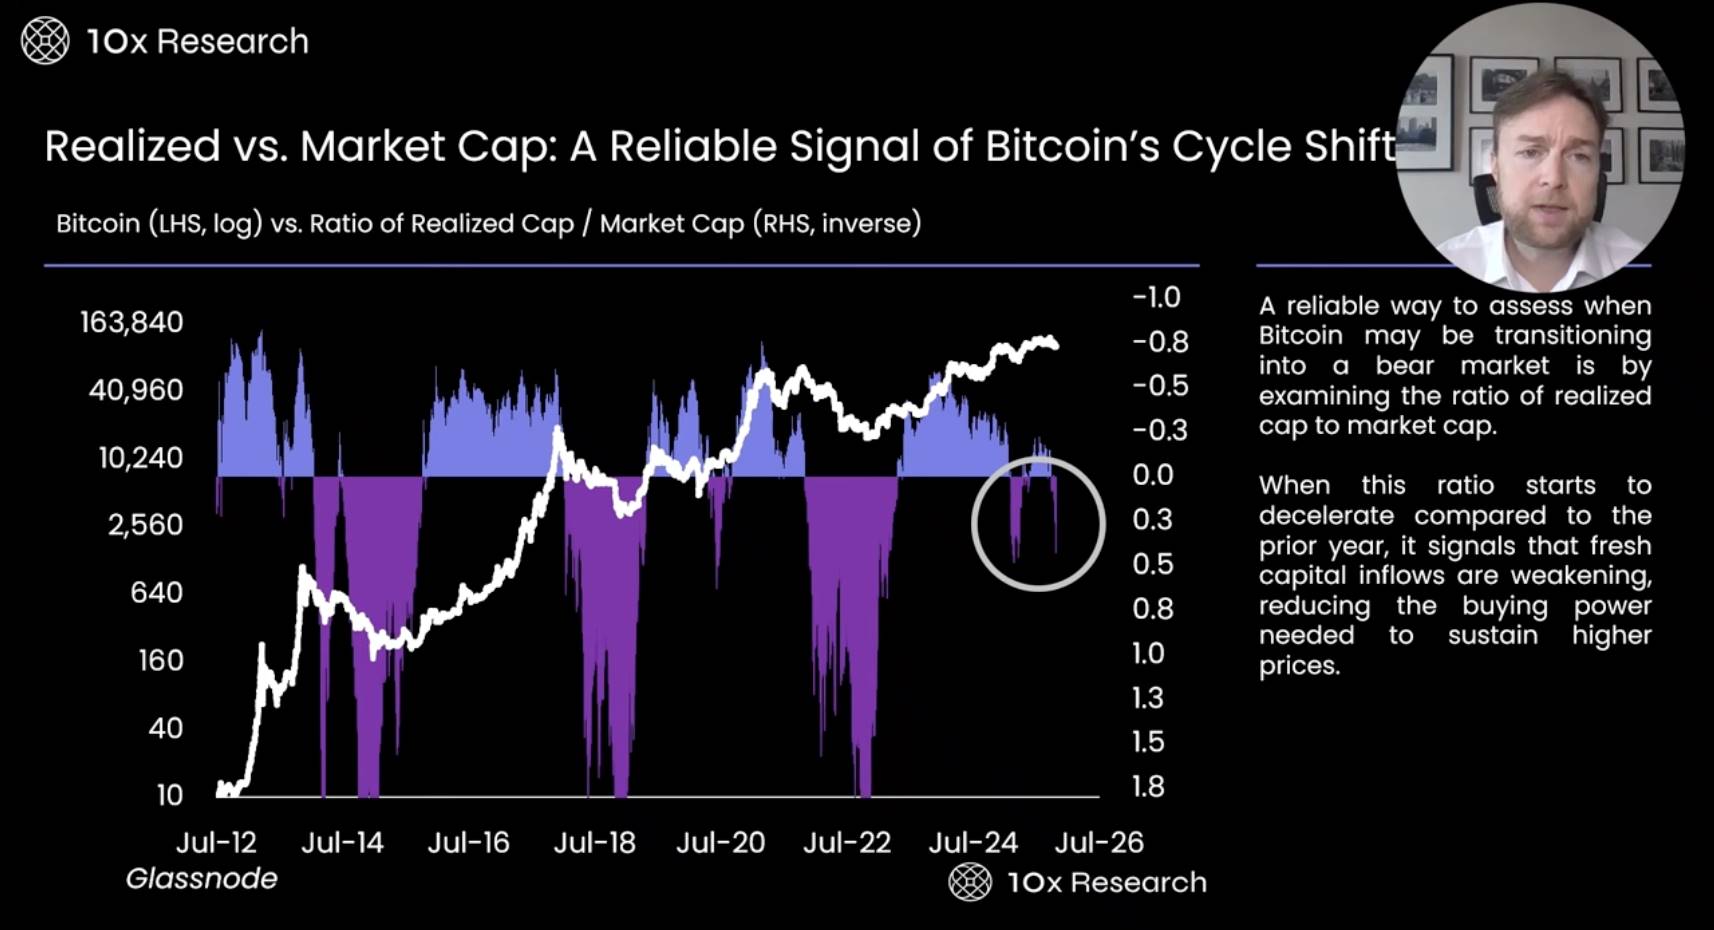
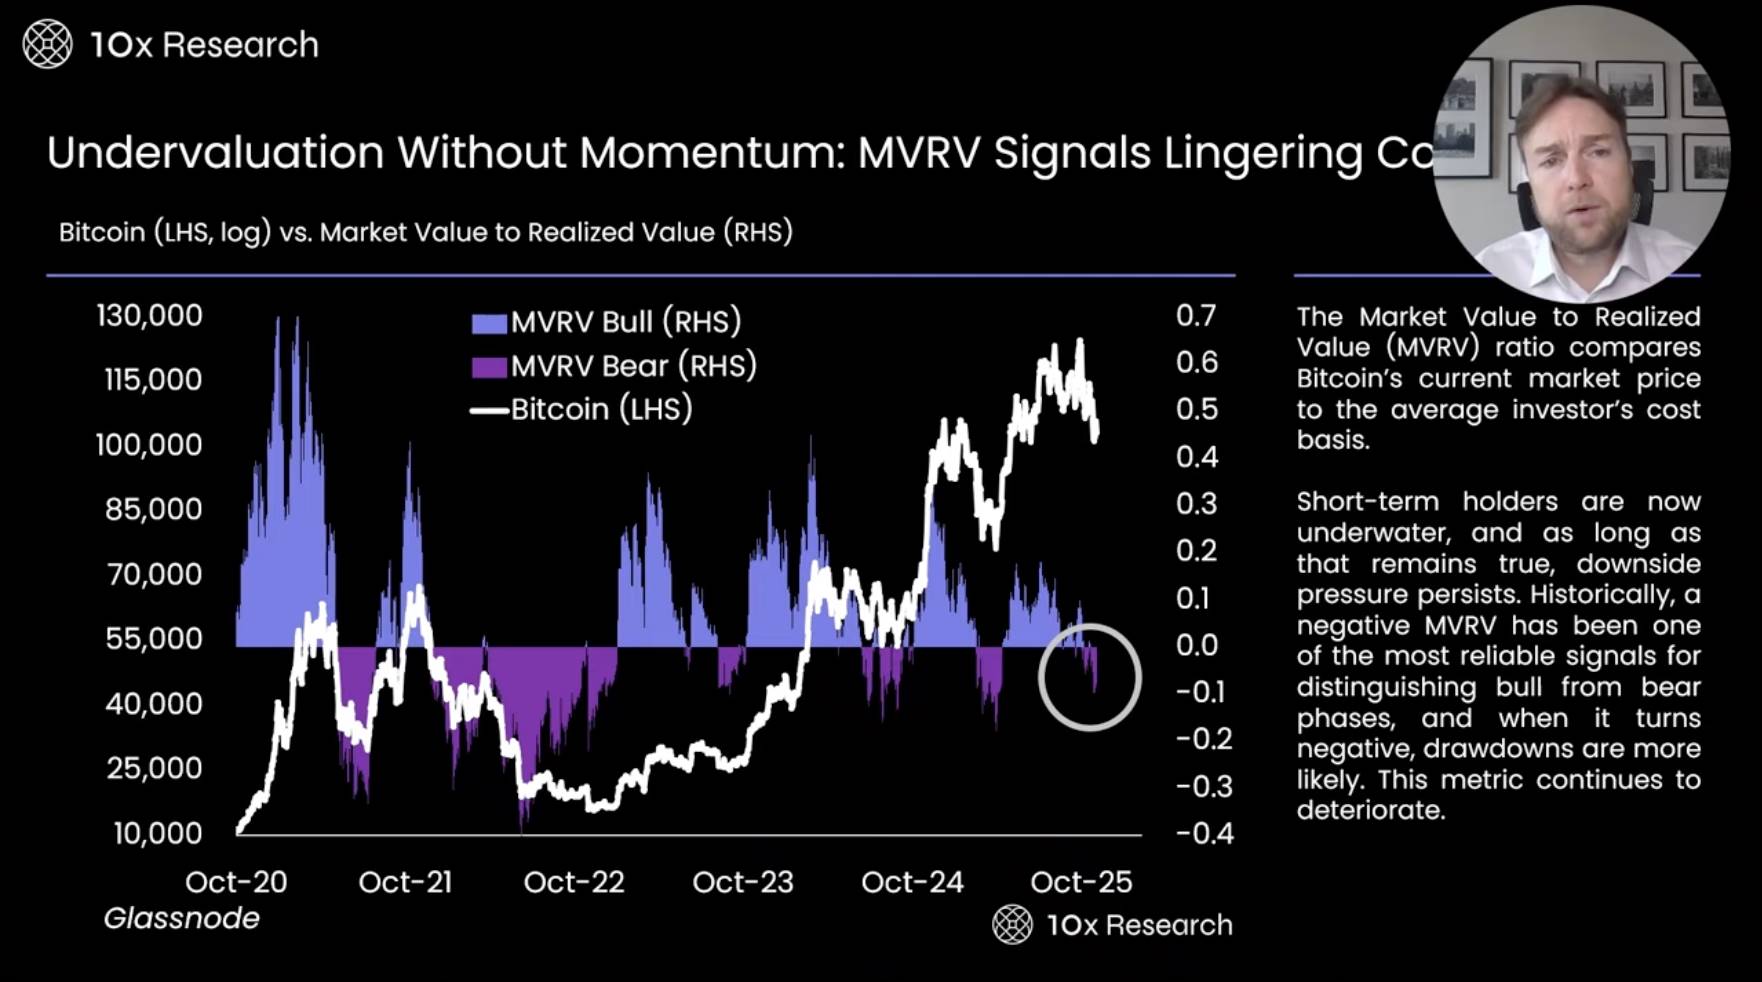
Market Value vs. Realized Value: A Reliable Signal for Bitcoin Cycle Shifts
-
The Market Value to Realized Value (MVRV) ratio is a key metric we frequently use. It played a crucial role in prior bear markets, successfully forecasting both major and minor downturns.
-
A negative reading typically indicates a correction phase, suggesting investors should exit, stay sidelined, or adopt a bearish stance. We believe the market is in such a phase now, warranting close attention.
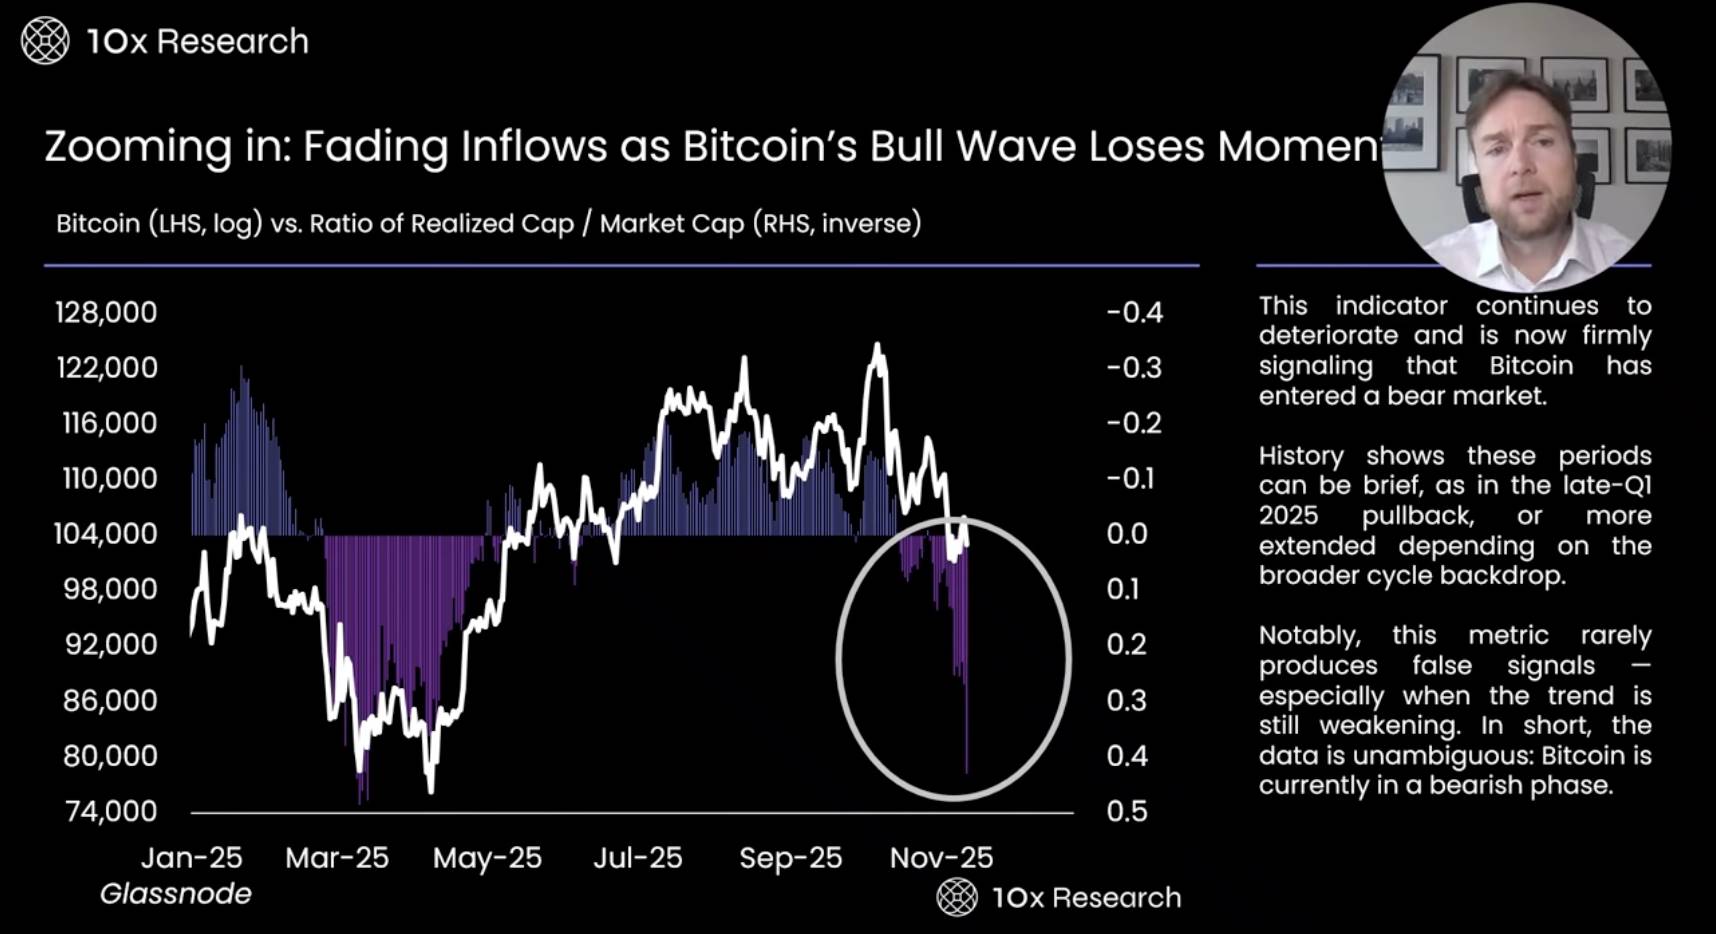
Bitcoin Bull Momentum Weakens as Capital Inflows Fade
-
Zooming in further reveals that the recent downward trend in this metric resembles the worst period of March this year. Although Bitcoin saw a modest rebound afterward, it then fell another 10% from that rebound level. Thus, it’s still unclear whether the market has truly bottomed. In fact, it remains uncertain whether $100,000 marks the low of this correction. Given how this indicator behaves, Bitcoin could fall below $100,000 and decline further, as it often signals deeper corrections ahead.
-
The market has undergone several weeks of correction. But comparing this to earlier market adjustments this year—which lasted 2 to 3 months—this current move has only lasted about three weeks so far.
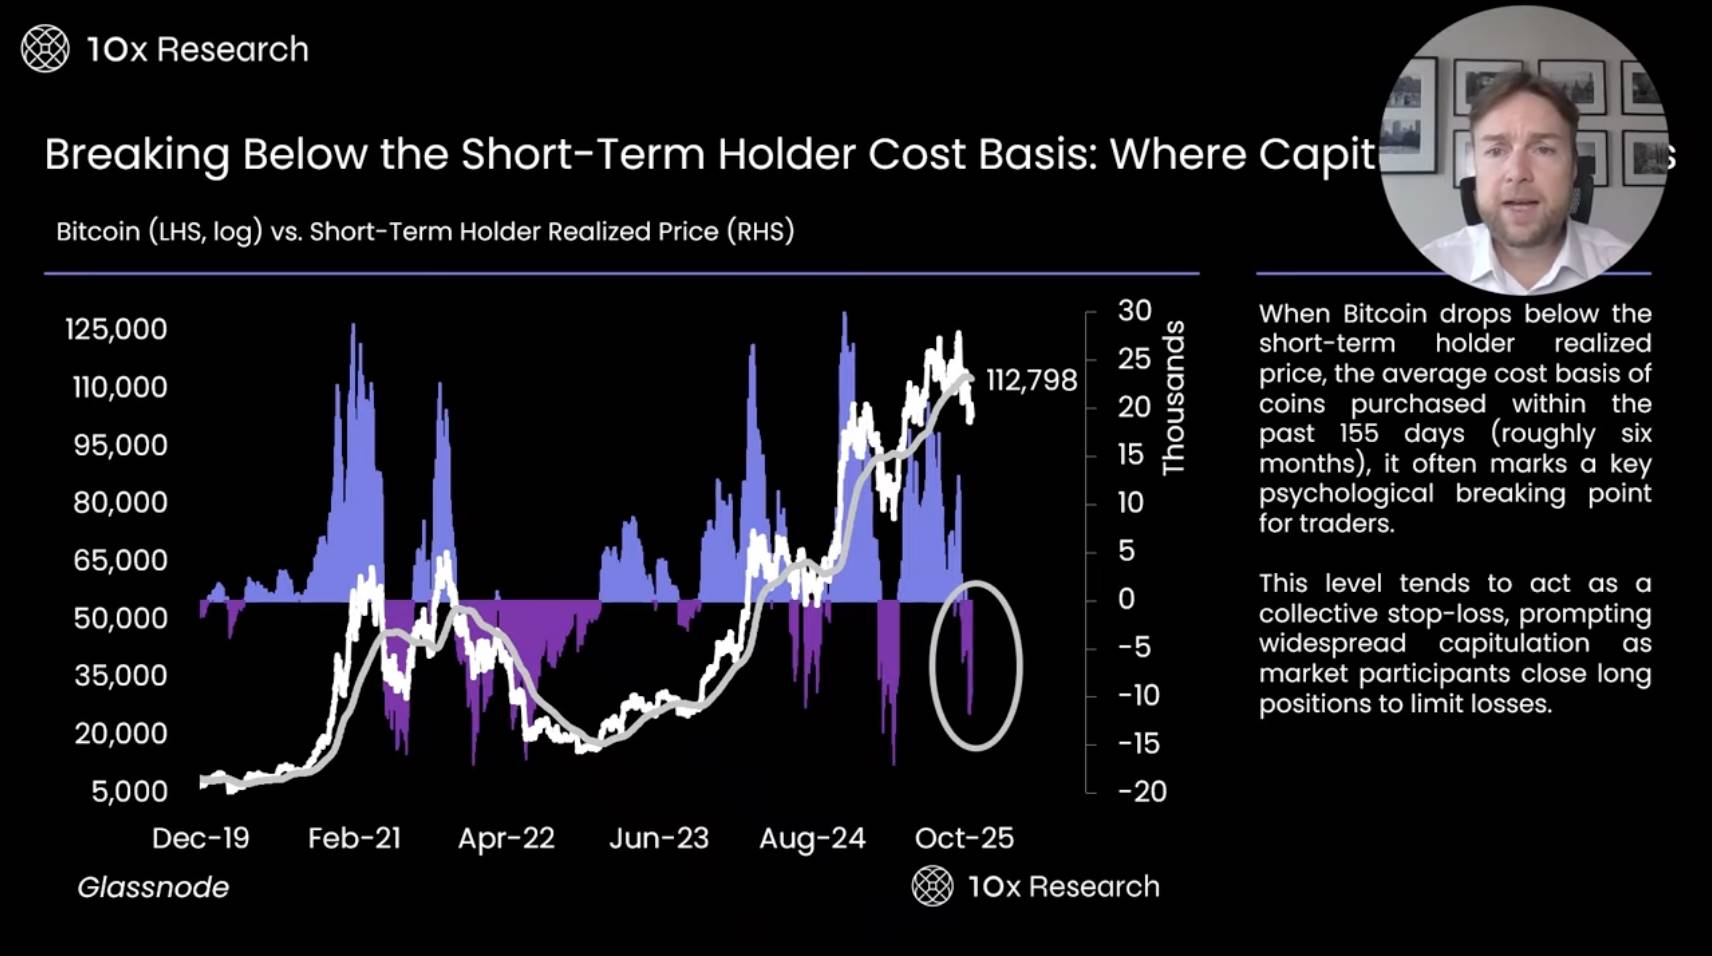
Short-Term Holder Cost Basis Breakdown: Surrender May Begin
-
The realized price of short-term holders is a critical metric, currently at $112,798 (at time of recording), representing the average entry price for coins held less than 155 days. When Bitcoin drops below this level, investors tend to stop-loss, triggering further declines. Short-term traders usually buy expecting price increases, so when prices fall below their entry points, they quickly sell. We’ve already seen this dynamic play out—after Bitcoin broke below $113,000, further downside followed, culminating in massive forced liquidations in October.
-
Additionally, on-chain data suggests a deeper market correction may be underway. The market appears to have entered a bear phase dominated by selling. This selling could take various forms and last longer. Historically, when short-term holders are underwater, Bitcoin tends to fall further. Only when price breaks above this level—ideally driven by strong catalysts—can the market turn bullish. Otherwise, downside risks remain elevated. In such conditions, capital preservation becomes paramount. If we aim to buy lower, we must sell higher.
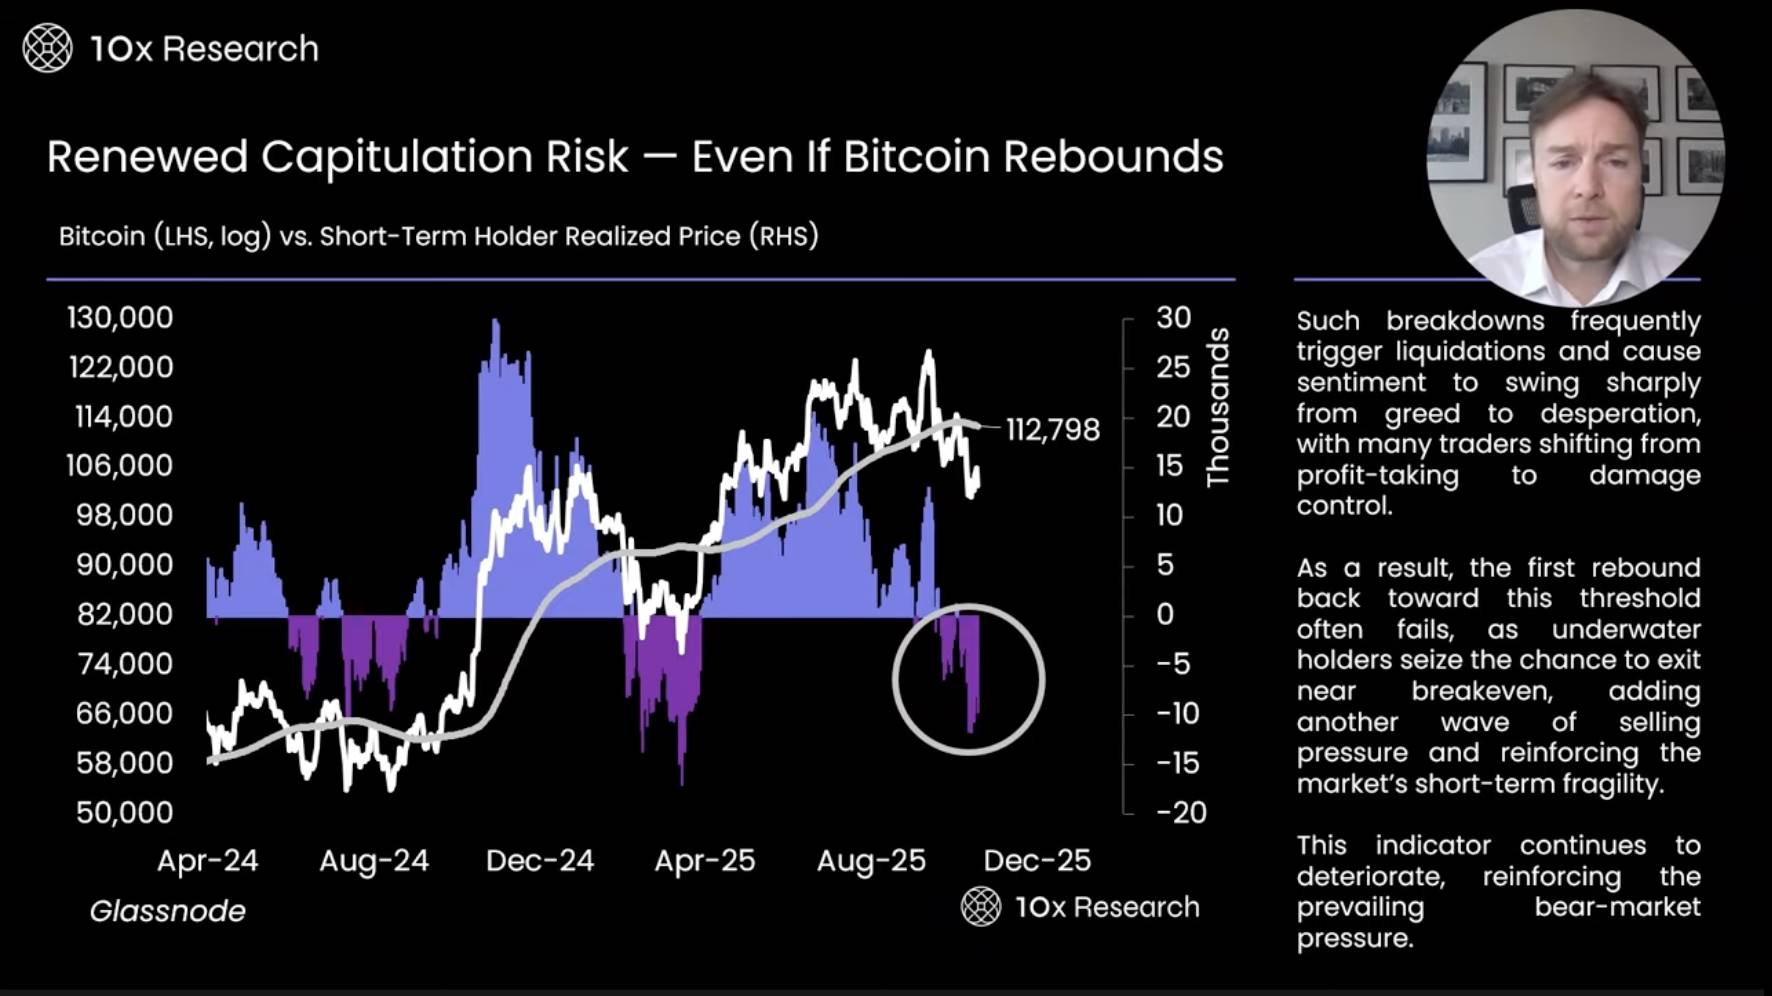
Surrender Risk Reemerges — Even on a Rebound
-
In recent weekly reports, we analyzed Bitcoin’s trend from multiple angles. Deeper analysis shows that related metrics turned more negative during the Q1 correction, suggesting the rebound pattern is more W-shaped than the traditional V-shaped recovery. A W-shaped rebound means two distinct bottoms and recoveries over time, rather than one swift rebound. Based on this, we expect Bitcoin may rally to $110,000 before declining again.
-
However, from a trading perspective, this view may be overly idealistic, as market timing is inherently uncertain. We can’t know whether price will rebound first or go straight down. Therefore, we believe maintaining a bearish stance while Bitcoin trades below $113,000 is more reasonable. Unless price breaks above this level, we prefer focusing on downside risks rather than chasing potential upside.
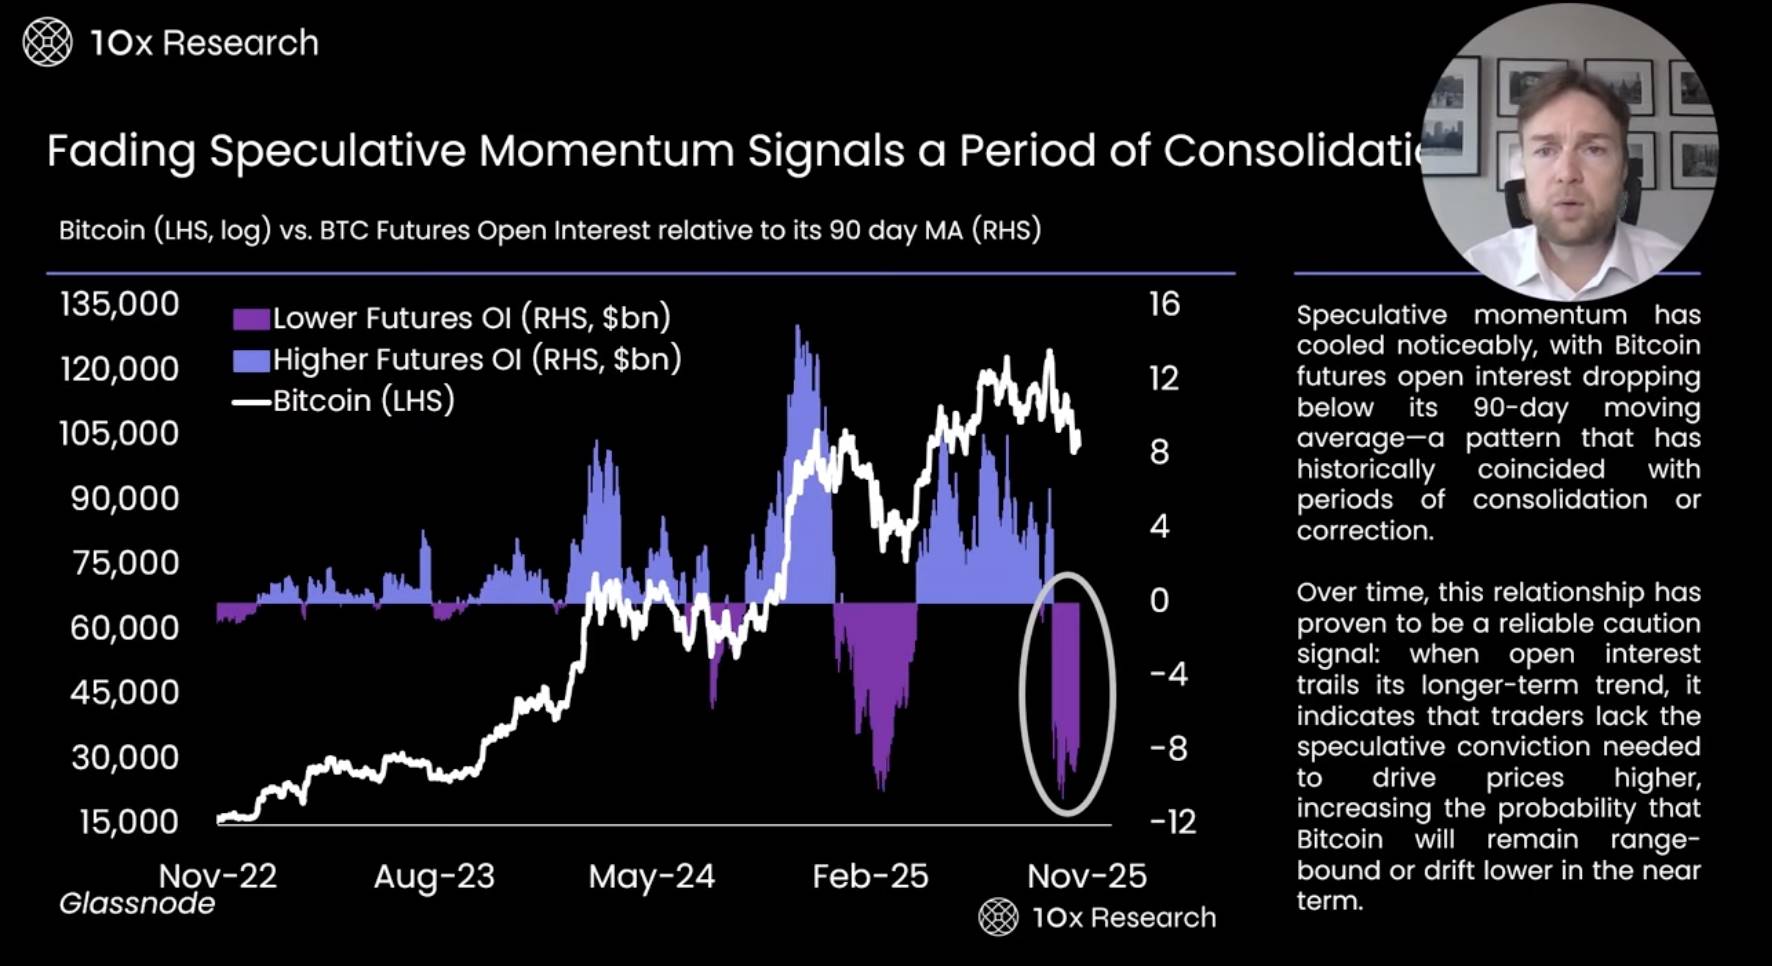
Speculative Momentum Fades — Suggesting Imminent Consolidation
-
During the October 10 market correction, a massive futures liquidation event occurred. At the time, former U.S. President Trump threatened 100% tariffs on China just before U.S. equity futures closed—while Bitcoin futures remained open. It was precisely then that $20 billion in positions were liquidated in the Bitcoin futures market.
-
This shows that when speculative futures traders exit, Bitcoin struggles to rebound. We may be seeing a similar dynamic now, as previous corrections showed that once futures traders unwind longs, rallies become extremely difficult. This is one reason we remain cautious. We closely monitor open interest, futures positioning, and funding rates—all of which currently show no bullish signals and instead indicate very conservative risk management by traders.
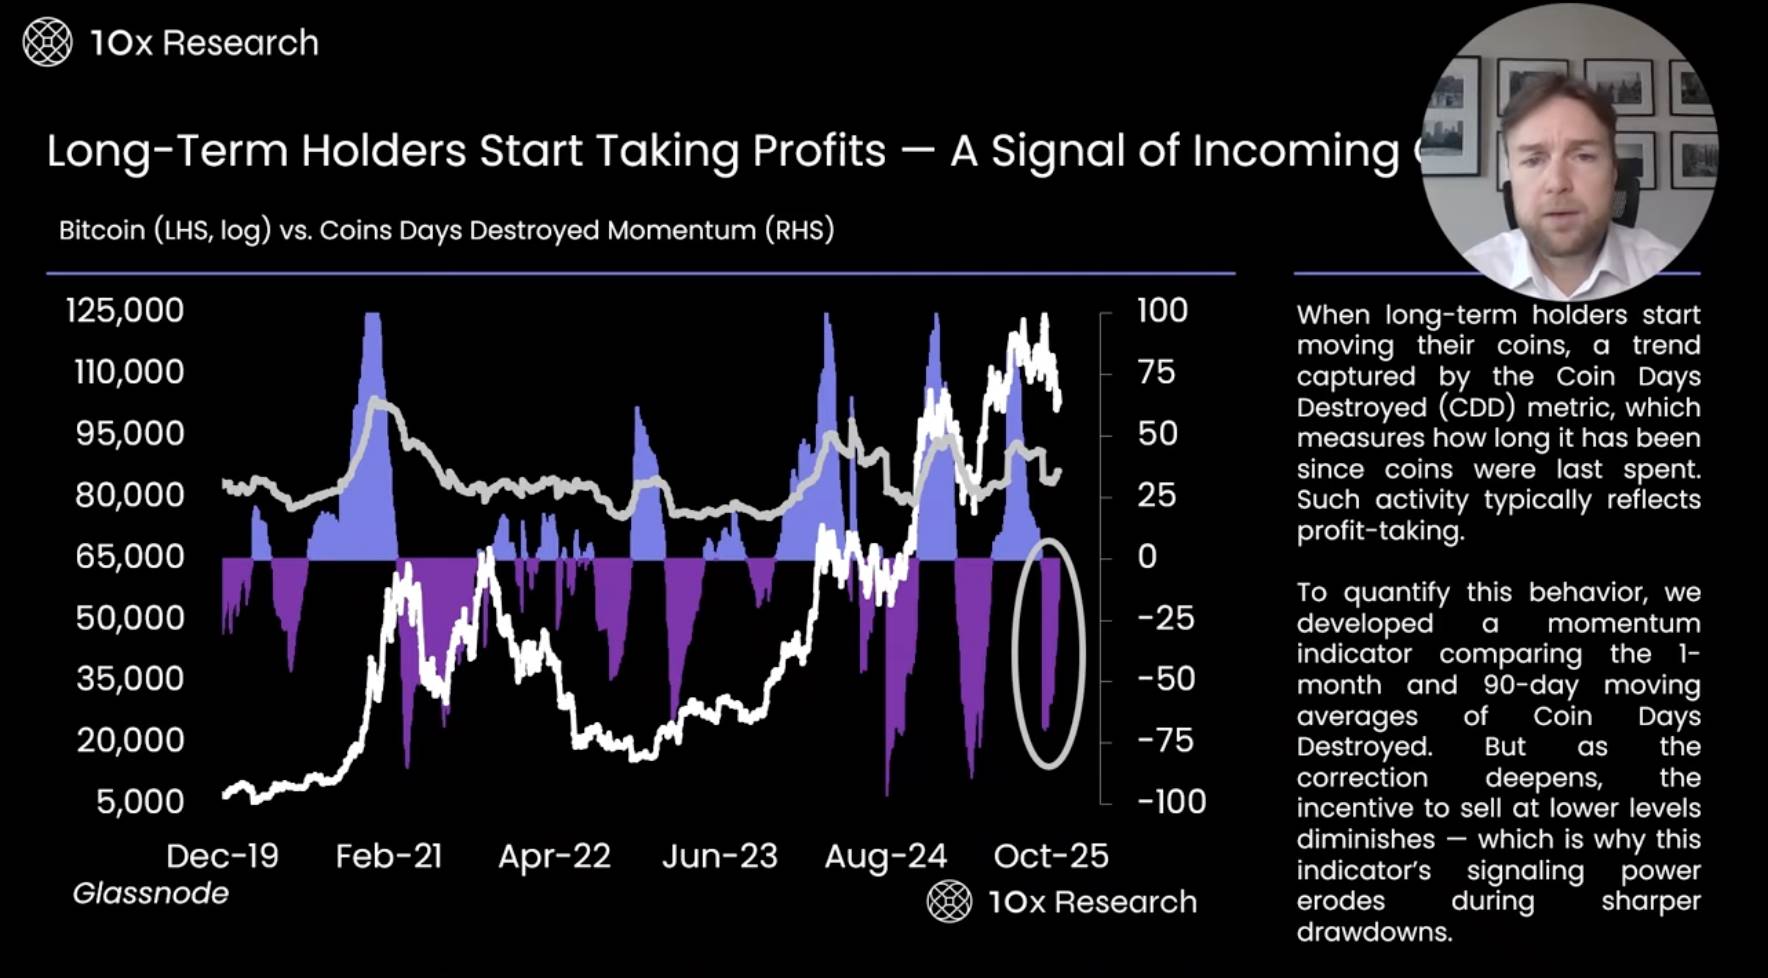
Long-Term Holders Begin Taking Profits — Signaling Possible Consolidation Ahead
-
Coin Days Destroyed is a metric tracking veteran investors holding Bitcoin long-term. It works by measuring the accumulated “coin days” destroyed when long-held coins are spent, serving as a warning signal. When long-term holders start selling, this metric alerts us to potential market risk.
-
However, during prolonged bear markets, long-term holders typically hold rather than sell at lows, which reduces the predictive power of this metric. Still, it provides useful cautionary insight. This is one important reason we remain cautious.
Low Valuation Without Momentum: MVRV Suggests Prolonged Consolidation
-
One of the most important off-chain metrics is Market Value to Realized Value (MVRV), which compares Bitcoin’s current price to the average cost basis of investors. Currently, this metric has turned negative, primarily reflecting the status of short-term holders who bought within the past 155 days—not the entire market.
-
This data shows many investors are currently underwater. When investors face losses, the market often experiences minor corrections—or even deeper ones. This was especially evident from late 2021 into the 2022 bear market. Moreover, the current bull market lacks momentum. Compared to the October 2020 bull wave, both market momentum and investor enthusiasm are significantly weaker. This low-momentum environment makes rapid reversals more likely, especially as investors realize they’re losing money. For this reason, we remain concerned the current bull run could fizzle prematurely.
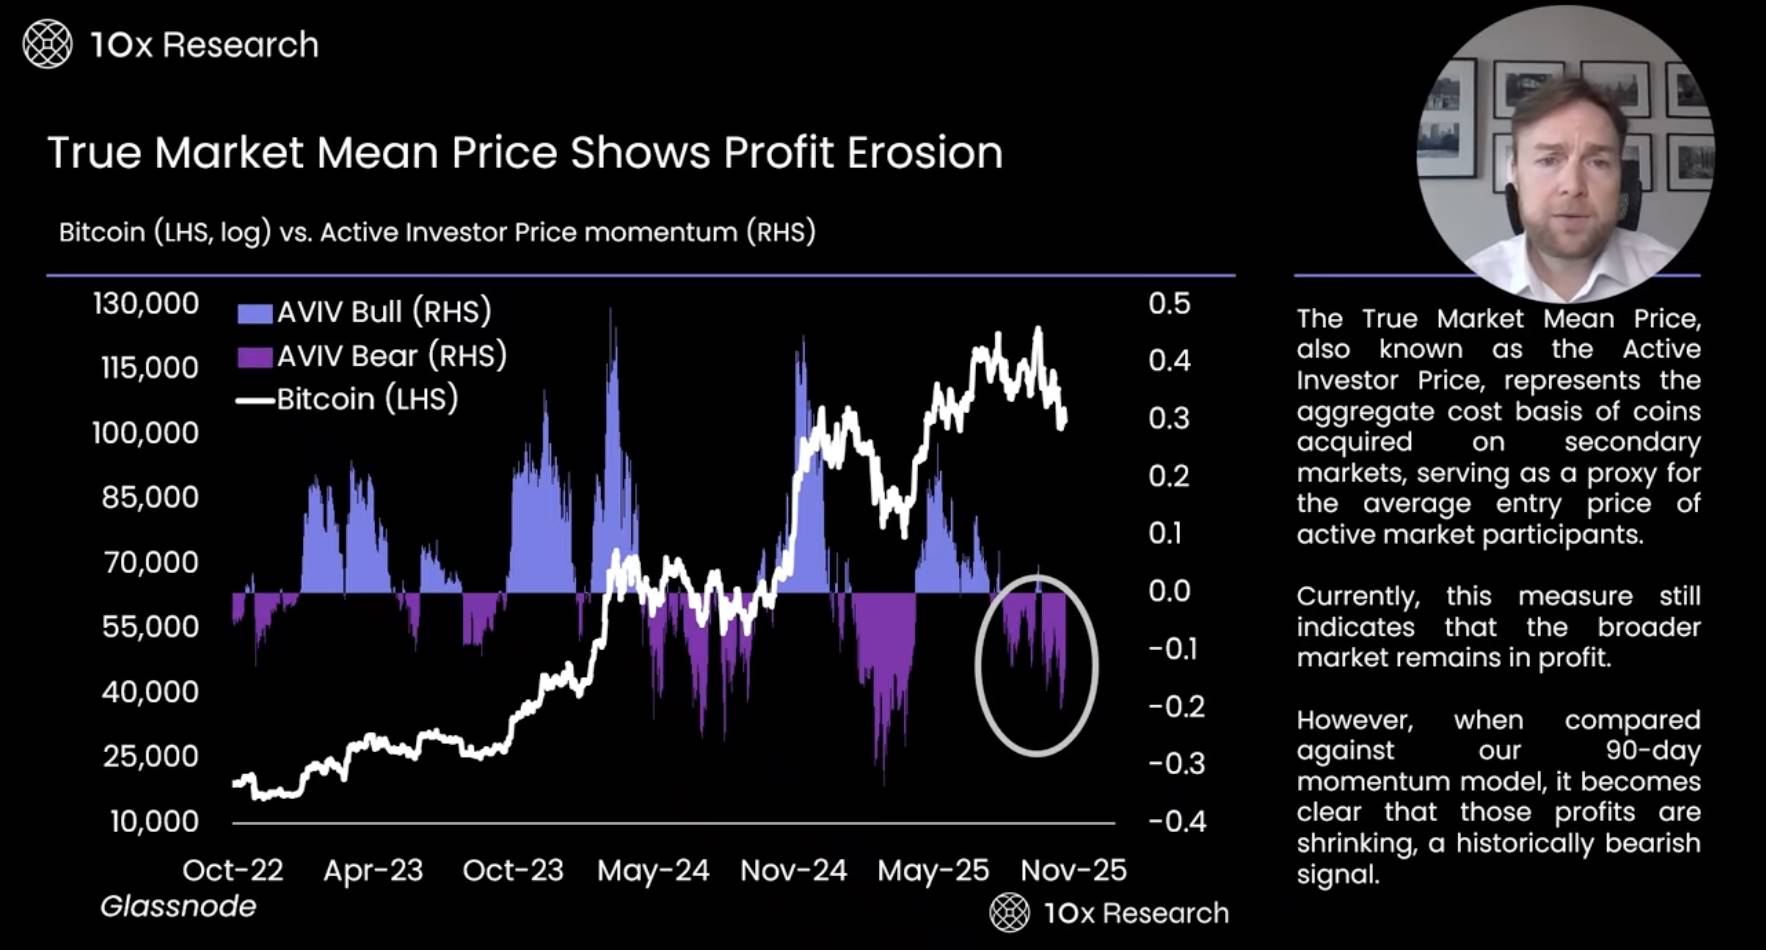
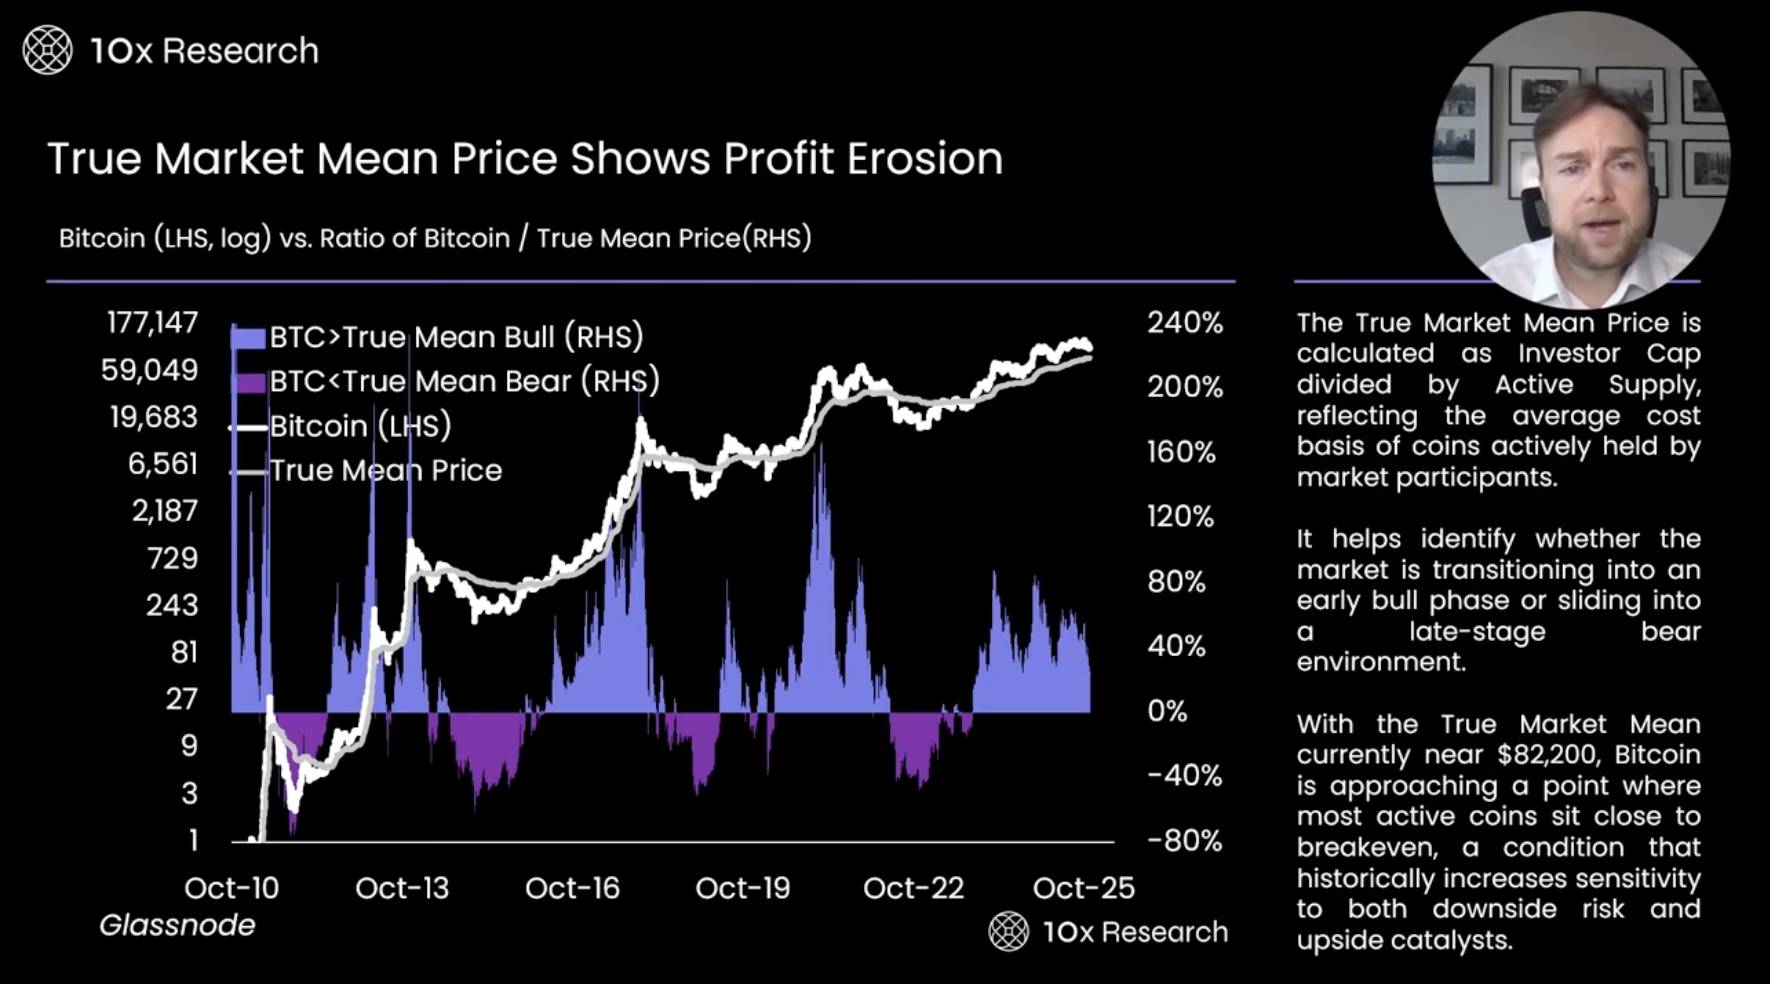
True Market Average Price Shows Investor Profitability Eroding
-
The True Market Mean Price is a key metric reflecting the overall acquisition cost of Bitcoin in the secondary market. It represents the average entry price of active investors and helps analyze cost pressures and behavioral tendencies. When investors face losses, they often sell or liquidate—a pattern frequently observed across market cycles.
-
Notably, market activity has clearly declined since this summer, with overall momentum weakening. This puts the market in a state of “hovering near a tipping point.” Recall the surge in market activity during last year’s Trump election period due to policy uncertainty. This year, after tariff concerns eased in April, the second wave of activity weakened significantly. As a result, market momentum is fading faster than expected, impacting investor confidence.
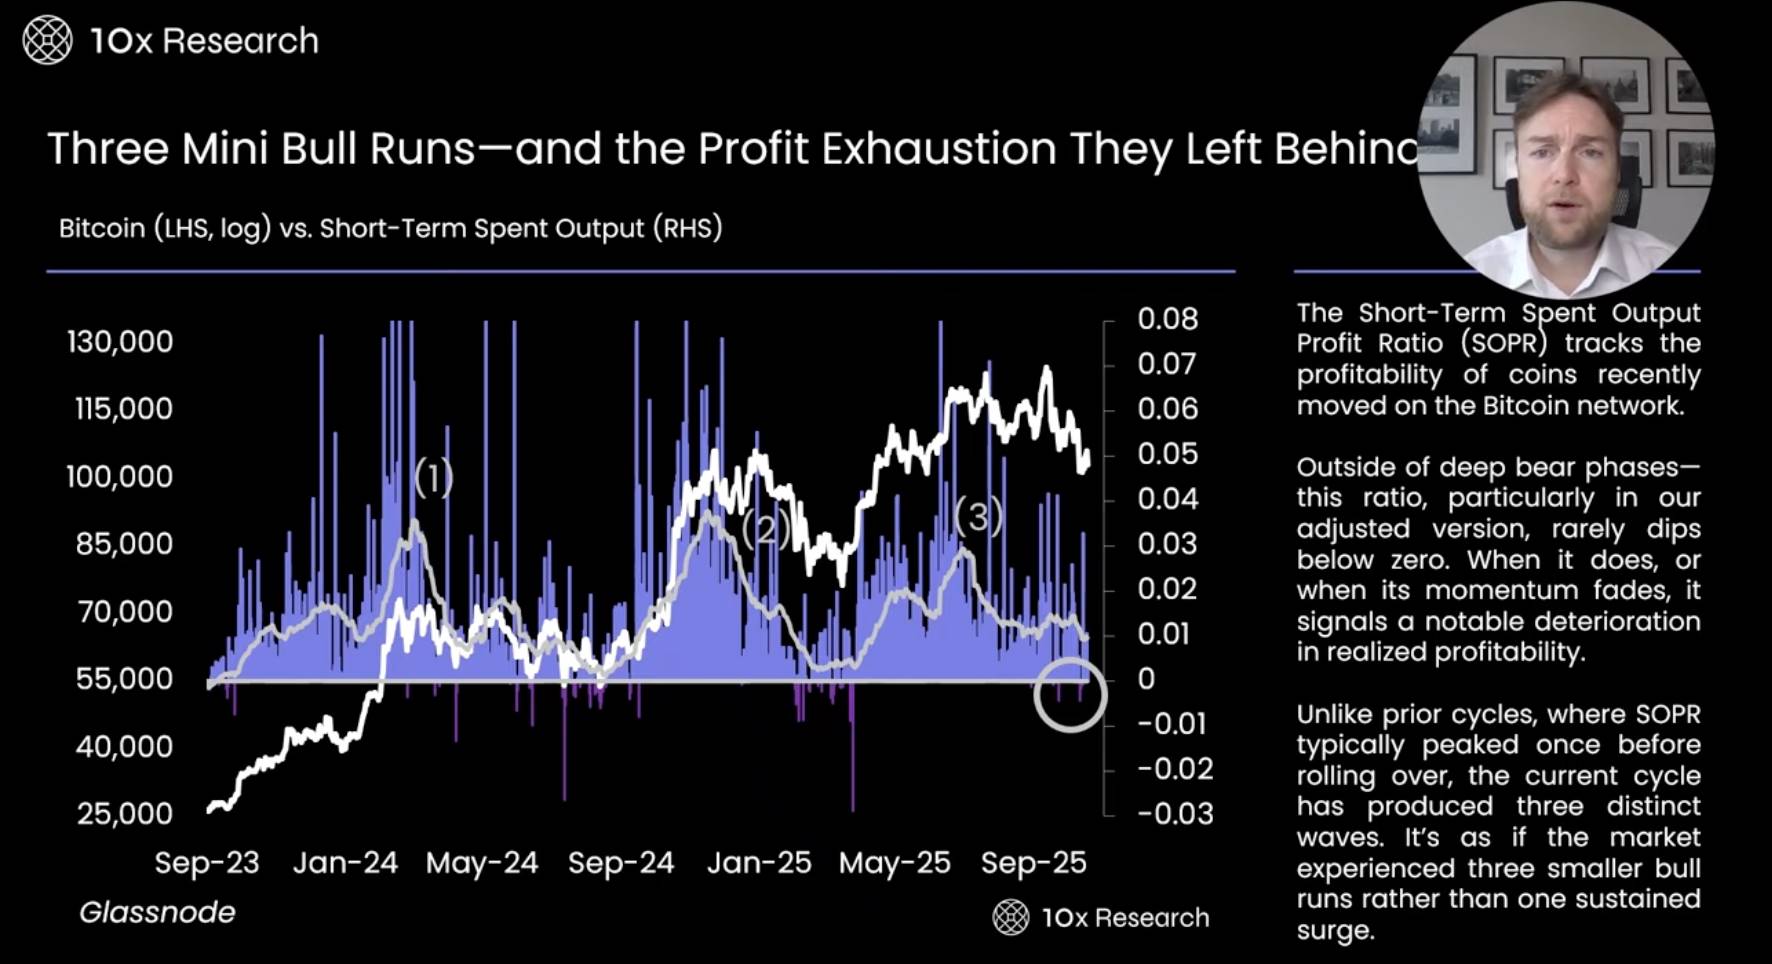
Three Mini-Bull Markets — And Signs of Profit Exhaustion
-
The Short Term Spend Output metric is a valuable tool for tracking whether recently circulating Bitcoin is in profit. Over the past two years, Bitcoin has seen two to three brief bull runs, all short-lived with rapidly fading momentum. As the market turns sluggish, we see successive price rebounds—but each smaller than the last, indicating diminishing recovery strength.
-
Historically, when the Short Term Spend Output approaches zero, it often signals a market bottom and a good time to buy Bitcoin. However, the metric hasn’t reached zero yet, suggesting short-term profitability hasn’t fully eroded—meaning it may not yet be the optimal entry point. Only when profitability nears zero does the bottom signal strengthen. For now, staying on the sidelines or waiting for clearer signals may be the safer strategy.
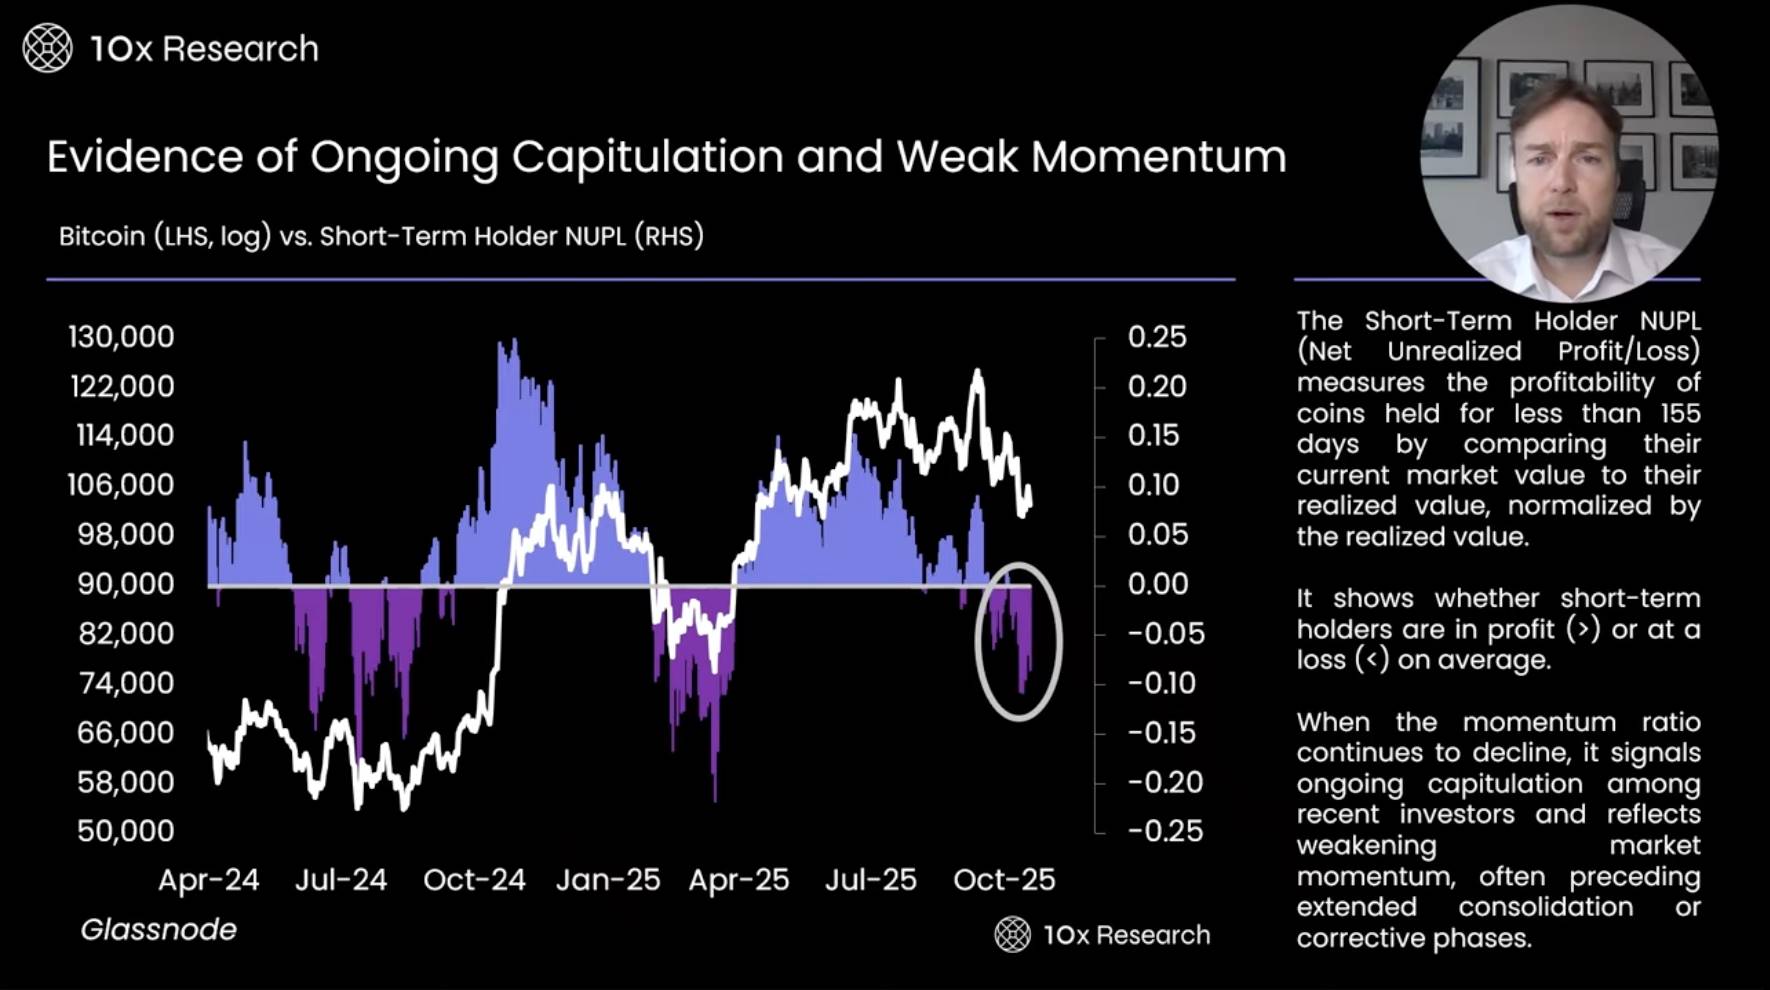
Evidence of Ongoing Surrender and Weak Momentum
-
The Short-Term Holder Net Unrealized Profit (NUPL) is a key metric measuring whether investors holding Bitcoin for less than 155 days are in profit. It compares current market value to realized value, normalized to reflect short-term holder performance. Current data shows weakening momentum and growing signs of “capitulation” selling—consistent with the market’s current lethargy.
-
Comparing this year’s adjustment to last summer and Q1, the current correction may last longer and fall deeper. Bitcoin still trades well below its all-time highs, making sustained rallies unlikely in the near term. Price may oscillate within a narrow $100,000–$110,000 range. In such an environment, investors might consider generating yield via selling call options and deeply out-of-the-money put options. Additionally, the next potential market-moving catalyst may emerge after the FOMC meeting on December 10, which investors should watch closely.
True Market Average Price Reveals Profit Erosion
-
On-chain metrics offer a more cautious view. For example, the Bitcoin-to-True-Mean-Price ratio is calculated by dividing Investor Cap by active supply, measuring the average holding cost of market participants. Current data shows weakening momentum among short-term holders, with most now facing losses.
-
Overall, the network’s average profitability stands at just 25%, comparable to MicroStrategy’s Bitcoin purchase cost. Historically, when Bitcoin falls below its true average price (~$82,000), the market typically enters a deep bear market. This level marks a critical threshold where the bull market ends and the bear begins. If breached, the market may first test key support at $93,000. Notably, during the Trump rally, Bitcoin surged from $68,000 to $93,000 with little volume in between—creating a potential “air pocket” where price swings wildly without stable support. If this level is tested, significant volatility may follow.
-
We are increasingly concerned Bitcoin may fall below $100,000. Based on trend models and on-chain indicators, we will remain bearish as long as Bitcoin trades below $113,000.
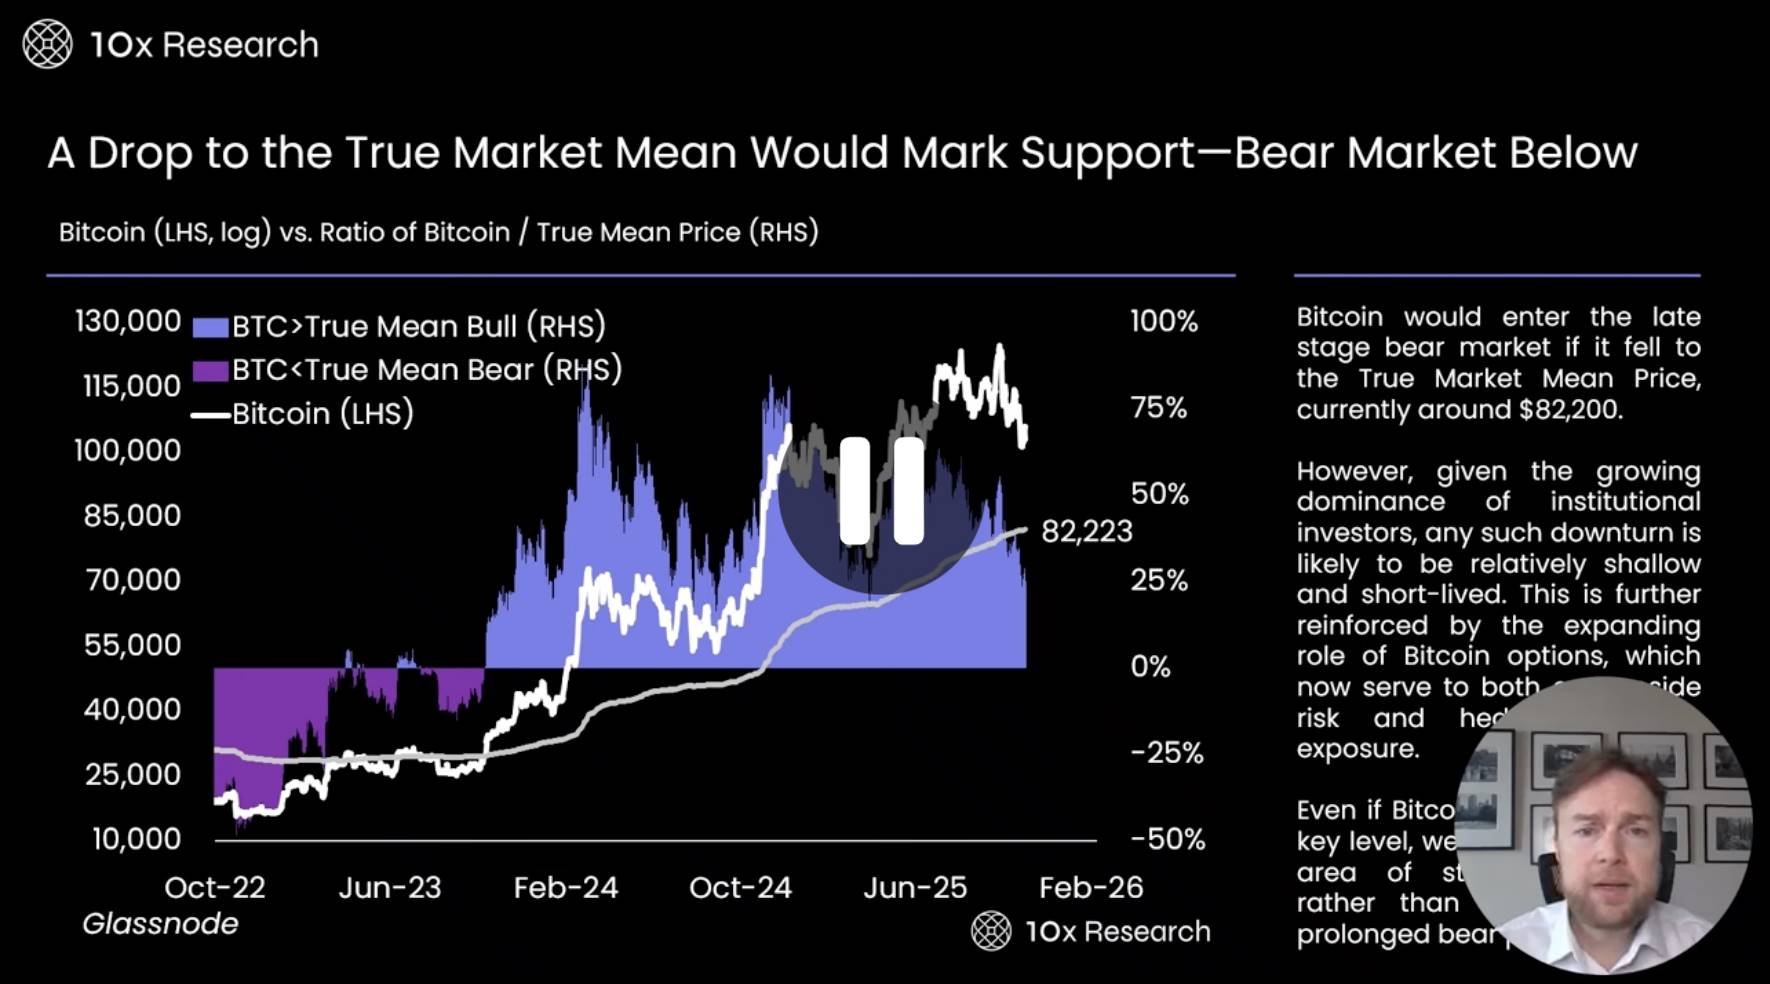
Falling to True Average Price Could Form Support — With Bear Market Below
-
Data further shows the average profitability of Bitcoin network investors has dropped sharply from 75% to 25%. This shift stems largely from intense top-of-market trading over recent months. Early adopters (OGs) and legacy investors have been gradually selling to new entrants, significantly raising the average cost base—or true mean price (True Mean Price). At the start of the year, this stood around $50,000–$60,000, but rapid trading volume pushed it much higher.
-
A key emerging risk is that many new investors bought Bitcoin between $100,000 and $126,000, making the market more fragile. These investors may be quicker to sell during downturns. For example, if Bitcoin drops to $100,000, those who bought at $120,000 may panic-sell under loss pressure, exacerbating market instability. Additionally, long-term holder profitability averages just 25%—not high relative to total capital invested—indicating subdued market confidence overall.
Join TechFlow official community to stay tuned
Telegram:https://t.me/TechFlowDaily
X (Twitter):https://x.com/TechFlowPost
X (Twitter) EN:https://x.com/BlockFlow_News