The Truth About Liquidity: A Research Report on the Exchange Listing Effect in 2024
TechFlow Selected TechFlow Selected
The Truth About Liquidity: A Research Report on the Exchange Listing Effect in 2024
The 2024 cryptocurrency exchange listing effect study chart shows a comparison of the coefficient of variation in 30-day percentage changes across exchanges, with Binance and Bybit exhibiting the lowest coefficients (approximately 1.5 and 2.0), indicating the most stable price volatility, while other exchanges such as Bitget, KuCoin, and Gate.io have coefficients ranging from 2.5 to 4.2. The chart specifically notes that extreme values from Upbit (15.59) and Kraken (20.28) have been excluded to ensure analytical accuracy.
1. Research Introduction
1.1 Research Background
This year, the market has sparked widespread discussion on VC tokens with high fully diluted valuations (FDV) but low market capitalizations (MC). As newly issued tokens in 2024 have driven the MC/FDV ratio to its lowest level in the past three years, this indicates a significant volume of tokens will be unlocked and enter the market in the future. Although low initial circulating supply may lead to short-term price increases due to rising demand, such rallies lack sustainability. Once large volumes of tokens are unlocked and flood the market, the risk of oversupply intensifies, raising investor concerns that this market structure may fail to support sustained price appreciation.
As a result, many investors are shifting their interest from these VC tokens toward Meme coins. Meme coins are characterized by having most tokens fully unlocked at TGE, resulting in high circulation rates and no sell-side pressure from future unlocks. This structure reduces market supply pressure and gives investors greater confidence. Many Meme coins launch with an MC/FDV ratio close to 1, meaning holders do not face dilution from further token issuance, providing a relatively stable market environment. As awareness grows regarding the risks of large-scale token unlocks, investor interest is gradually shifting toward these highly liquid, low-inflation Meme coins—despite their potential lack of practical use cases.
In today’s market landscape, investors must exercise increased caution when selecting tokens. However, investors often struggle to independently assess each project's value and potential,at which point exchange screening mechanisms become critical.As the direct "gatekeeper" bringing token assets to users, centralized exchanges (CEXs) not only help verify token compliance and market potential but also play a key role in filtering high-quality projects. Although there is an alternative view in the market suggesting on-chain trading will surpass CEX trading, Klein Labs believes that CEX market share will not be overtaken by on-chain trading. Factors such as seamless trading experience on CEXs, centralized custodial responsibility, established user habits and mindshare, liquidity barriers, and global regulatory compliance trends ensure that CEX trading volume will long remain dominant over on-chain trading.
Then comes the natural question: how do centralized exchanges select and decide which projects to list among so many options? How have tokens listed over the past year performed overall? Is there any correlation between the performance of these listed tokens and the exchanges they chose?
To answer these market concerns, this study aims to examine listing activities across major exchanges and analyze their actual impact on token market performance, focusing on post-listing trading volume changes and price volatility patterns, in order to identify how different exchanges influence the market performance of listed tokens.
1.2 Research Methodology
1.2.1 Research Subjects
We classify exchanges based on region and target market into the following three categories:
Founded by Chinese individuals, targeting global markets:Binance, Bybit, OKX, Bitget, KuCoin, Gate, etc. These well-known exchanges were primarily founded and invested in by Chinese entrepreneurs and serve global markets. Given the large number of Chinese-founded exchanges, we selected those with distinct development characteristics for this study; unselected exchanges also possess unique strengths.
Korean-founded, targeting domestic markets:Bithumb, UPbit, etc. Primarily serving the Korean domestic market.
U.S.-founded, targeting Western markets:Coinbase, Kraken, etc. U.S.-based exchanges primarily serving European and American markets, typically under strict regulation by bodies such as the SEC and CFTC.
Exchanges from other regions such as Latin America, India, and Africa are excluded from in-depth analysis in this report due to their combined trading volume and liquidity being less than 5%.
We selected a total of 10 representative exchanges from the above groups to analyze their listing performance, including the number of listing events and their subsequent market impacts.
1.2.2 Time Frame
We focus on price changes of tokens on the Day 1, within the first 7 days, and within the first 30 days after TGEafter TGE, analyzing trends, volatility patterns, and market reactions for the following reasons:
- On Day 1 after TGE, new assets are launched and trading volume is highly active, reflecting immediate market acceptance. Influenced heavily by FOMO and buying frenzy, it represents a key phase for initial market pricing.
- Price movements during the first 7 days capture short-term market sentiment toward the new token and initial recognition of project fundamentals, measuring the persistence of market热度 and returning to a reasonable initial valuation.
- The first 30 days observe the token’s long-term support strength. After short-term speculation cools down and speculators exit, whether price and trading volume remain stable becomes an important indicator of market acceptance.
1.2.3 Data Processing
This study employs a systematic data processing approach to ensure scientific rigor. Compared to common research methods available in the market, our methodology is more intuitive, concise, and efficient.
Data in this report primarily comes from TradingView, covering price data of newly listed tokens on major exchanges in 2024, including initial listing prices, market prices at various time points, and trading volumes. Due to the large sample size, this large-scale data analysis helps reduce the impact of individual outliers on overall trends, thereby enhancing the reliability of statistical results.
(I) Multivariate Overview of Listing Activities
This study adopts a multivariate analytical approach, comprehensively considering factors such as market conditions, trading depth, and liquidity to ensure comprehensive and scientific results. We compare average price changes of new tokens across different exchanges and conduct in-depth analysis incorporating each exchange’s market positioning (e.g., user base, liquidity, listing strategy).
(II) Mean Value for Overall Performance Assessment
To measure token market performance, we calculate the percentage change relative to the initial listing price, using the following formula:
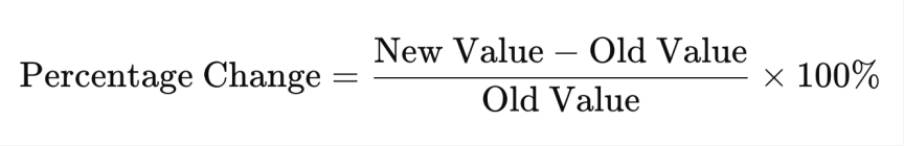
Considering that extreme market conditions could distort overall data trends, we exclude the top 10% and bottom 10% extreme outliers to minimize interference from rare events (such as sudden positive news, market manipulation, or abnormal liquidity). This treatment makes the results more representative and better reflects the real market performance of new tokens across different exchanges. Subsequently, we compute the mean price change for new tokens on each exchange to evaluate the overall market performance of new listings on different platforms.
(III) Coefficient of Variation for Stability Assessment
The coefficient of variation (CV) is a metric measuring relative data volatility, calculated as follows:
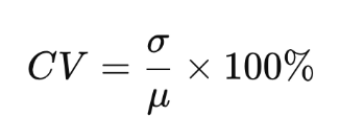
Where σ is the standard deviation and μ is the mean. CV is a dimensionless metric unaffected by data units, making it suitable for comparing volatility across different datasets. In market analysis, CV is primarily used to measure the relative volatility of price or returns. In exchange or token price analysis, CV can reflect the relative stability of different markets, providing investors with a basis for risk assessment. We use CV instead of standard deviation here because CV offers higher applicability.
2. Listing Activity Overview
2.1 Exchange Comparison
2.1.1 Number of Listings and FDV Preference
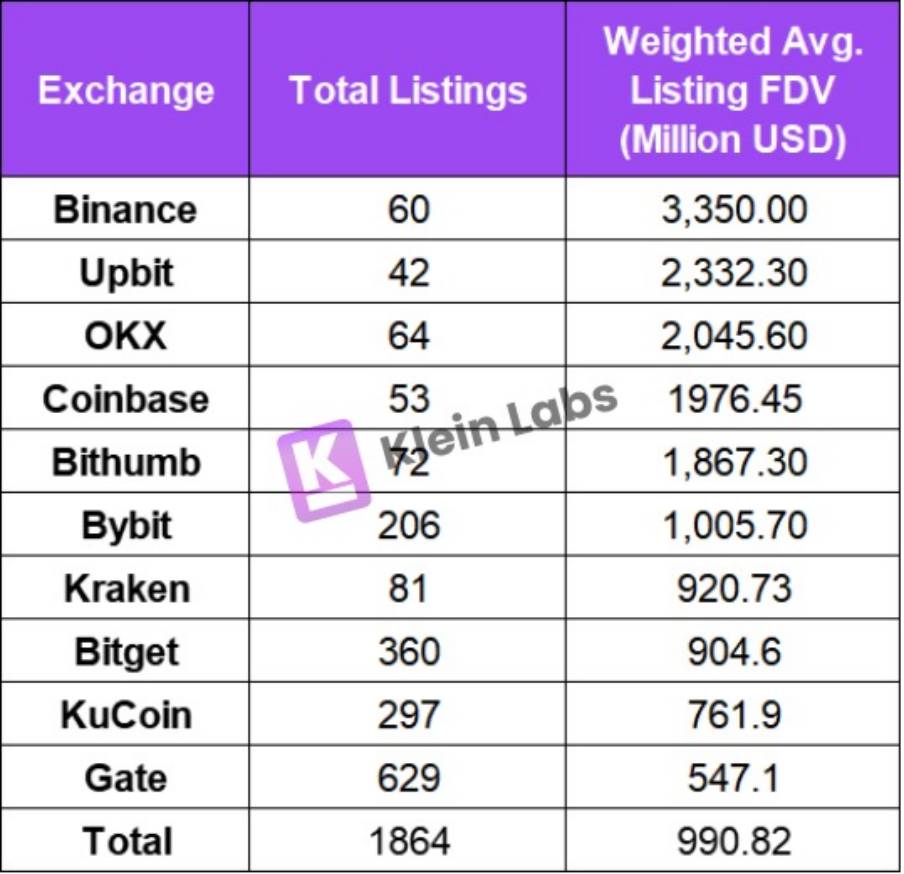
Figure: Overview of Listing Events in 2024
We find that top-tier exchanges (e.g., Binance, UPbit, Coinbase) generally have fewer listings compared to others. This reflects how an exchange's position influences its listing style.
In terms of listing volume, exchanges like Binance, OKX, UPbit, and Coinbase maintain stricter listing rules, resulting in fewer but larger-scale listings; whereas Gate lists new assets more frequently, offering more trading opportunities. Data shows that listing volume is roughly negatively correlated with FDV—that is, exchanges listing more high-FDV projects tend to have fewer total listings.
CEXs adopt different strategies to determine listing priorities, focusing on different Fully Diluted Valuation (FDV) tiers. Here, we categorize projects by FDV to better understand exchange listing standards. When evaluating token valuations, both Market Cap (MC) and FDV are commonly considered, together reflecting a token’s valuation, market size, and liquidity.
- MC only calculates the total value of currently circulating tokens, excluding future unlocked tokens, thus potentially underestimating a project’s true valuation—especially when most tokens are yet to unlock, leading to possible misinterpretation.
- FDV, based on the total token supply, provides a more comprehensive reflection of a project’s potential valuation, helping investors assess future sell pressure and long-term value. For projects with low MC/FDV ratios, FDV has limited short-term relevance and is more useful as a long-term reference.
Therefore, when analyzing newly listed tokens, FDV is more informative than Market Cap. Hence, we use FDV as our benchmark here.
Additionally, regarding attitudes toward initial listings, most exchanges adopt a balanced strategy, supporting both initial and non-initial listings, though typically imposing higher requirements on non-initial ones, as initial listings attract more new users. Moreover,the two Korean exchangesUPbit and Bithumb primarily focus on non-initial listings.Compared to initial listings, non-initial listings reduce selection risk and avoid market volatility and insufficient initial liquidity during launch phases. Meanwhile, for project teams, non-initial listings alleviate marketing and liquidity management burdens, leveraging existing market recognition to drive growth.
2.1.2 Sector Preferences
Binance
In 2024, Meme coins remained the largest category by count. Infrastructure and DeFi projects also constituted a significant portion. RWA and DePIN sectors had relatively few listings on Binance, but performed well overall—USUAL reached a peak spot price gain of 7081%. Although Binance remains cautious in these areas, once a project is listed, market response is typically strong. In the second half of the year, Binance showed a clear preference for AI Agent-related tokens within the AI sector, which accounted for the highest proportion among AI projects.
In 2024, Binance showed a notable preference for the BNB ecosystem. The listings of projects like BANANA and CGPT indicate Binance’s increasing support for its native blockchain ecosystem.
OKX
OKX also listed the most Meme coins, accounting for about 25%. Compared to other exchanges, OKX listed more public chain and infrastructure projects, totaling 34%, indicating that in 2024, OKX placed greater emphasis on underlying technological innovation, scalability optimization, and sustainable blockchain ecosystem development.
In emerging sectors, OKX listed only four AI tokens, including DMAIL and GPT, three new tokens in the RWA sector, and three in DePIN. This reflects OKX’s relatively cautious approach toward newer, emerging sectors.
UPbit
UPbit’s key listing feature in 2024 was broad sector coverage and generally strong token performance. In 2024, UPbit listed UNI and BNT in the DEX sector. This suggests UPbit still has significant potential and room for growth in listing popular assets, as many mainstream or high-market-cap tokens remain unlisted and could be supported in the future. At the same time, this also reflectsUPbit 's rigorous listing review process, showing a preference for carefully screening assets with long-term potential.
OnUPbit, token gains across sectors were quite prominent. Tokens such as PEPE (Meme), AGLD (Game), DRIFT (DeFi), and SAFE (Infra) saw significant short-term gains, reaching up to 100% or even exceeding 150%. UNI rose 93.5% thirty days after listing compared to day one. This reflects South Korean users’ high recognition ofUPbit-listed projects.
Furthermore, from a public chain ecosystem perspective, ecosystems like Solana and TON were particularly favored. In addition, exchanges are deepening their support for their own blockchain ecosystems.For exampleBinance’s associated chains BSC and opBNB continue to receive stronger support. Similarly, Coinbase’s Base has become a key focus, accounting for nearly 40% of all new listings in 2024. OKX is also actively expanding its presence in the X Layer ecosystem.Moreover, Kraken’s planned L2 network Ink further indicates that leading exchanges are actively advancing on-chain infrastructure development.
Underlying this trend is exchanges’ exploration of transitioning from “off-chain” to “on-chain,” not only expanding their business scope but also strengthening competitiveness in the DeFi space. By supporting projects on their own chains, exchanges can promote ecosystem growth, enhance user stickiness, and generate higher revenue from new asset issuance and trading. This also implies that in the future, exchange listing strategies will increasingly favor projects within their own ecosystem to boost activity and market influence of their blockchain networks.
2.2 Time-Dimensional Analysis
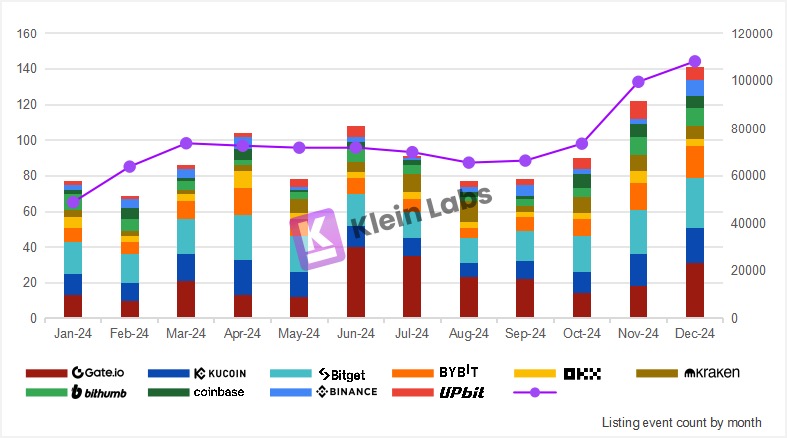
(Figure: Monthly Listing Volume Across Exchanges)
- The trend in listing volume closely aligns with BTC price movements.More listings occurred during BTC uptrends (February–March and August–December), while listing activity significantly declined during BTC consolidation or downtrends (April–July).
- Top-tier exchanges (Binance, UPbit) experienced smaller impacts during bear markets, and their listing share actually expanded during these periods, demonstrating stronger market dominance and counter-cyclical resilience.
- Bitget maintains relatively stable listing volume, with minimal impact from market fluctuations, whereas other exchanges exhibit greater variability in listing rhythm.This may be related to its more balanced listing strategy.
- Gate and KuCoin have higher listing frequencies, but their listing volume fluctuates significantly with market conditions, suggesting these exchanges may rely more on high liquidity from new projects during bull markets to attract users.
3. Trading Volume Analysis
3.1 Overall Trading Volume Across Exchanges
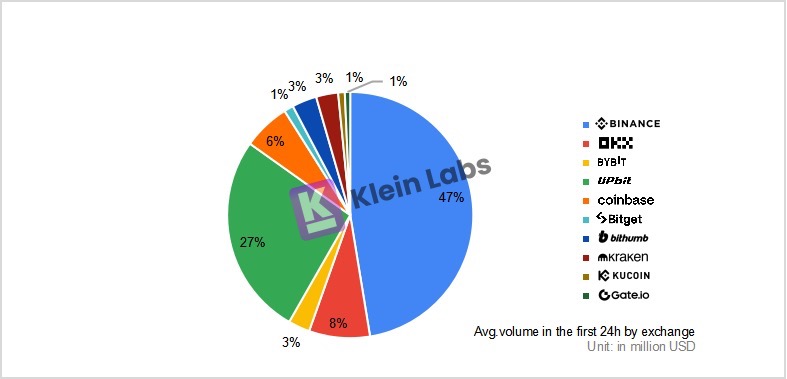
(Figure: Average 24-Hour Trading Volume Post-TGE on Each Exchange in 2024)
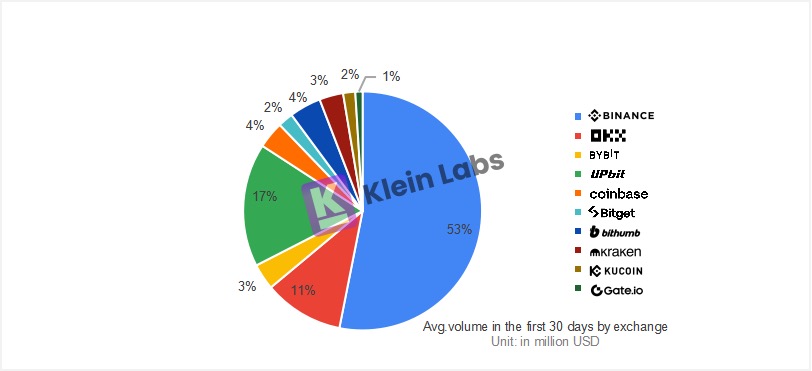
(Figure: Average 30-Day Trading Volume Post-TGE on Each Exchange in 2024)
- UPbit accounts for an extremely high share of trading volume within 24 hours of listing, even exceeding half of Binance’s volume, demonstrating its strong short-term market appeal and noticeable liquidity inflow. Although its share slightly declines after 30 days, it still maintains a high market share—approaching the combined share of OKX, Coinbase, and Bybit—indicating UPbit ’s pivotal role in the listing market.
- Binance and OKX show steady volume growth, maintaining leading market shares after 30 days, reflecting strong market recognition and deep liquidity. Binance accounts for 47% of volume within 24 hours and rises to 53% after 30 days, underscoring its enduring market dominance. OKX also sustains a high share after 30 days.
- Bybit performs well in both short- and long-term trading volume, showing consistent stability. Meanwhile, Bithumb sees a slight increase in market share after 30 days, indicating it not only retains early trading volume but also attracts additional liquidity. This suggests Bithumb’s growing competitiveness in the listing market.This indicates Bithumb’s growing competitiveness in the listing market.
Despite Korea’s reputation for favoring non-initial listings, the data above shows these projects still generate substantial trading volume. The core reason behind such high volume for non-initial listings on Korean exchanges lies in their unique market environment:
Market Closure and Liquidity Concentration in the Korean Market
- Market isolation:Due to strict KYC policies in South Korea, overseas users are largely unable to directly access Korean exchanges. This regional isolation creates a relatively closed trading ecosystem, where a large number of local users are accustomed to buying and selling on domestic exchanges. Consequently, liquidity is more concentrated within the Korean market.
- Exchange dominance:The Korean crypto market exhibits a highly monopolistic structure. UPbitcurrently holds 70%-80% of the Korean crypto market share, firmly leading the industry. Since UPbit established its leadership in 2021, Bithumb’s former top position has been replaced, reducing its market share to 15%-20%. Trading volume and liquidity are heavily concentrated among top platforms, showcasing a powerful capital aggregation effect.
Therefore, although a token may already be listed globally, its debut on the Korean market still triggers a “launch-like” effect, attracting massive attention and capital inflows.
High Ownership Rate and Capital Advantage in the Korean Crypto Market
- High penetration of crypto assets:South Korean investors hold cryptocurrencies at an exceptionally high rate, far exceeding other major markets. As of November 2024, over 15.59 million people in South Korea held crypto assets on local exchanges, representing over 30% of the country’s population. Many South Koreans already hold large amounts of digital assets and strongly prefer them as investment vehicles. Despite accounting for just 0.6% of the global population, South Korea contributes 30% of global cryptocurrency trading volume.
- Ample social capital:South Korea is a developed nation with a high GDP, resulting in abundant social capital and substantial investable funds, ensuring ample liquidity in the crypto market.
- Limited opportunities for young people in traditional industries:South Korea is a capitalist society dominated by chaebols, placing significant employment and living pressures on youth, with class rigidity intensifying the desire for wealth growth. Approximately 3.08 million young people aged 20–39 participate in virtual currency trading, accounting for 23% of this age group.
As of November 2024, South Koreans’ total holdings of cryptocurrencies reached 102.6 trillion KRW (approximately $69.77 billion), with daily trading volume climbing to 14.9 trillion KRW (about $10.13 billion).UPbitbecame the fastest-growing CEX in Q4 2024, increasing trading volume from $135.5 billion to $561.9 billion, a quarter-over-quarter increase of 314.8%. This surge reflects strong domestic demand for crypto assets and further confirms the high-trading-volume trend for non-initial listings on Korean exchanges.
4. Price Performance Analysis
4.1 Price Performance Comparison by Exchange
4.1.1 Overall Price Performance by Exchange
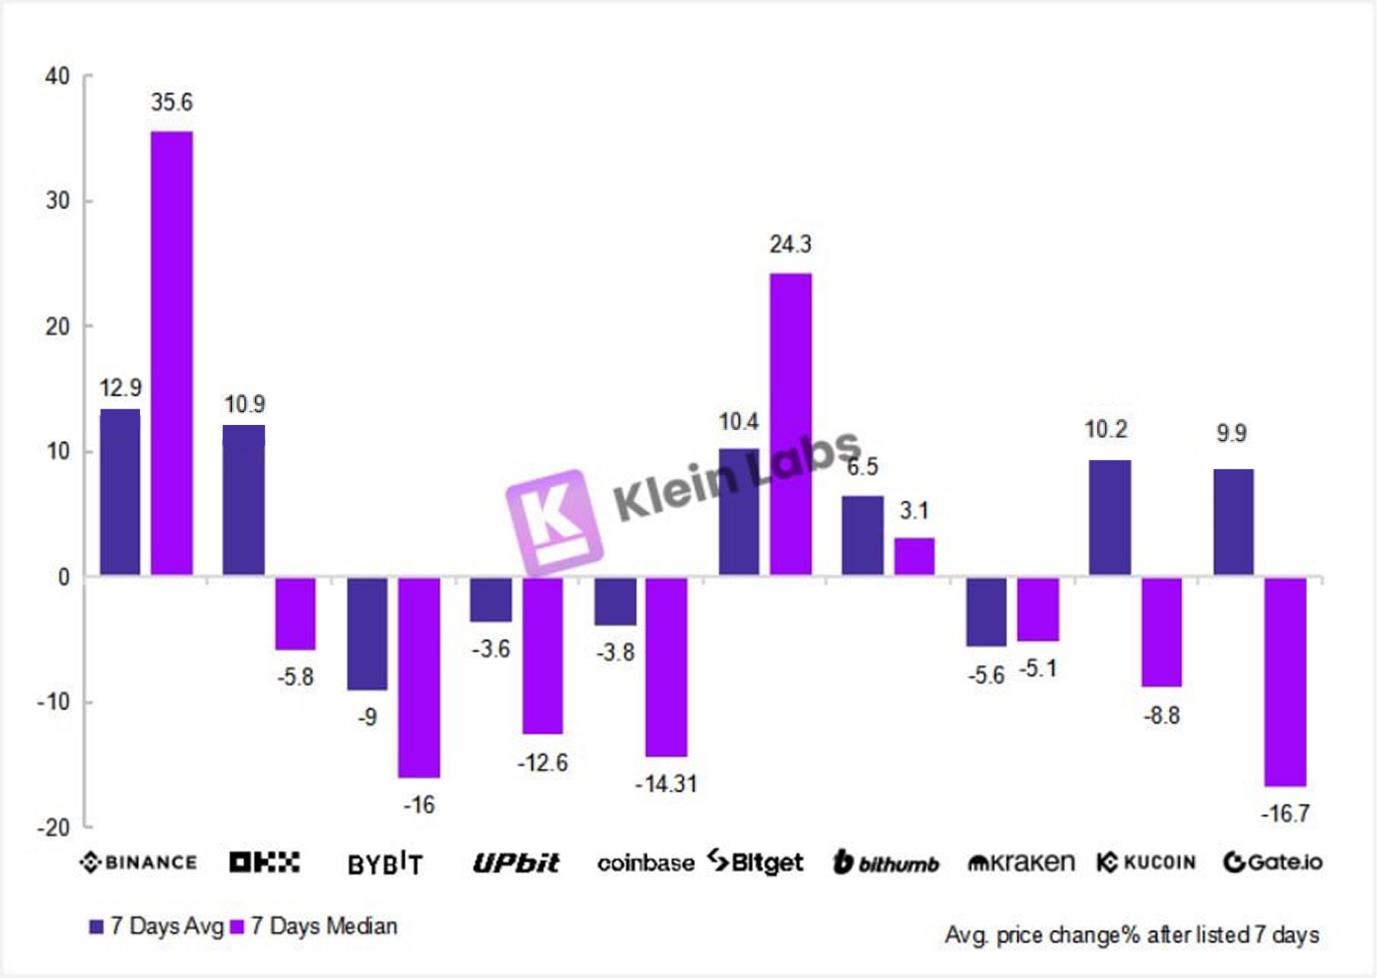
(Figure: Comparison of Average and Median Prices 7 Days Post-TGE Across Exchanges)
- Binance performs best, with both average and median values standing out. The top three exchanges by average return are Binance, OKX, and Bitget. Although OKX has a positive average, its median is negative, indicating large price swings among winning tokens and pronounced short-term volatility with evident outliers. Bitget stands out among peers, coming closest to the two leading exchanges. Its median return ranks second only to Binance and shows a notably high positive value, indicating a strong, consistent upward price trend for tokens listed on Bitget.
- Among mid-sized exchanges, Bithumb, Gate, and KuCoinperform relatively well.Among them, Bithumb shows the most balanced performance, with the smallest difference between absolute value and median, indicating lower price volatility and stable performance. However, both KuCoinand Gate have negative medians with high absolute values, suggesting low win rates and likely interference from several outlier surges.
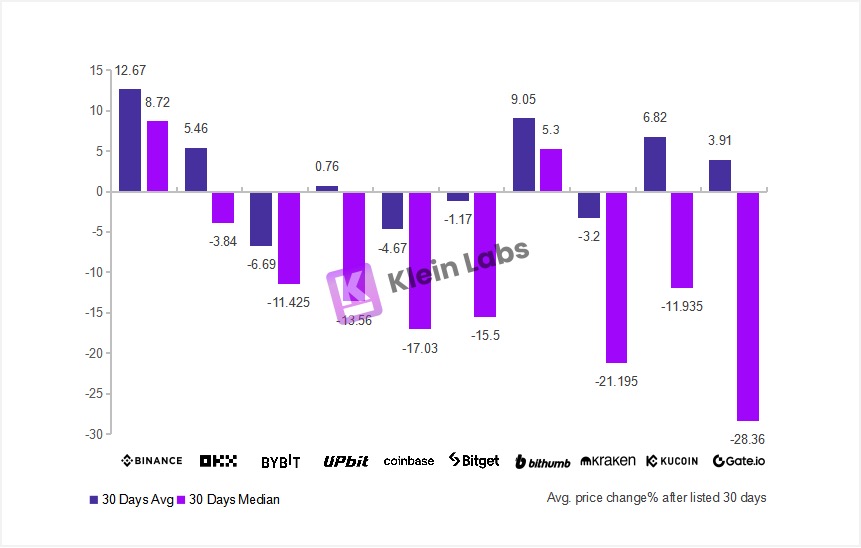
(Figure: Comparison of Average and Median Prices 30 Days Post-TGE Across Exchanges)
- By Day 30, medians have generally declined, indicating that after one month—especially for tokens with poor liquidity—speculative capital exits, selling pressure increases, and buying support weakens, leading to price drops. Gate may suffer from excessive listings, causing high market volatility and insufficient liquidity. This suggests the platform failed to attract sufficient stable capital inflows, and too many token choices dispersed liquidity, breaking the balance between buyers and sellers and causing sharp price declines.
- Binance is less affected, with only a slight decline in average, indicating that its listed tokens maintain strong market support and stable trading volume even after 30 days, with some tokens still having upside potential. As a top-tier exchange, Binance leverages its vast market liquidity and extensive user base to keep token prices elevated even amid broader market downturns post-month-one.
- Among mid-sized exchanges, Bithumb is the only one showing price increases after 30 days, with both 7-day average and median returns positive. This indicates Bithumb successfully attracted capital through good market liquidity and stability, demonstrating strong resilience and market appeal. This may be because Bithumb’s limited number of listings allows it to concentrate liquidity, maintaining high market activity and enabling better price performance for newly listed tokens.
4.1.2 Monthly Price Performance by Exchange
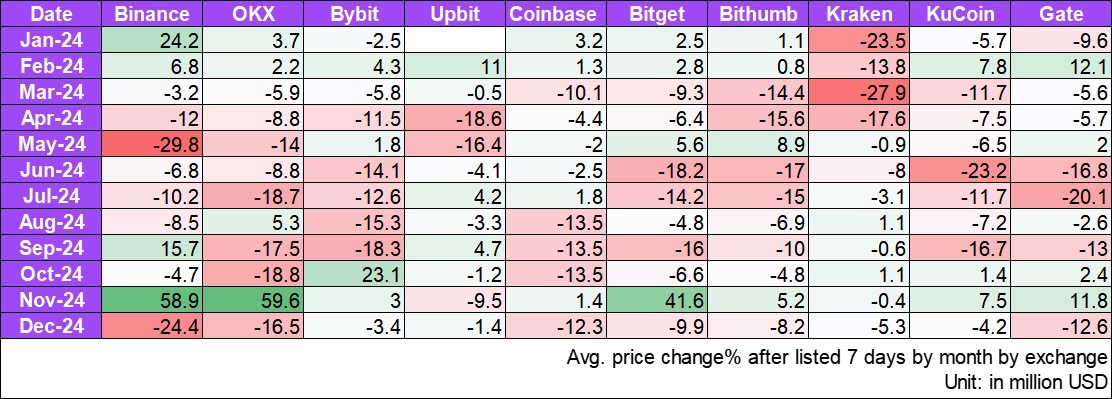
(Figure: Monthly Price Changes 7 Days Post-TGE by Exchange)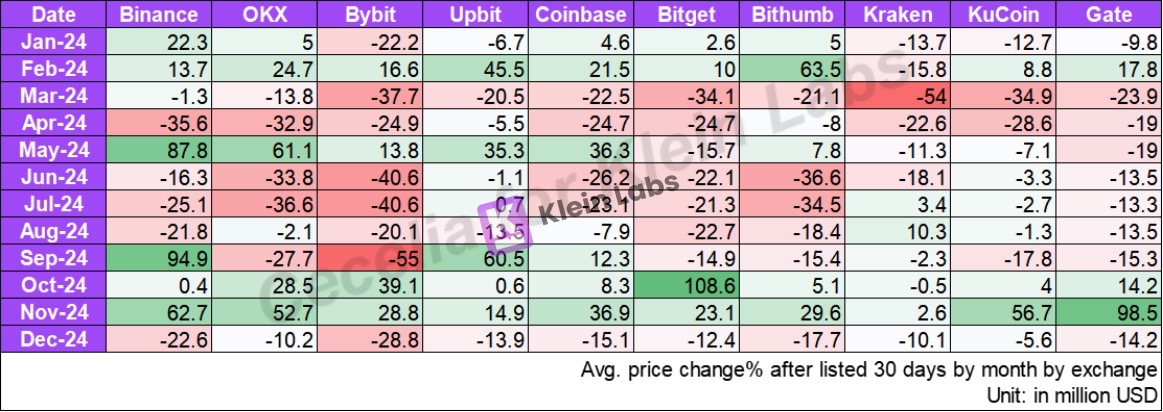
(Figure: Monthly Price Changes 30 Days Post-TGE by Exchange)
- Binance and UPbit show clear price advantages, highly sensitive to market sentiment. Their listings perform exceptionally well during bullish periods—for example, Binance achieved 30-day returns of 87.8% in May and 94.9% in September, while UPbit rose 60.5% in September—demonstrating strong pricing power. However, they are also highly volatile, suffering notable drawdowns in April and July, highlighting significant sensitivity to market mood.
Join TechFlow official community to stay tuned
Telegram:https://t.me/TechFlowDaily
X (Twitter):https://x.com/TechFlowPost
X (Twitter) EN:https://x.com/BlockFlow_News