

9 Key Metrics Reveal Peak Signals of the Crypto Bull Market
TechFlow Selected TechFlow Selected
9 Key Metrics Reveal Peak Signals of the Crypto Bull Market
These 9 key metrics can help you assess market positioning more scientifically.
Author: BTC_Chopsticks
How to accurately predict a bull market peak? These 9 key indicators are essential!
Precisely forecasting the top of a crypto bull market is nearly impossible, but you can use these data metrics to determine whether the market is approaching its peak.
If 5 signals appear simultaneously, you’ll either have accumulated substantial wealth—or be heading back to work at McDonald’s…
Now, let’s uncover the secrets of the end of a bull run.
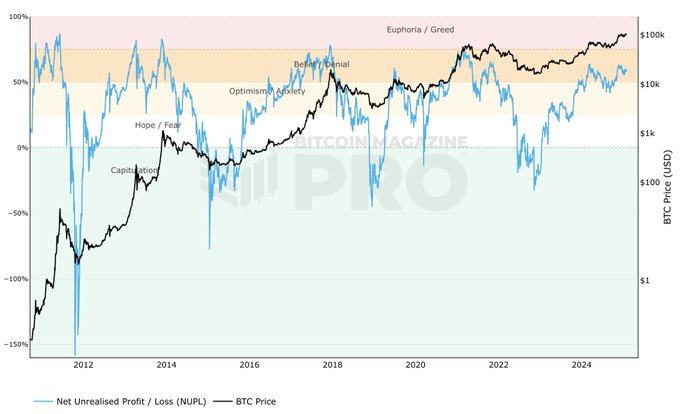
1. NUPL (Net Unrealized Profit/Loss)
Market sentiment indicator
When NUPL enters the euphoria/greed zone (above 75%), it usually means the market is nearing its peak, with investors becoming overly optimistic.
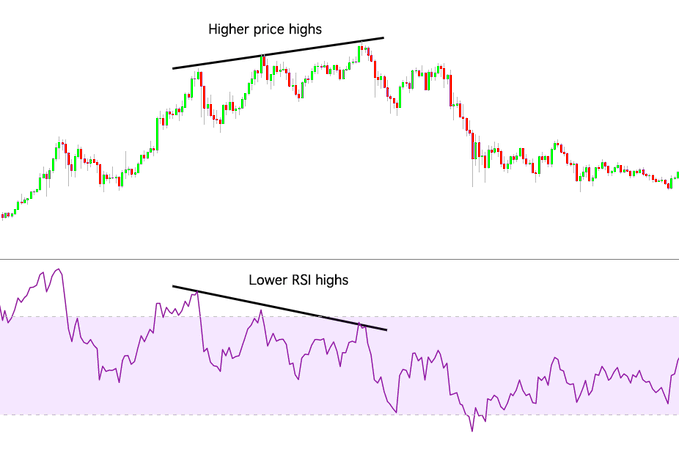
2. RSI (Relative Strength Index)
Short-term overbought signal
When RSI exceeds 90, the market is typically in an extremely overbought state. Historical data shows that peaks usually form within 4–7 weeks, followed by a correction.
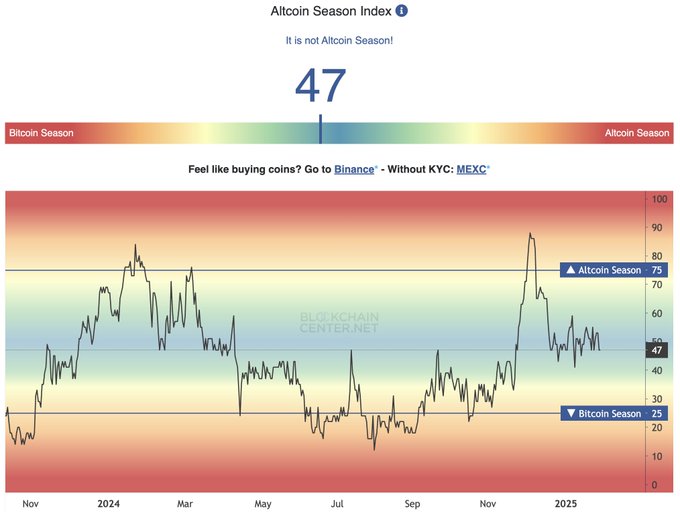
3. Altcoin Season Index
Altcoins vs Bitcoin
When the index exceeds 85, it indicates that altcoins as a whole are outperforming Bitcoin—typically signaling a market entering a phase of frenzy.
4. MVRV Z-Score (Market Value vs Realized Value)
Determine if the market is extremely overvalued
When the MVRV Z-Score exceeds 6, it suggests the market may be nearing its peak, warranting caution against potential pullbacks.

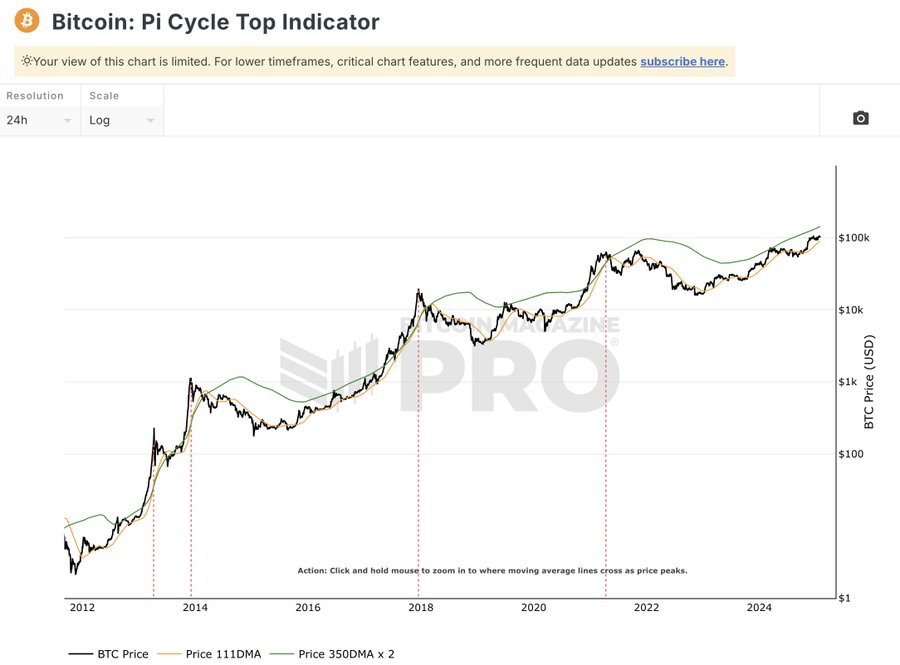
5. Pi Cycle Top Indicator
Precisely identify Bitcoin bull market peaks
This indicator has successfully predicted major Bitcoin price highs across multiple cycles.
When it issues a warning signal, it means the bull market is about to top out.
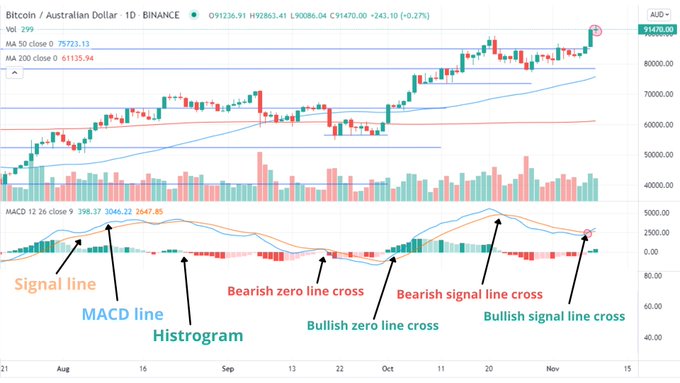
6. MACD (Moving Average Convergence Divergence)
Trend change and momentum signal
When MACD generates a death cross, it indicates weakening market momentum and a potential trend reversal.
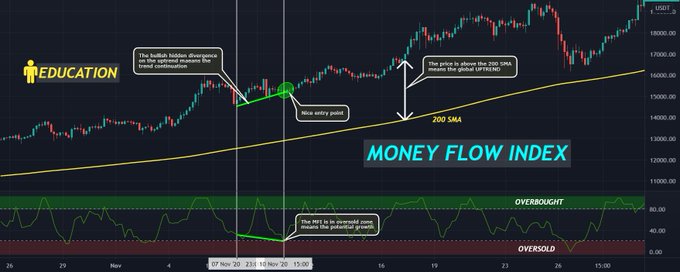
7. MFI (Money Flow Index)
Buy/sell pressure monitor
Similar to RSI, but MFI incorporates trading volume data. When it shows extreme overbought conditions, it often signals a market top.
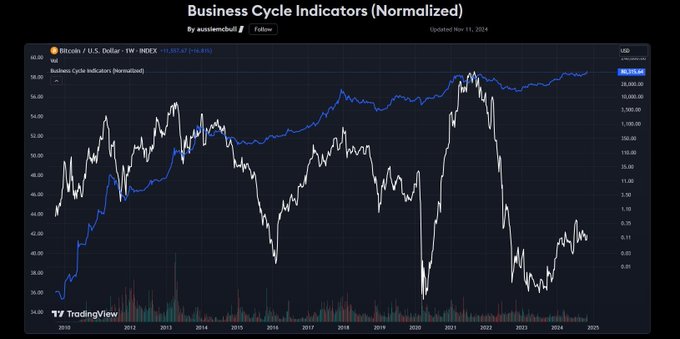
8. Composite Business Cycle Index
Macroeconomic impact
When this index exceeds 50, it indicates the market may be approaching its peak phase.
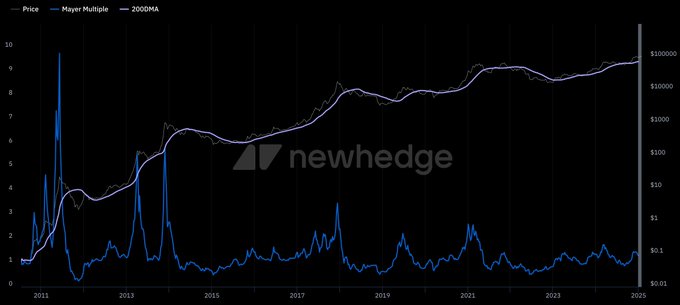
9. Mayer Multiple
Price vs 200-day moving average
Historical data shows that when the Mayer Multiple reaches 2.4, Bitcoin is typically at the height of a bull market.
Conclusion
While market tops are difficult to predict precisely, these 9 key indicators can help you scientifically assess the market's position. A bull market surge can make you rich, but without a clear exit strategy, it could also wipe out your gains overnight.
Join TechFlow official community to stay tuned
Telegram:https://t.me/TechFlowDaily
X (Twitter):https://x.com/TechFlowPost
X (Twitter) EN:https://x.com/BlockFlow_News


