

Grayscale Report: Decoding the Crypto Bull Market Cycle — How Long Can the Rally Continue?
TechFlow Selected TechFlow Selected
Grayscale Report: Decoding the Crypto Bull Market Cycle — How Long Can the Rally Continue?
Grayscale Research believes that current market indicators suggest the cryptocurrency market is in the middle stage of the cycle.
Author: Zach Pandl & Michael Zhao
Translation: TechFlow
-
Historically, cryptocurrency valuations have often followed a clear four-year cycle, experiencing sustained phases of price increases and declines. Grayscale Research believes investors can track the evolution of crypto market cycles—and optimize risk management strategies—by monitoring a range of blockchain-based metrics and other data.
-
As cryptocurrencies mature into a more established asset class, the market is undergoing significant changes. For example, the launch of spot exchange-traded products (ETPs) for Bitcoin and Ethereum has further lowered the barrier to entry for investors. Meanwhile, the new U.S. Congress may bring greater regulatory clarity to the industry. These developments suggest that crypto valuations may gradually move away from the recurring four-year cycle seen in earlier history.
-
Nevertheless, Grayscale Research believes current market indicators place the crypto market in the middle phase of its cycle. As long as this asset class remains supported by fundamental factors such as expanding use cases and stable macroeconomic conditions, the bull market could extend into 2025 and beyond.
Like many physical commodities, Bitcoin’s price does not fully follow a “random walk” pattern. Instead, data shows a statistical momentum effect: upward trends tend to persist for a period, as do downward ones. Over longer timeframes, Bitcoin’s price exhibits cyclical fluctuations around a long-term rising trend (see Figure 1).
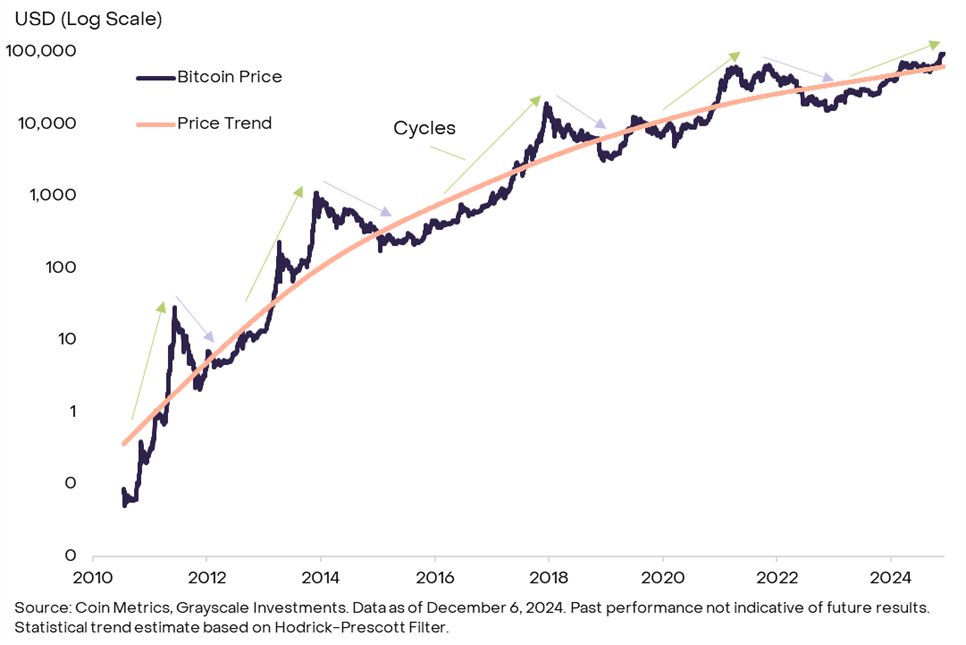
Figure 1: Bitcoin price fluctuates cyclically around a long-term upward trend
Each past price cycle has had unique drivers, so future performance will not perfectly replicate prior experience. Moreover, as Bitcoin matures and gains broader acceptance among traditional investors—and as the supply impact of the four-year halving event diminishes—the cyclical nature of Bitcoin’s price may change or even disappear. Nonetheless, studying past price cycles can still offer investors valuable insights into Bitcoin’s typical statistical behavior, aiding in better risk management.
Momentum Measurement
Figure 2 illustrates Bitcoin’s price performance during the upswing phase of each historical cycle. For comparison, prices are normalized to 100 at the cycle low (the start of the uptrend) and tracked through to the peak (the end of the uptrend). Figure 3 presents the same data in tabular form.
Bitcoin’s early price cycles were relatively short and steep: the first lasted less than a year, the second about two years. In both cycles, prices rose over 500 times from the prior cycle low. The following two cycles each lasted under three years. From January 2015 to December 2017, Bitcoin increased over 100-fold; from December 2018 to November 2021, it rose approximately 20-fold.
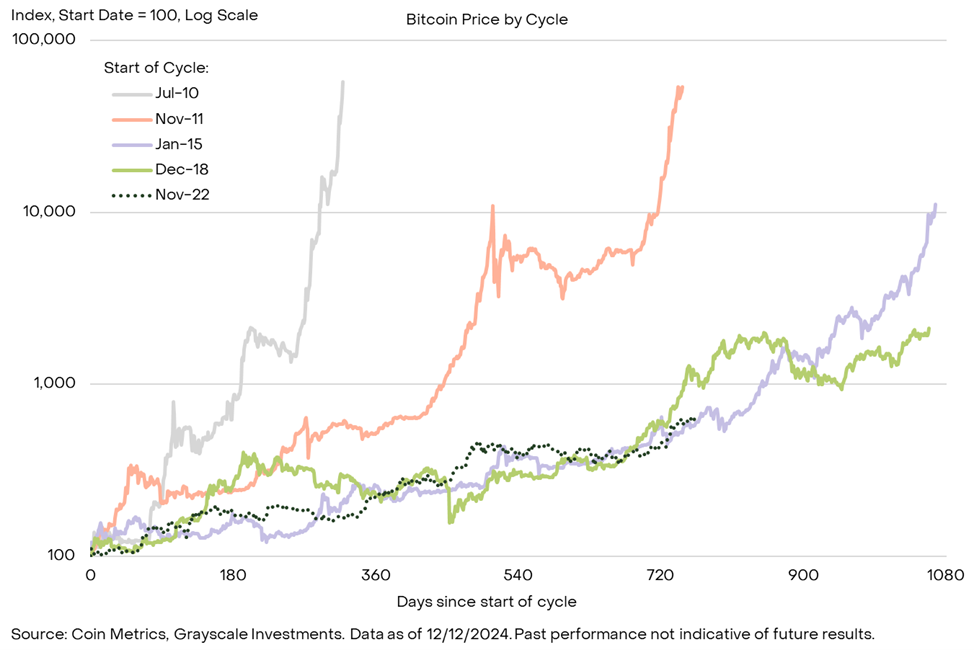
Figure 2: Current Bitcoin price trajectory closely resembles the most recent two market cycles
After peaking in November 2021, Bitcoin fell to a cyclical low of around $16,000 in November 2022. Since then, Bitcoin has entered a new phase of price appreciation, now lasting over two years. As shown in Figure 2, the recent rally mirrors the trajectory of the previous two Bitcoin cycles, both of which saw continued gains for about a year before reaching their peaks. In terms of returns, Bitcoin has gained roughly 6x in this cycle—an impressive gain, but significantly lower than the returns observed in the past four cycles. Overall, while we cannot predict whether future performance will mirror past patterns, Bitcoin’s history suggests there may still be room for further growth in both duration and magnitude in this bull market.
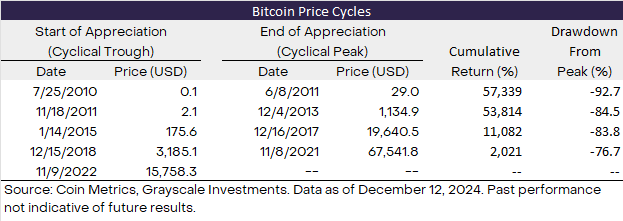
Figure 3: Four distinct cycles in Bitcoin price history
Analysis of Key Metrics
Beyond assessing past cycle performance, investors can use various blockchain-based indicators to gauge the maturity of the current Bitcoin bull market. These typically include: Bitcoin’s price relative to buyer cost basis, the scale of new capital inflows into the Bitcoin market, and Bitcoin’s price relative to miner revenues.
One commonly used metric is the MVRV ratio—the Market Value (MV) of Bitcoin (each BTC valued at the current market price) divided by its Realized Value (RV) (each BTC valued at its last on-chain transaction price). The MVRV ratio reflects the degree to which Bitcoin’s market cap trades at a premium to the aggregate cost basis of holders. In each of the past four cycles, the MVRV ratio reached at least 4 (see Figure 4). Currently, it stands at 2.6, suggesting potential for further upside in this cycle. However, the peak MVRV ratio has declined in each successive cycle, meaning prices may top out before this metric reaches 4.
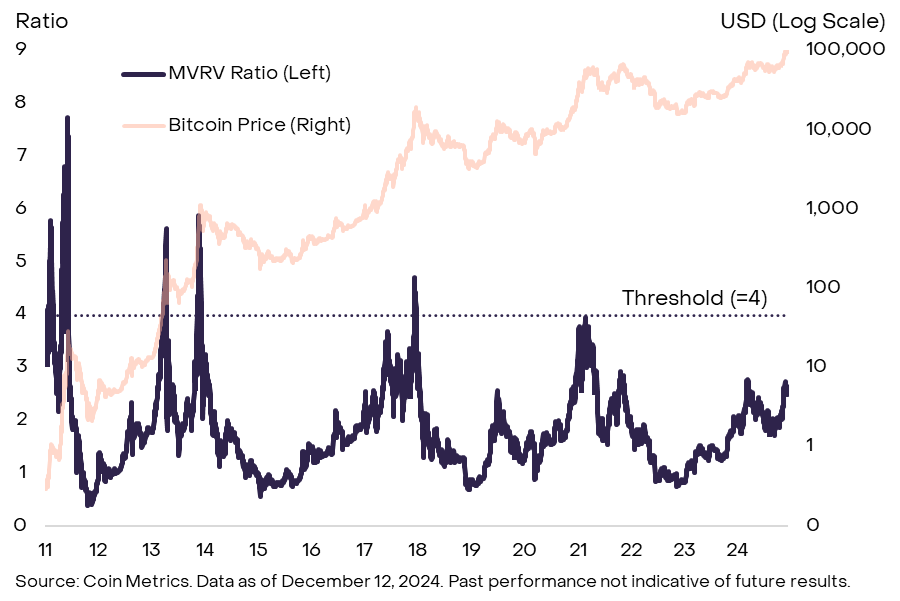
Figure 4: MVRV ratio currently at intermediate levels
Other on-chain metrics focus on new capital entering the Bitcoin ecosystem—a phenomenon often referred to by seasoned crypto investors as HODL Waves. This framework suggests price rises may occur when new money buys Bitcoin from long-term holders at incrementally higher prices. Grayscale Research prefers measuring this using the ratio of Bitcoin supply that has moved on-chain within the past year to the total circulating supply (see Figure 5). In each of the past four cycles, this ratio reached at least 60%, meaning at least 60% of the circulating supply transacted on-chain within a one-year window during the uptrend. Currently, the ratio is around 54%, indicating more Bitcoin may yet change hands on-chain before prices peak.
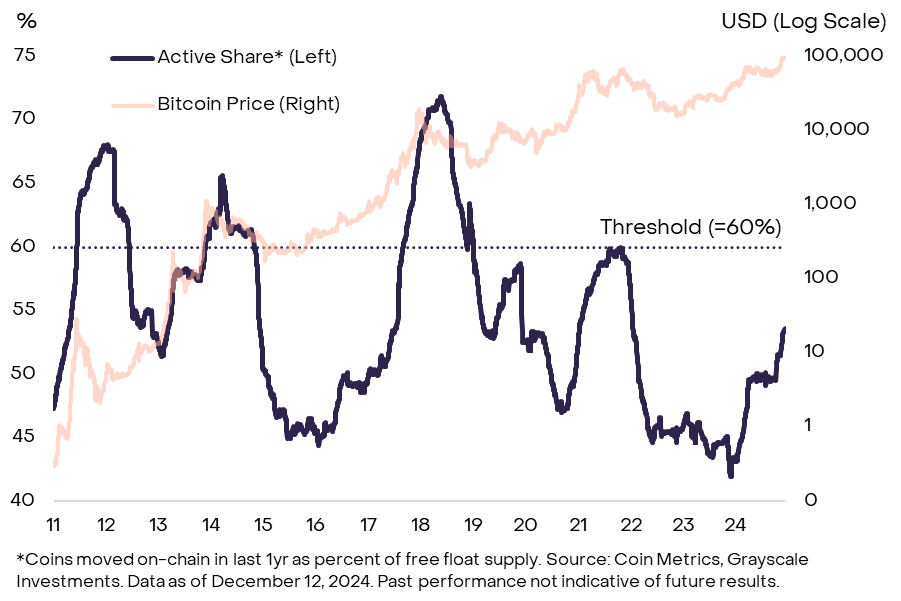
Figure 5: Less than 60% of circulating Bitcoin supply has been active in the past year
In addition, some cyclical indicators focus on Bitcoin miners, who are core participants responsible for securing the network. One common metric is the Miner Capitulation Threshold (MCTC) ratio—the value of miners’ accumulated Bitcoin assets relative to a “heat capital” threshold. Intuitively, when miners’ holdings reach a critical level, they may begin taking profits. Historically, Bitcoin prices have tended to peak in a given cycle when the MCTC ratio exceeds 10 (see Figure 6). Currently, the MCTC ratio is around 6, suggesting the current cycle may still be in its middle phase. However, like the MVRV ratio, the MCTC peak has declined in each successive cycle, so prices may peak before this indicator reaches 10.
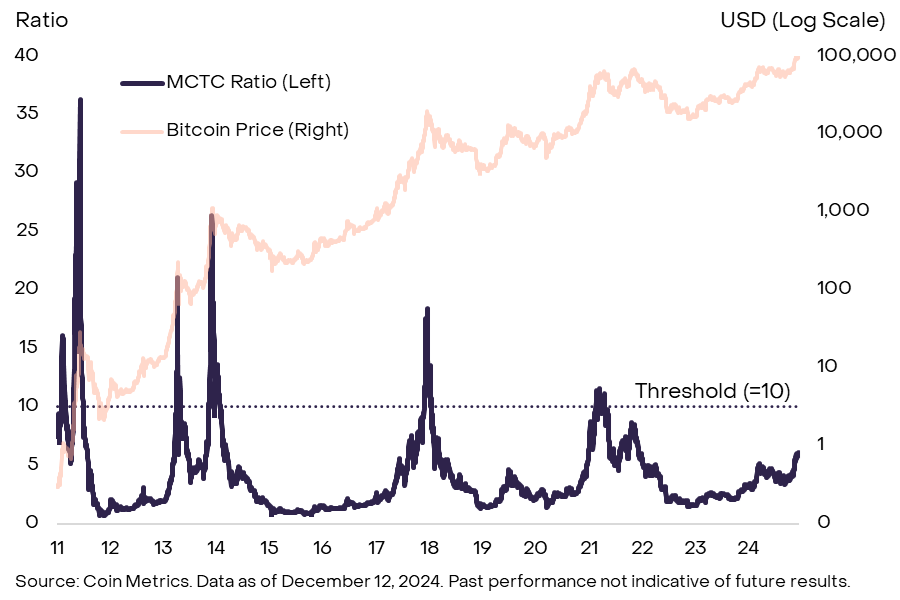
Figure 6: Miner-based indicators also remain below historical thresholds
There are numerous on-chain metrics, and measurements may vary slightly across different data sources. Moreover, these tools only offer rough comparisons between the current rally and past cycles, and cannot guarantee that historical relationships will hold in the future. Nevertheless, collectively, key Bitcoin cycle indicators remain below their historical peak levels, suggesting that if fundamental support persists, the current bull market may continue.
Looking Beyond Bitcoin
The crypto market extends far beyond Bitcoin, and signals from other sectors can also provide clues about the state of the market cycle. We believe these signals may be especially important over the coming year due to Bitcoin’s relative performance against other crypto assets. In the past two market cycles, Bitcoin dominance (Bitcoin’s share of total crypto market capitalization) typically peaked around two years into the bull market (see Figure 7). Recently, Bitcoin dominance has begun to decline—a trend that again appears near the two-year mark of the current cycle. If this trend continues, investors should look more broadly at other indicators to assess whether crypto valuations are approaching a cyclical high.
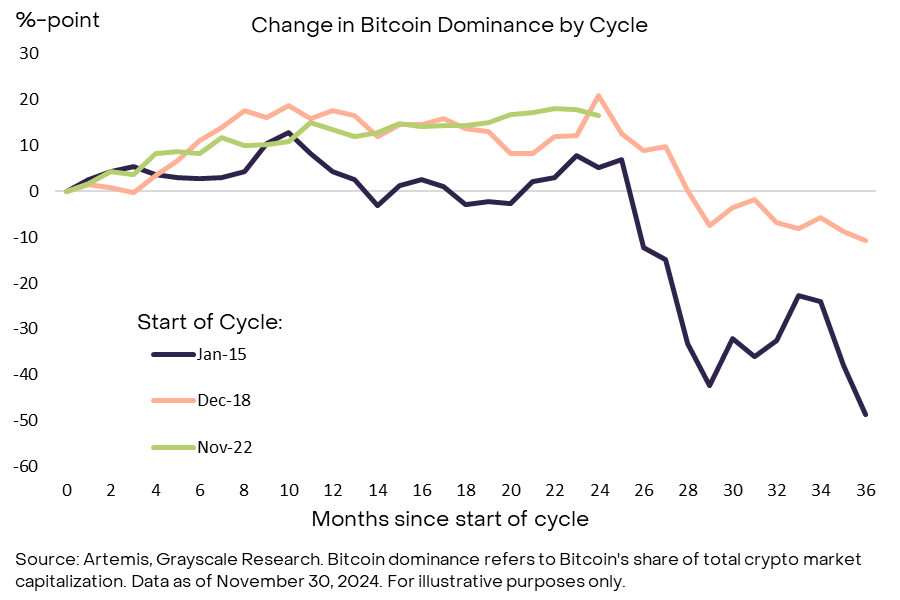
Figure 7: Bitcoin dominance declined in the third year of the past two cycles
For instance, investors can monitor funding rates—the cost of holding long positions in perpetual futures contracts. When speculative traders increase their leverage demand, funding rates tend to rise. Thus, funding rates reflect the overall level of leveraged long exposure in the market. Figure 8 shows the weighted average funding rate for the 10 largest non-Bitcoin crypto assets (i.e., altcoins). Currently, funding rates are positive, indicating strong demand for leveraged long positions, although they dipped slightly during last week’s market pullback. Even at local highs, however, current funding rates remain below earlier 2024 levels and prior cycle peaks. Therefore, we view current funding rates as reflecting moderate speculative long positioning—not necessarily signaling the end of the market cycle.
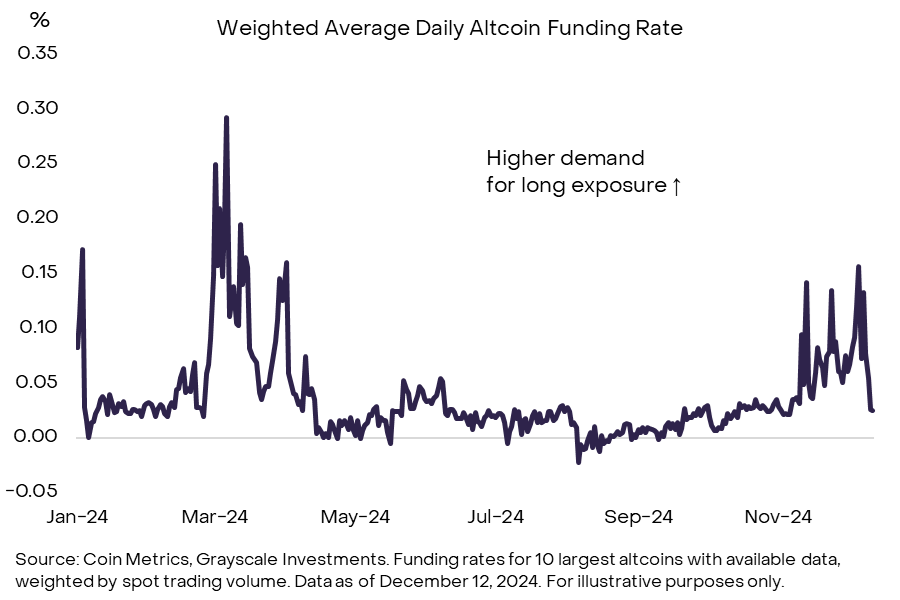
Figure 8: Altcoin funding rates indicate moderate speculative long positioning
In contrast, altcoin perpetual futures open interest has reached relatively high levels. Prior to a major liquidation event on December 9, altcoin open interest reached nearly $54 billion across three major perpetual futures exchanges (see Figure 9). This indicates a large scale of speculative long positions in the market. Following the large-scale liquidations earlier this week, altcoin open interest dropped by about $10 billion but remains elevated. Typically, high levels of speculative long exposure signal a later stage of the market cycle, making this metric worthy of continued monitoring.
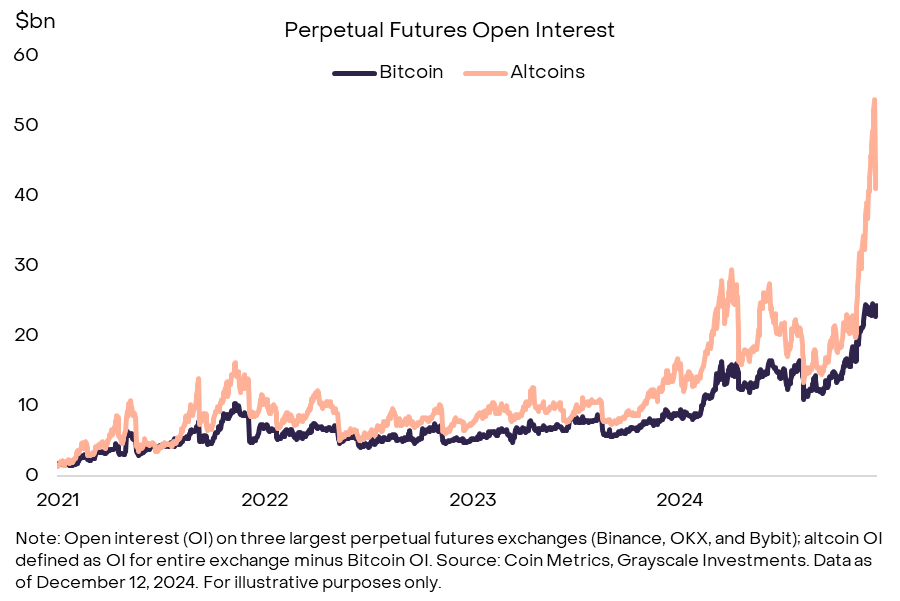
Figure 9: Altcoin open interest reached high levels before recent liquidations
Markets Are Still Evolving
Since Bitcoin’s inception in 2009, the digital asset market has made significant progress, and today’s crypto bull market differs in many ways from past episodes. The most notable change is the U.S. approval of spot Bitcoin and Ethereum exchange-traded products (ETPs), which have brought $36.7 billion in net capital inflows and integrated these assets into more traditional investment portfolios. Additionally, recent U.S. elections may lead to clearer regulatory frameworks, solidifying digital assets’ position within the world’s largest economy—marking a stark contrast to past periods when the long-term viability of crypto assets was frequently questioned. For these reasons, Bitcoin and other crypto assets may no longer follow the recurring four-year cycle pattern of their early history.
At the same time, Bitcoin and many other crypto assets can be viewed as digital commodities, similar to traditional commodities, whose prices may exhibit certain momentum effects. As such, analysis of on-chain metrics and altcoin position data remains highly relevant for investor risk management decisions. Grayscale Research believes the current constellation of indicators aligns with the mid-phase of the crypto market cycle—for example, the MVRV ratio is well above its cyclical lows but has not yet reached prior market peak levels. As long as fundamentals—such as adoption growth and broader macroeconomic conditions—remain supportive, the bull market could continue.
Join TechFlow official community to stay tuned
Telegram:https://t.me/TechFlowDaily
X (Twitter):https://x.com/TechFlowPost
X (Twitter) EN:https://x.com/BlockFlow_News


