Bitcoin's four-year cycle has ended, replaced by a more predictable two-year cycle
TechFlow Selected TechFlow Selected
Bitcoin's four-year cycle has ended, replaced by a more predictable two-year cycle
Exploring alternative frameworks to assess cycles of prosperity and recession in the future era.
Author: Jeff Park
Translation: AididiaoJP, Foresight News
Bitcoin previously followed a four-year cycle, which can be described as a combination of mining economics and behavioral psychology.
Let us first review what this cycle means: each halving mechanically cuts new supply and tightens miner profit margins, forcing weaker participants to exit the market and thereby reducing selling pressure. This in turn reflexively pushes up the marginal cost of new BTC, leading to a slow but structural supply contraction. As this process unfolds, enthusiastic investors anchor on the predictable halving narrative, creating a psychological feedback loop. The cycle goes: early positioning, price increases, media attention spreading virally, retail FOMO, eventually leading to leveraged mania and ending in a crash. This cycle worked because it combined programmed supply shocks with reflexive herd behavior that seemed reliably triggered.
But this was the past Bitcoin market.
Because we know the supply side of the equation is now less effective than ever before.
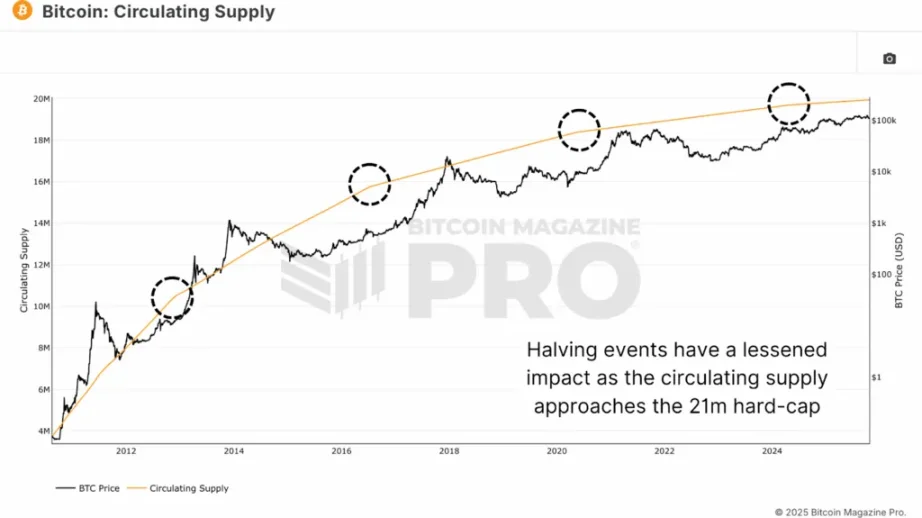
Bitcoin's circulating supply and diminishing marginal inflation impact
So what should we expect going forward?
I propose that in the future, Bitcoin will follow a "two-year cycle," which can be described as a combination of fund manager economics and behavioral psychology dominated by ETF flows. Of course, I make three arbitrary and controversial assumptions here:
-
Investors are evaluating their Bitcoin investments within a one- to two-year time frame (not longer, as this reflects how most asset management firms operate in the context of liquid fund management—these are not private equity/venture capital closed-end structures holding Bitcoin), and it bluntly assumes financial advisors and registered investment advisors also operate under similar constraints;
-
In terms of "new sources of liquidity injection," professional investor flows through ETFs will dominate Bitcoin’s liquidity, making ETFs the proxy indicator to track;
-
The selling behavior of veteran whales remains unchanged / is not considered in the analysis, even though they are now the largest determinants of supply in the market.
In asset management, there are several key factors influencing fund flows. The first is common ownership risk and year-to-date P&L.
Common ownership risk refers to the concern that "everyone holds the same thing," so when liquidity turns one-way, everyone needs to execute the same trade, amplifying potential moves. We typically observe this in sector rotation (thematic concentration), short squeezes, pairs trading (relative value), and failed M&A arbitrage/event-driven scenarios. But we also commonly see this across multi-asset domains, such as in CTA models, risk parity strategies, and certainly in fiscal dominance trades where equities represent inflation-hedging assets. These dynamics are difficult to model and require substantial proprietary position data, making them inaccessible or hard to understand for ordinary investors.
What is easier to observe is point two: year-to-date P&L.
This reflects how the asset management industry operates on a calendar-year basis, as fund fees are annually standardized based on performance at December 31. This is especially evident for hedge funds, which need to standardize their carried interest by year-end. In other words, when volatility rises near year-end and fund managers lack sufficient "locked-in" gains earlier in the year as a buffer, they become more sensitive to selling their highest-risk positions. It determines whether they get another chance in 2026—or get fired.
In "Flows, Price Pressure, and Hedge Fund Returns," Ahoniemi & Jylhä documented that capital inflows mechanically boost returns, which then attract additional inflows, until the cycle eventually reverses—with the full reversal process taking nearly two years. They also estimate that about one-third of reported hedge fund returns can actually be attributed to these flow-driven effects rather than manager skill. This provides clear insight into underlying cyclical dynamics—returns are shaped largely by investor behavior and liquidity pressures, not just by the performance of underlying strategies, factors that now determine the latest flows into Bitcoin as an asset class.
With this in mind, consider how a fund manager might evaluate a position like Bitcoin. Facing their investment committee, they would likely argue that Bitcoin has delivered an approximate 25% annualized compound growth rate, requiring over 50% compounded growth within that timeframe to justify continued allocation.
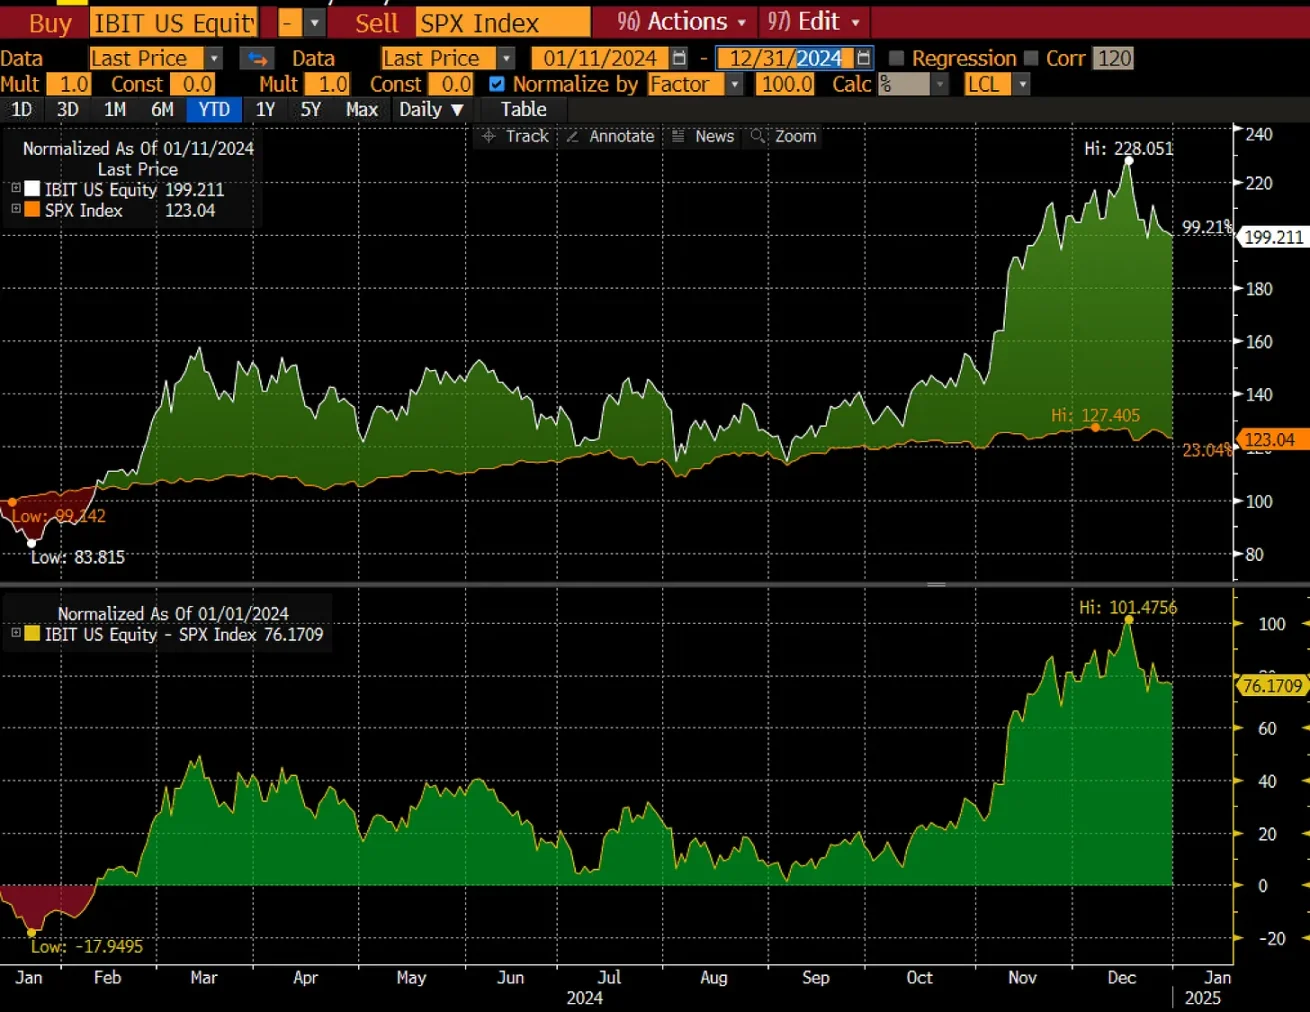
In Scenario 1 (inception through end of 2024), Bitcoin rose 100% in one year—so that’s good. Assuming Saylor’s proposed 30% annualized return over the next 20 years represents the "institutional threshold," such a year effectively front-loads 2.6 years of performance.
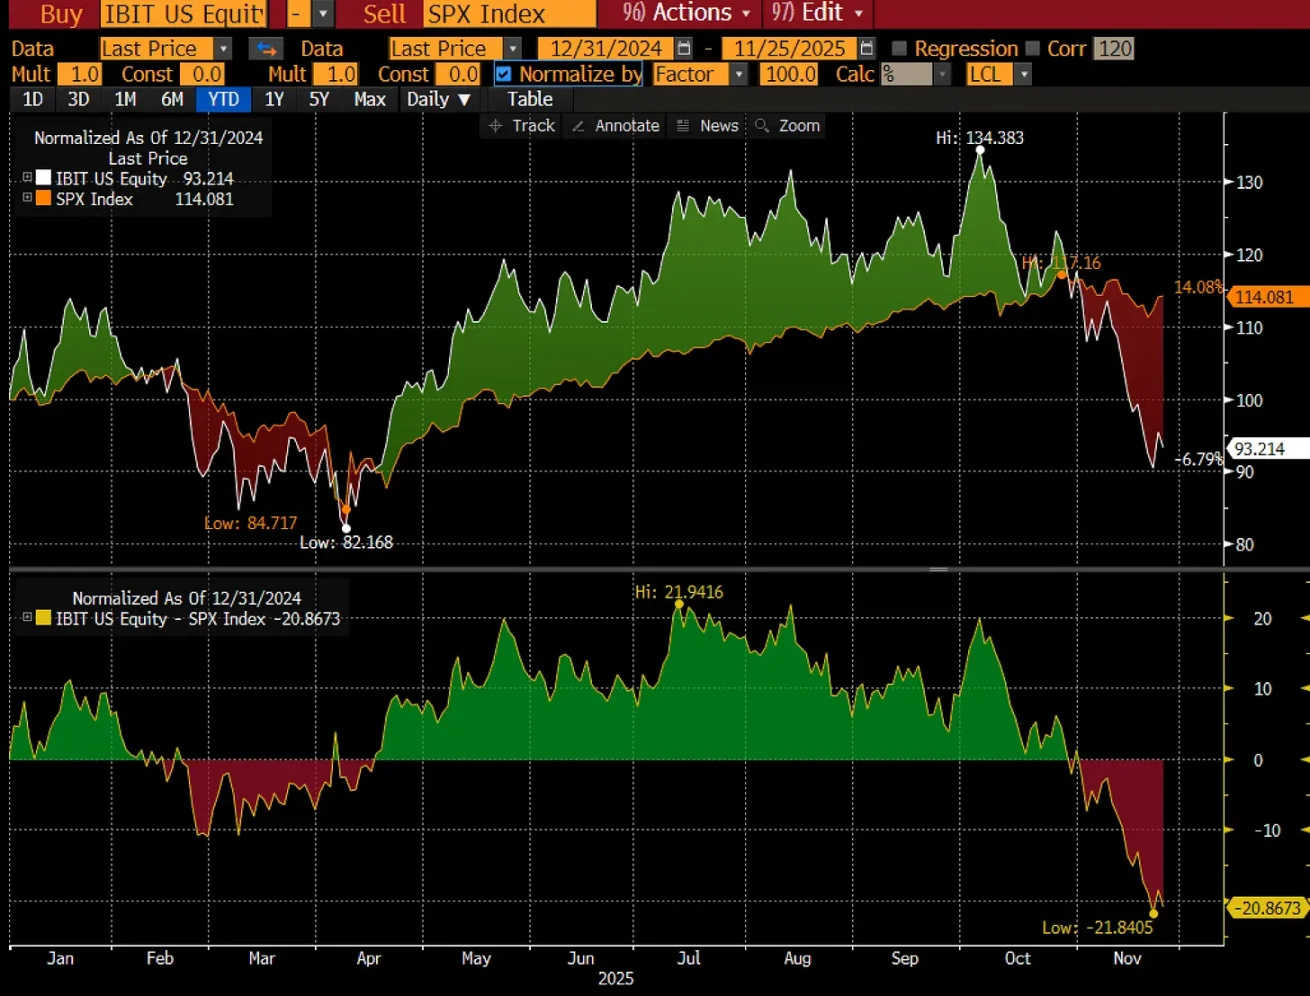
But in Scenario 2 (beginning of 2025 to present), Bitcoin is down 7%—not so good. These are investors who entered on January 1, 2025, and are now underwater. They now need either over 80% returns in the coming year, or 50% returns over the next two years, to reach their threshold.
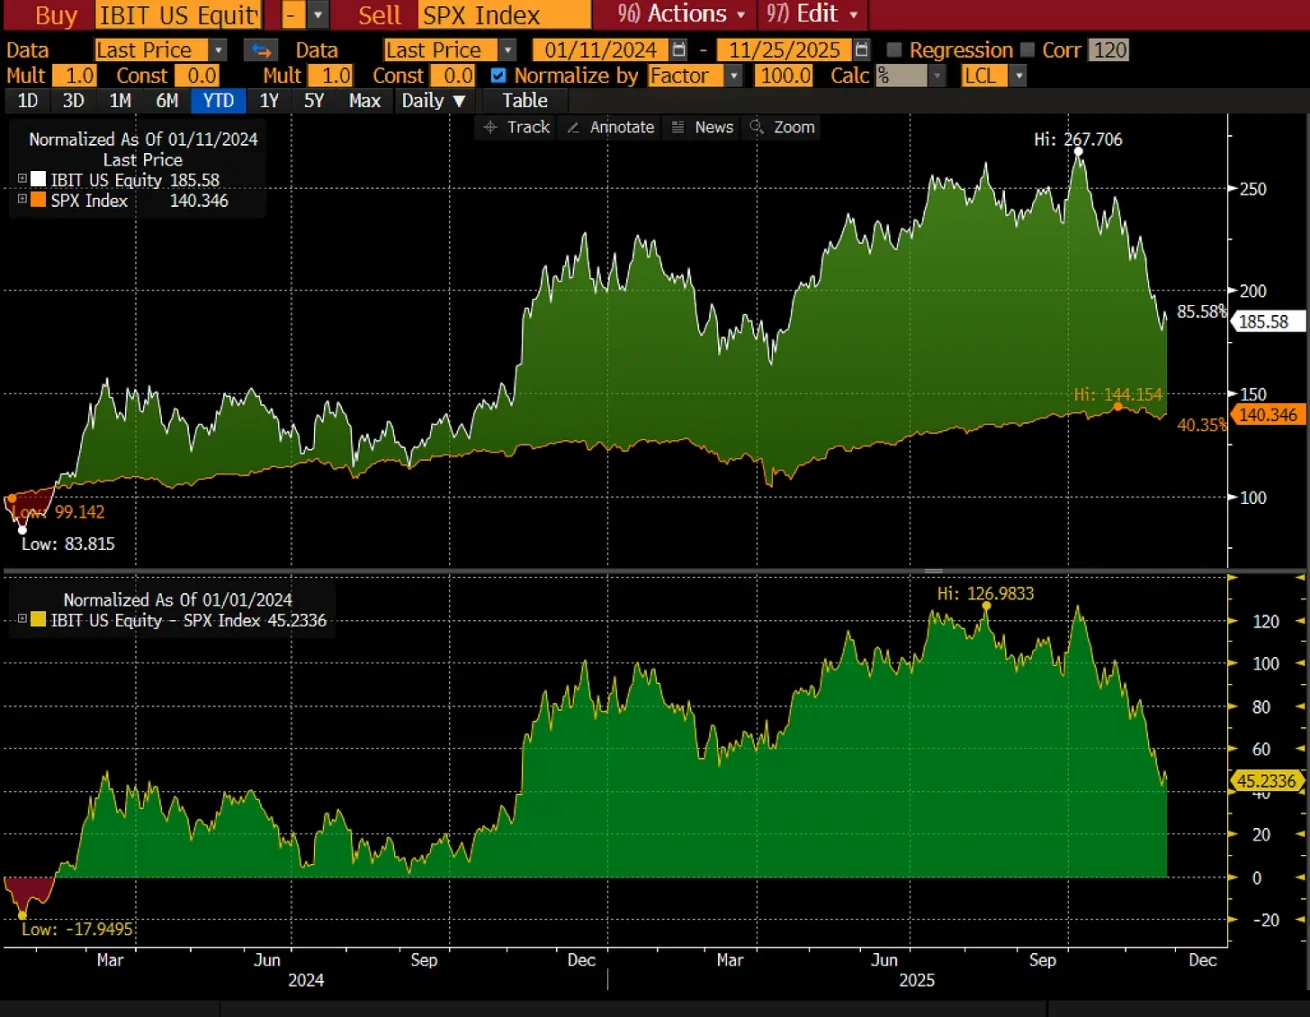
In Scenario 3, investors who have held Bitcoin from inception to now/end of 2025 have gained about 85% over roughly two years. These investors slightly exceed the 70% return needed to meet the 30% annualized threshold within this timeframe, but not as much as they could have had they exited at the peak observed on December 31, 2025—posing them a critical question: do I sell now to lock in profits, realize my performance, claim victory, or let it run longer?
At this point, rational investors in the fund management business would consider selling. This is due to the reasons I mentioned above:
-
Fee standardization
-
Reputation protection
-
The combination of demonstrating "risk management" as a premium service with a sustained flywheel effect
So what does this mean?
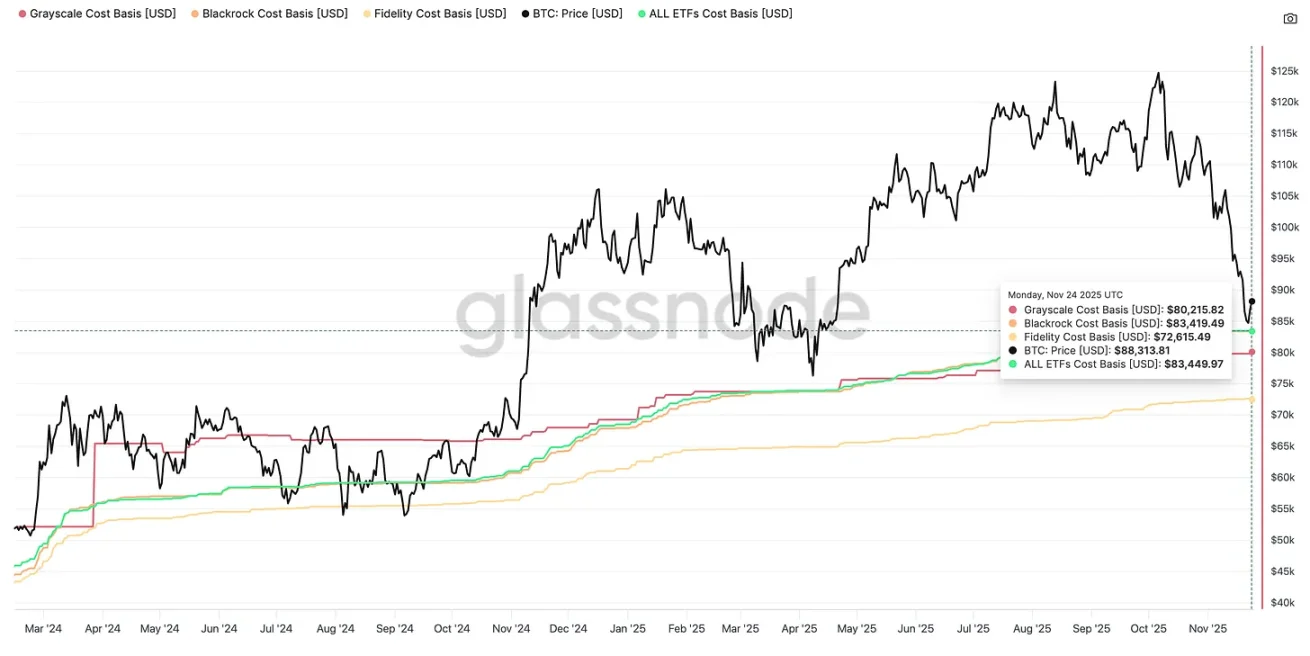
Bitcoin is now approaching an increasingly important price level of $84,000—the total cost basis of all inflows into ETFs since inception.
But viewing only this picture is incomplete. Look at this chart from CoinMarketCap showing monthly net flows since inception.
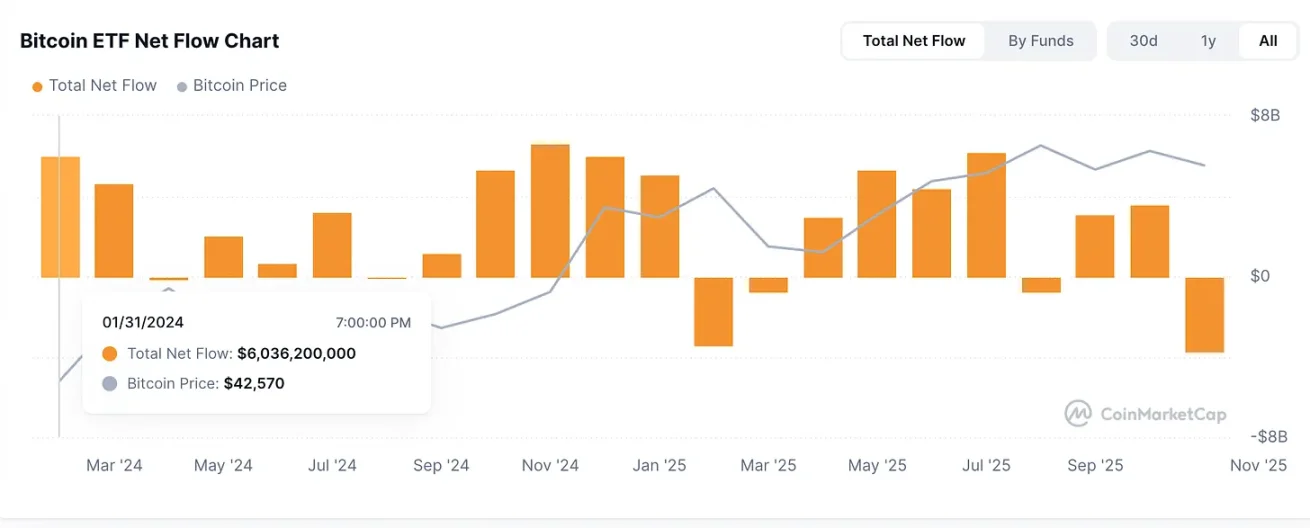
You can see here that most positive P&L comes from 2024, while nearly all ETF flows in 2025 are underwater (except March). Given that the largest monthly inflow occurred in October 2024, when Bitcoin was already priced at $70,000, this becomes significant.
This could be interpreted as a bearish pattern: investors who deployed the most capital in late 2024 but haven’t yet reached their return thresholds will face decision points as their two-year horizons approach, while those investing in 2025 will need exceptional performance in 2026 to catch up—potentially prompting preemptive stop-loss exits, especially if they believe better returns are available elsewhere. In other words, if we enter a bear market, it won’t be because of the four-year cycle, but because the two-year cycle never allowed new institutional capital to enter at appropriate entry points relative to exiting investors taking profits.
October 2024 closed at $70,000. November 2024 closed at $96,000. This means that when their one-year mark arrives, their thresholds are set at $91,000 and $125,000 respectively (I admit this is overly crude, as it doesn't account for intra-month prices and requires more proper adjustment). If you apply a similar method to June 2025 (the month with the largest year-to-date inflow), the $107,000 price implies a $140,000 threshold by June 2026. You either hit it successfully or fail again. By now, you likely intuitively grasp that the comprehensive analysis involves combining all these flows with time-weighted averages.
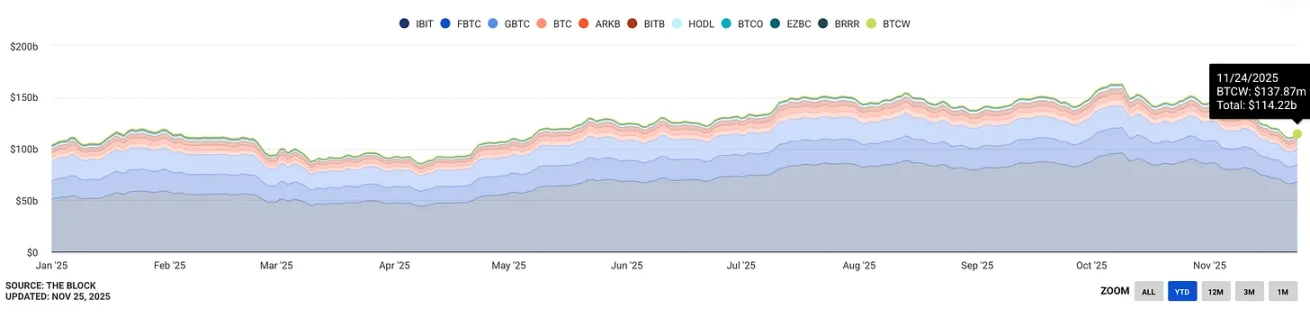
As shown below, we are at an inflection point—should Bitcoin drop 10% from here, ETF AUM could revert to the level we started the year at ($103.5 billion).
All of this suggests that monitoring not only the average cost basis of ETF holders but also the moving average of their P&L segmented by entry periods is becoming increasingly important. I believe these will become more significant sources of liquidity supply and circuit-breaking pressure in Bitcoin’s future price behavior than the historical four-year cycle ever was. This will lead to a "dynamic two-year cycle."
The second most important conclusion here is that if Bitcoin’s price doesn’t move, but time progresses forward (whether you like it or not, it will!), this is ultimately negative for Bitcoin in the institutional era, because fund managers’ rates of return are declining. Asset management is a business about "cost of capital" and relative opportunity. So if Bitcoin’s rate of return declines—not because it rises or falls, but because it trades sideways—it remains negative for Bitcoin and will prompt investors to sell once their returns are compressed below 30%.
In summary, the four-year cycle is certainly over, but the exit of old tricks doesn’t mean there are no new ones to play. Those who can understand this specific behavioral psychology will find a new cycle to operate within. It’s more difficult, as it demands greater dynamism in understanding capital flows within the context of cost bases, but ultimately, it reaffirms the truth about Bitcoin—it will always fluctuate based on marginal demand versus marginal supply and profit-taking behavior.
Only the buyers have changed, and supply itself has become less important. The good news is: these agent-buyers managing other people’s money are more predictable, and the diminished importance of supply constraints means that more predictable factors will become dominant.
Join TechFlow official community to stay tuned
Telegram:https://t.me/TechFlowDaily
X (Twitter):https://x.com/TechFlowPost
X (Twitter) EN:https://x.com/BlockFlow_News