Bitwise Advisor Post-Mortem: February 5 Bitcoin Flash Crash Root Cause — Traditional Funds Liquidated; Crypto Market Merely Affected
TechFlow Selected TechFlow Selected
Bitwise Advisor Post-Mortem: February 5 Bitcoin Flash Crash Root Cause — Traditional Funds Liquidated; Crypto Market Merely Affected
The fragility of traditional financial margin rules is Bitcoin’s antifragility.
Author: Jeff Park
Translated and edited by TechFlow
TechFlow Intro: Jeff Park, Advisor at Bitwise and Chief Investment Officer at ProCap, delivers a deep post-mortem in this long-form article of Bitcoin’s 13.2% crash on February 5. He argues this was not a fundamentals-driven selloff but rather a technical cascade collapse—triggered by de-leveraging among traditional multi-strategy funds and amplified by short gamma dynamics in the options market. The most critical data point: IBIT’s trading volume surged past $10 billion—setting a new record—yet ETF flows remained net positive. This analysis offers invaluable insight into Bitcoin’s deep interconnection with traditional capital markets.
At the end of the article, the author adds in the comments section: If you embrace this opportunity, an exceptional one lies right before you.

What Actually Happened on Feb 5?
As more data becomes available, one thing grows increasingly clear: that violent selloff was linked to Bitcoin ETFs—and occurred amid the most brutal day across capital markets in recent memory.
How do we know? Because IBIT set a new all-time record for daily trading volume (exceeding $10 billion—twice its prior high), and options volume hit the highest number of contracts traded since the ETF’s launch. Notably, this time options activity was dominated by puts, with trading volume heavily skewed toward sellers—a point we’ll revisit shortly.
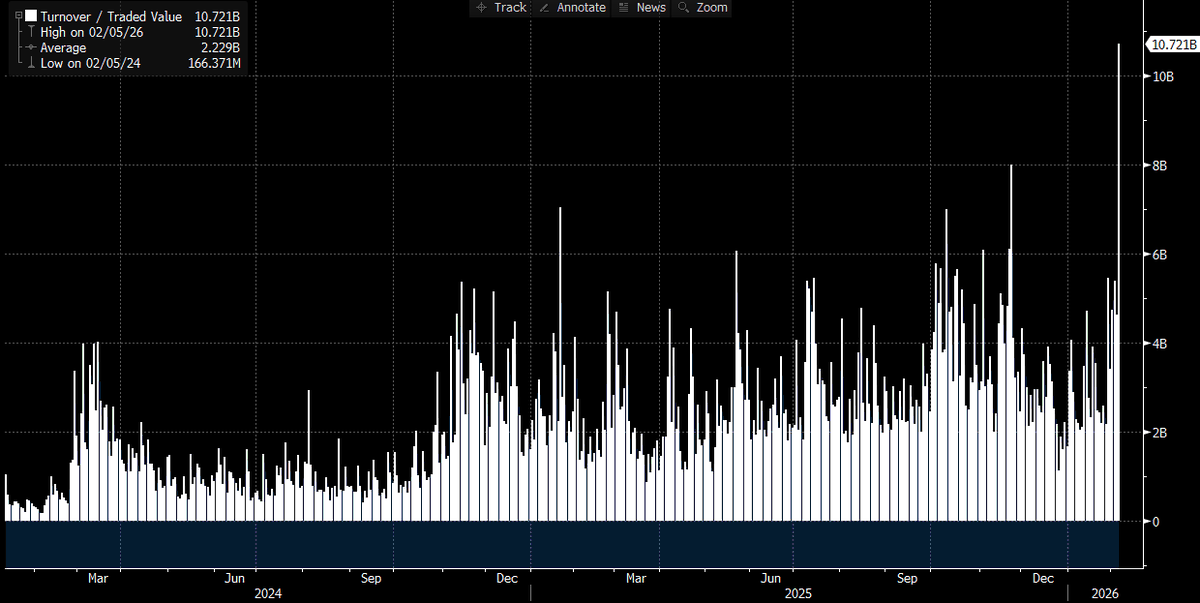
Caption: IBIT historical trading volume—Feb 5 marked a record high
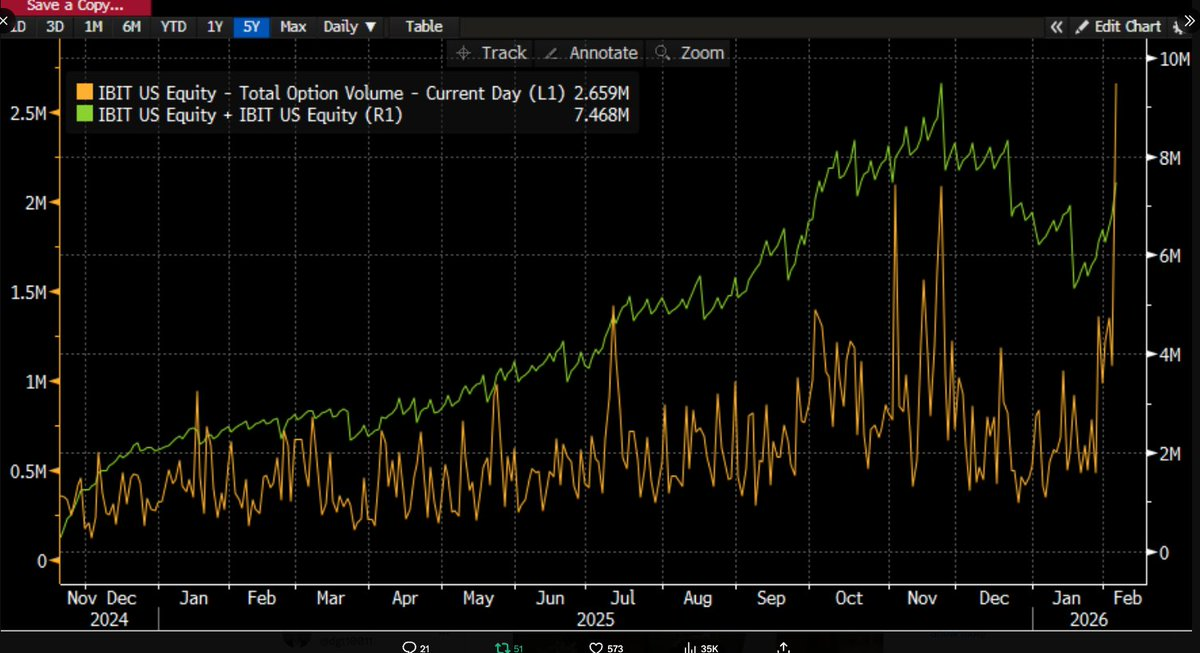
Caption: Total IBIT options volume—reaching the highest number of contracts traded since ETF launch
Meanwhile, IBIT’s price action over the past few weeks has exhibited extremely strong correlation with software stocks and other risk assets. Goldman Sachs’ Prime Brokerage (PB) desk data also shows February 4 was one of the worst days ever for multi-strategy funds—registering a z-score of 3.5. What does that mean? It’s a 0.05% probability event—roughly ten times rarer than a 3-sigma event. In short: catastrophic.
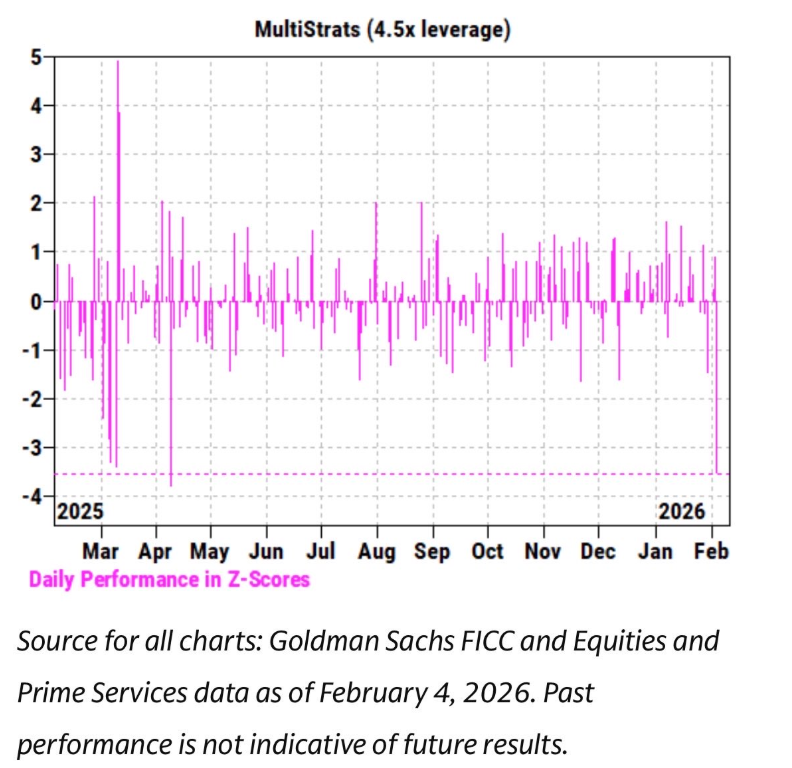
Caption: Source: Goldman Sachs FICC and Equities and Prime Services; data as of Feb 4, 2026. Past performance is not indicative of future results.
After events of this magnitude, risk managers across “Pod Shops” (the various trading desks within multi-strategy funds) immediately jump in and demand indiscriminate position reduction across the board. That explains why February 5 was also a bloodbath.
The Anomaly in IBIT Flows
Given the record-breaking activity and the 13.2% price drop on that day, we’d have expected significant net redemptions. Historical precedent supports this: On January 30, IBIT fell 5.8% the prior day and recorded its largest-ever redemption of -$530 million; on February 4, amid consecutive declines, redemptions totaled -$370 million. By that logic, outflows between $500 million and $1 billion would have seemed reasonable.
Yet the opposite occurred: We saw broad-based net subscriptions. IBIT added roughly 6 million shares, increasing AUM by over $230 million. Other ETFs also posted inflows, collectively exceeding $300 million—and still rising.
This is puzzling. You could loosely argue that February 6’s strong rebound reduced some outflow pressure—but turning it into net inflows is entirely another matter. It suggests multiple concurrent forces at play, none pointing to a single coherent narrative.
Based on currently available information, several hypotheses emerge:
- The Bitcoin selloff triggered a multi-asset portfolio or strategy that is not purely crypto-native—possibly the multi-strategy hedge funds mentioned earlier, or perhaps model portfolios like those run by BlackRock that allocate between IBIT and IGV, automatically rebalancing after extreme volatility.
- The acceleration of the selloff was tied to options market dynamics, particularly on the downside.
- The selloff did not result in net outflows of Bitcoin assets—meaning much of the activity was driven by market makers and dealers executing “paper money” trades, positions that were largely hedged.
My Hypothesis
Based on these facts, here is my working hypothesis:
- The catalyst was broad de-leveraging across multi-asset funds/portfolios, driven by statistically anomalous downside correlation among risk assets.
- This triggered sharp de-leveraging—including in Bitcoin—but much of the Bitcoin exposure was actually “delta-neutral” hedged positions. Examples include basis trades and relative-value trades (e.g., against crypto equities), where residual delta is typically hedged out by market makers.
- The de-leveraging triggered short gamma effects, compounding downward acceleration. Market makers were forced to sell IBIT—but because the selloff was so intense, they had to short Bitcoin without inventory. This effectively created new inventory, thereby reducing the anticipated large outflows.
- Then on February 6, positive IBIT flows emerged, as buyers (type still uncertain) stepped in opportunistically on the dip—further offsetting what would otherwise have been modest net outflows.
Starting from Software Stock Correlation
I lean toward the view that the catalyst originated in software stock selloffs—especially given that the correlation even extended to gold. See the two charts below:
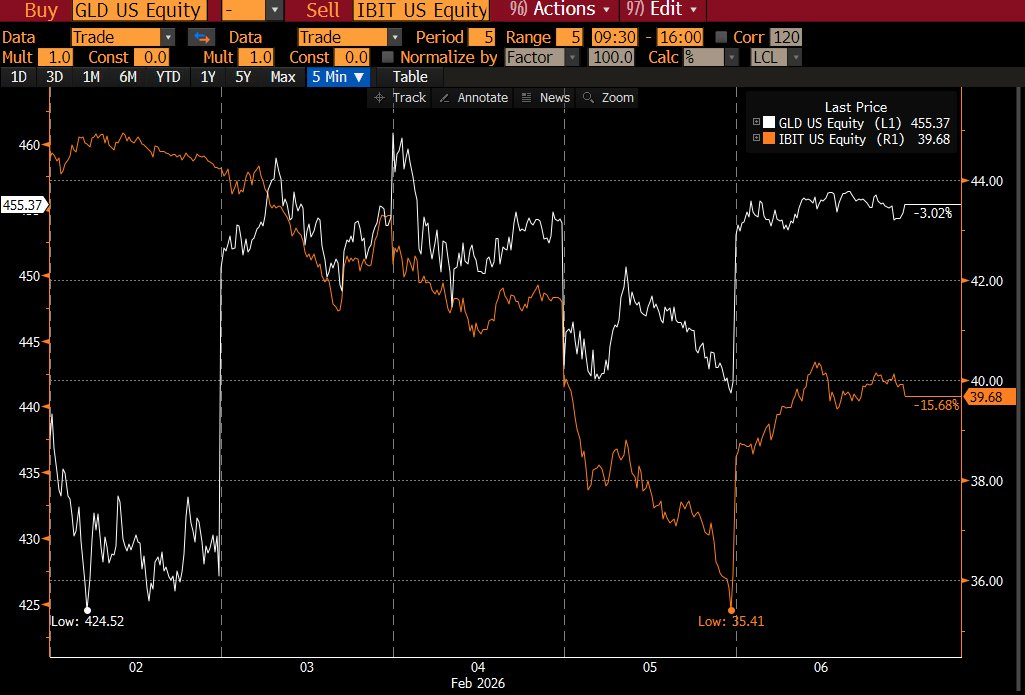
[Image: GLD vs IBIT correlation chart (Bloomberg Terminal screenshot)]
Caption: Price action comparison between GLD (gold ETF) and IBIT
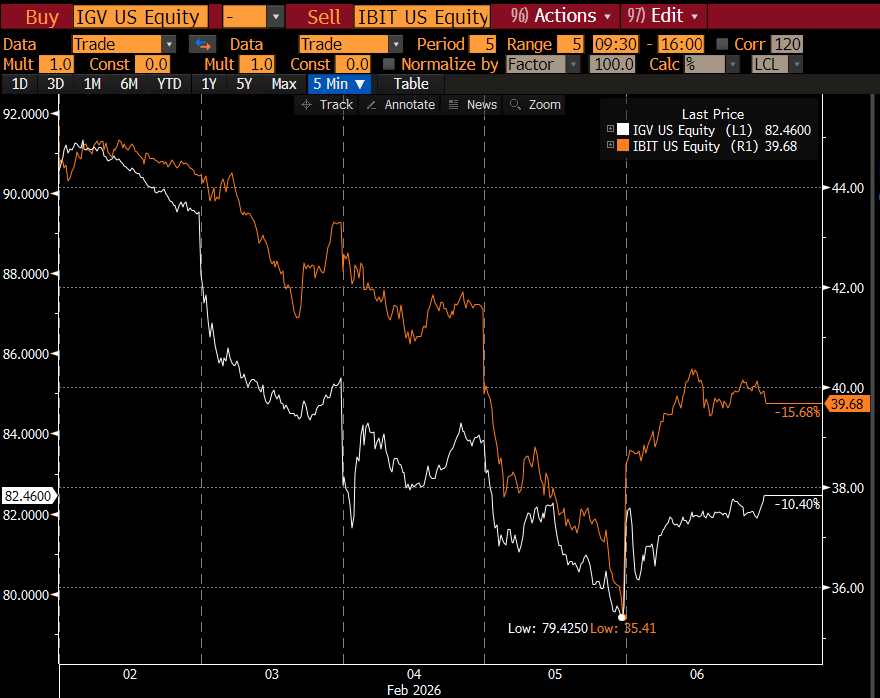
[Image: IGV vs IBIT correlation chart (Bloomberg Terminal screenshot)]
Caption: Price action comparison between IGV (software ETF) and IBIT
This makes sense to me. Gold is generally not used by multi-strategy funds for financing trades—but it may be part of RIA (Registered Investment Advisor) model portfolios. So this reinforces the idea that the core driver was indeed multi-strategy funds.
The Collapse of CME Basis Trades
This leads us to the second point: aggressive de-leveraging included hedged Bitcoin exposures. Consider the CME basis trade—the favorite of Pod Shops:
[Image: CME BTC basis data table (30/60/90/120-day)] Caption: CME BTC basis data from Jan 26 to Feb 6. Courtesy of @dlawant
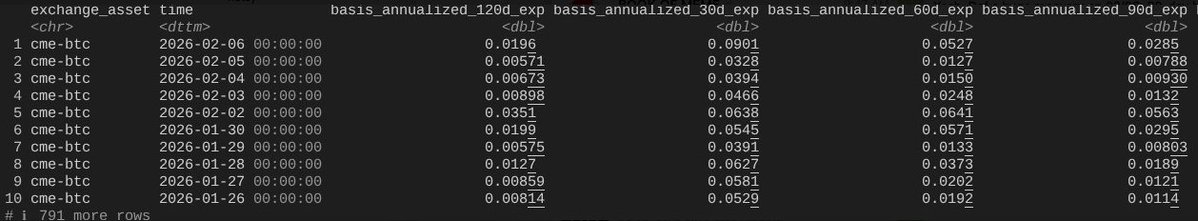
A glance at the full dataset reveals that near-term basis spiked from 3.3% on Feb 5 to 9% on Feb 6—the largest jump observed since ETF launch. This strongly confirms what happened: basis trades were forcibly liquidated en masse under mandate.
Consider giants like Millennium and Citadel—forced to unwind basis trades (sell spot, buy futures). Given their scale within the Bitcoin ETF ecosystem, it’s no surprise the blow-up was so severe.
Structured Products: Fueling the Downside
This brings us to the third leg. Having understood how IBIT was sold off amid broad de-leveraging, what accelerated the decline? One plausible “accelerant” is structured products.
While I don’t believe the structured product market is large enough to drive the selloff alone, when all factors align in ways no VaR model could foresee, it can absolutely serve as the trigger for cascading liquidations.
This immediately reminds me of my time at Morgan Stanley—Knock-In (KI) put barrier options can, under certain conditions, produce deltas exceeding 1—a scenario the Black-Scholes model never contemplates for vanilla options.
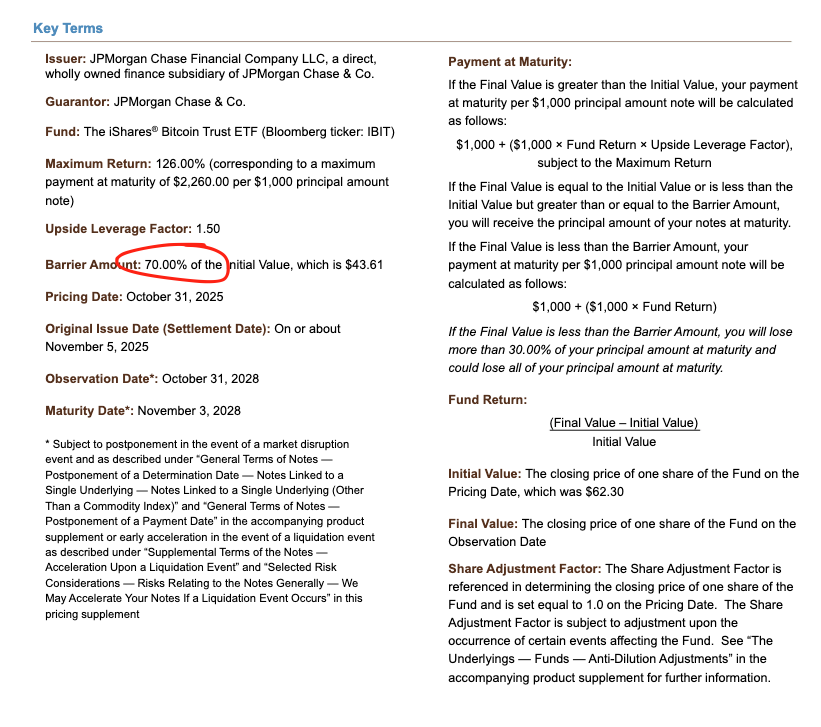
[Image: JPM structured note pricing document from Nov last year]
Caption: JPM structured note showing barrier level near 43.6
Look at JPM’s notes priced last November—barrier levels sit around 43.6. If Bitcoin dropped another 10% in December, many barriers would land in the 38–39 range—the exact epicenter of this storm.
When such barriers are breached, and market makers hedge KI risk using short put option positions, gamma changes rapidly—especially under negative vanna (volatility sensitivity) dynamics—forcing them to aggressively sell the underlying asset during the decline.
That’s precisely what we observed: implied volatility (IV) collapsed to historically extreme levels—nearly touching 90%—indicating a disaster-level squeeze. Under such conditions, market makers likely shorted massive amounts of IBIT, ultimately generating net new shares. This requires some imagination—and without further spread data, it’s hard to confirm definitively. But given the record trading volume, participation by Authorized Participants (APs) is entirely plausible.
Overlay of Crypto-Native Short Gamma
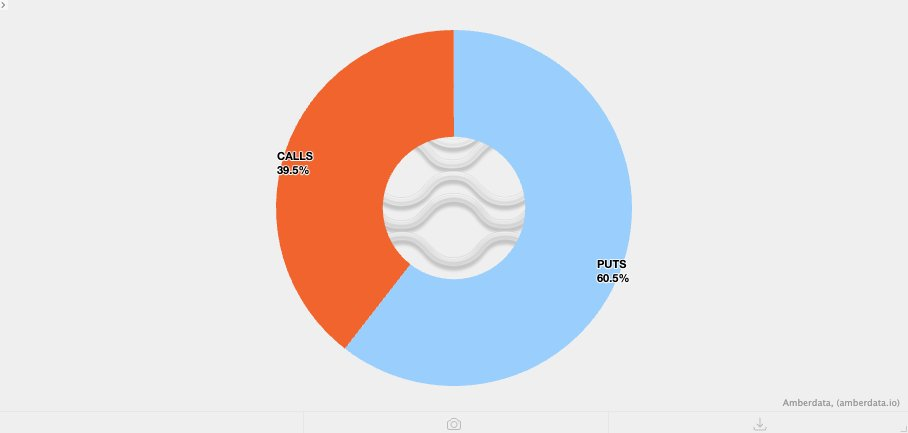
Add one more factor: With volatility having stayed unusually low over recent weeks, crypto-native clients had been buying puts. This left crypto market makers naturally short gamma—essentially selling options too cheaply. When unexpectedly large volatility arrived, the downside was further amplified.
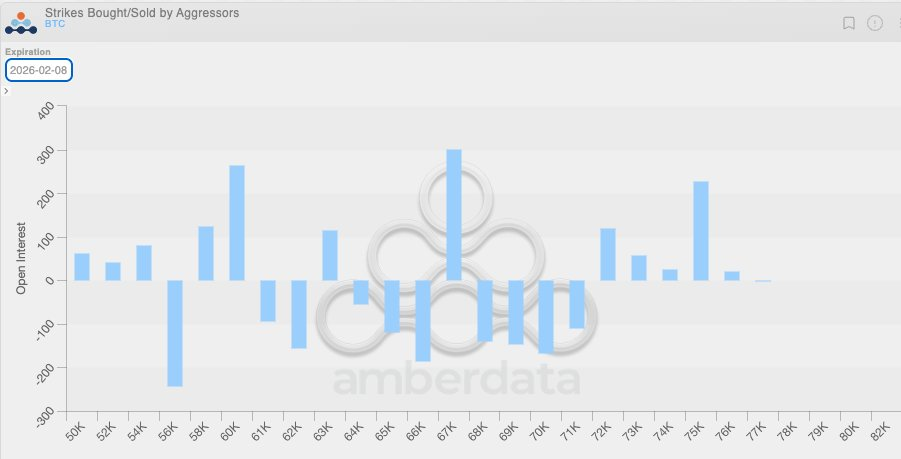
[Image: Market maker gamma positioning chart]
Caption: Market makers hold predominantly short gamma positions in puts across the $64k–$71k range
The February 6 Rebound
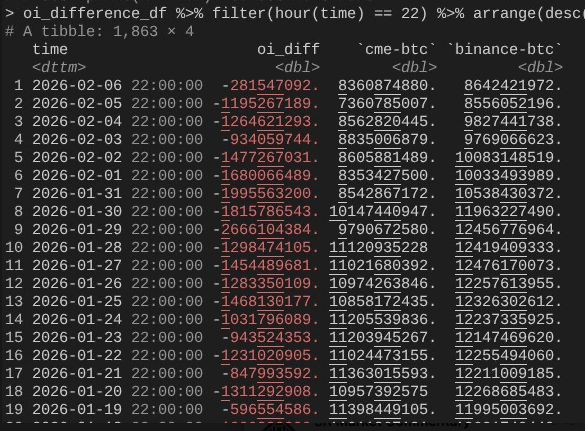
By Feb 6, Bitcoin staged a heroic rebound of over 10%. An interesting phenomenon emerged: CME open interest (OI) expanded far faster than Binance’s.
[Image: CME vs Binance OI change comparison]
Caption: Hourly snapshots courtesy of @dlawant, aligned to 4 PM ET
Note the sharp OI decline from Feb 4 to Feb 5 (again confirming CME basis trades were unwound on Feb 5)—but OI rebounded sharply on Feb 6, likely to capitalize on elevated basis levels, neutralizing the outflow effect.
This completes the picture: IBIT subscriptions/redemptions roughly balanced out, thanks to net recovery in CME basis trades; yet prices fell lower, because Binance’s OI collapsed—signaling heavy de-leveraging driven by crypto-native short gamma and liquidations.
Conclusion: Not a Fundamentals Event
So this is my best theory for what transpired on Feb 5 and Feb 6. It rests on assumptions—and remains somewhat unsatisfying, lacking a clear “villain” like FTX to blame.
But the core conclusion stands: The catalyst originated in non-crypto traditional finance de-risking operations—pushing Bitcoin to a level where short gamma, amplified by hedging activity (not directional trading), accelerated the decline, thereby creating demand for more inventory—which rapidly reversed traditional finance’s market-neutral positions on Feb 6 (though, unfortunately, crypto directional positions failed to recover in tandem).
While this answer lacks catharsis, one thing is certain: yesterday’s selloff had nothing to do with Oct 10.
Refuting the “HK Fund Yen Carry Trade” Theory
I don’t believe last week’s event was an extension of the Oct 10 de-leveraging. Some speculated a non-U.S. Hong Kong fund blew up in a yen carry trade. This theory has two major flaws:
First, I find it implausible that any non-crypto prime broker could simultaneously offer such complex multi-asset trading services, provide 90-day margin buffers, and remain stable until risk controls tightened.
Second, if funding arbitrage was used to buy IBIT options to “double down,” Bitcoin’s decline wouldn’t accelerate the selloff—options would simply go out-of-the-money (OTM), and their Greeks would decay to zero. This implies the trade must have carried explicit downside risk. If you’re shorting IBIT puts while going long USD/JPY carry—then your prime broker deserves to fail.
The Next Few Days Are Critical
The next few days are pivotal, as fresh data will reveal whether investors are leveraging this pullback to generate new demand—an extremely bullish signal.
For now, ETF flow prospects are highly encouraging. I’ve always believed true RIA-style ETF buyers—not relative-value hedge funds—are diamond-handed. We’re seeing substantial institutional momentum here, including work across the industry and by colleagues at Bitwise. To validate this, I’m watching for net inflows that occur *without* expansion in basis trade activity.
Traditional Finance’s Fragility Is Bitcoin’s Antifragility
Finally, this episode underscores how deeply Bitcoin has become embedded in financial capital markets—through highly complex pathways. That means when we’re positioned on the wrong side of a squeeze, rallies will be steeper and more vertical than ever before.
The fragility of traditional finance margin rules is Bitcoin’s antifragility. Once the inverse melt-up arrives—which I see as inevitable, especially now that Nasdaq has raised options open interest limits—it will be spectacular.
Join TechFlow official community to stay tuned
Telegram:https://t.me/TechFlowDaily
X (Twitter):https://x.com/TechFlowPost
X (Twitter) EN:https://x.com/BlockFlow_News