Why has Bitcoin's current cycle been extended?
TechFlow Selected TechFlow Selected
Why has Bitcoin's current cycle been extended?
Implied volatility remains stable, marking the maturation of market structure characterized by institutional demand dominance and extended cycle rhythms.
By: Tanay Ved
Translated by: Luffy, Foresight News
TL;DR
-
As long-term holders gradually sell off their holdings and new participants absorb supply, Bitcoin's supply turnover rate is slowing, reflecting a more gradual ownership transfer.
-
Since the beginning of 2024, spot Bitcoin ETFs and crypto treasuries (DAT) alone have absorbed approximately 57% of the net increase in short-term holder supply, now accounting for nearly a quarter of circulating Bitcoin over the past year.
-
Stable realized volatility signals market maturation, characterized by institutional demand dominance and extended cycle rhythms.
After reaching all-time highs earlier this year, Bitcoin has largely entered a consolidation phase, briefly dipping below the $100,000 mark—the first time since June. Macroeconomic headwinds, weak equity markets, and an unusually large wave of cryptocurrency liquidations have collectively dampened market sentiment, slowed capital inflows, and raised questions about the sustainability of the Bitcoin bull run. Additionally, growing concerns over large holders transferring or selling early-positioned supply have added pressure to Bitcoin and the broader crypto market. Following recent declines, the total crypto market capitalization currently stands at approximately $3.6 trillion.
Beneath the surface, on-chain data offers crucial context. In this article, we explore how shifts in Bitcoin holder behavior and core demand drivers influence market sentiment and define the rhythm of this cycle. By analyzing changes in active supply and demand channels, we assess whether recent market fluctuations signal typical end-of-cycle profit-taking or a structural transformation in Bitcoin ownership.
Supply Distribution and Institutional Absorption
Active Supply
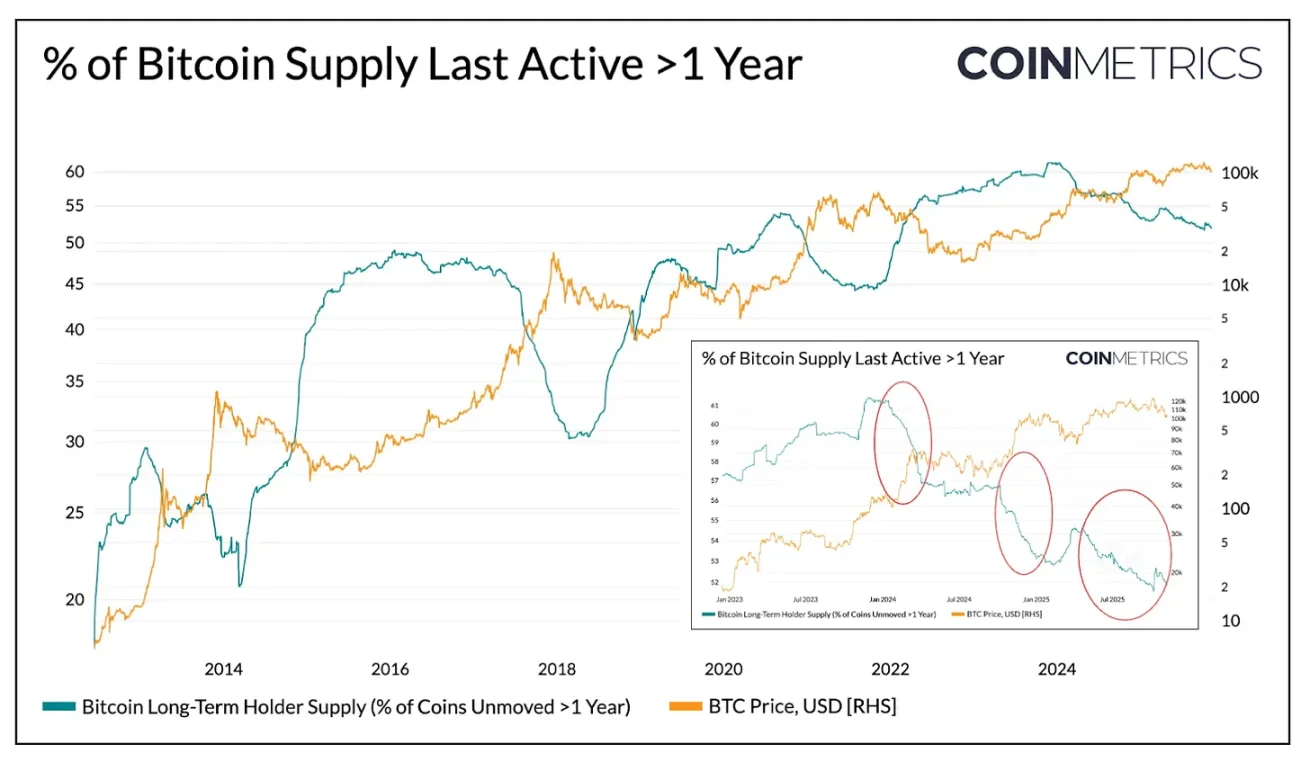
First, consider Bitcoin’s active supply metric, which segments tokens by “time since last on-chain movement,” clearly showing the distribution between “dormant” and “recently moved” coins.
The chart below isolates the proportion of Bitcoin supply that has not moved for over a year—a proxy for long-term holder (LTH) holdings. Historically, this ratio rises during bear markets (as tokens consolidate among long-term holders) and falls during bull markets (as long-term holders begin moving coins to take profits and sell at higher prices).
Source: Coin Metrics Network Data Pro
To date, around 52% of the 19.94 million circulating Bitcoin has remained unmoved for over a year, down from 61% at the start of 2024. Both the upward momentum during bear markets and the downward drops during bull runs have become noticeably smoother. Batch sell-offs occurred in Q1 2024, Q3 2024, and again recently in 2025. This indicates long-term holders are selling tokens in a more sustained manner, reflecting an elongation in the ownership transfer cycle.
ETFs & DAT: Core Demand Drivers
In contrast, short-term holder supply (coins active within the past year) has steadily increased since 2024, driven by previously dormant coins re-entering circulation. At the same time, spot Bitcoin ETFs launched, and crypto treasury (DAT) accumulation accelerated. These two channels introduced new, sustained demand capable of absorbing supply distributed by long-term holders.
As of November 2025, the amount of Bitcoin active within the past year reached 7.83 million, up approximately 34% from 5.86 million at the start of 2024 (due to dormant coins re-entering circulation). Over the same period, holdings in spot Bitcoin ETFs and Strategy treasuries rose from about 600,000 to 1.9 million BTC, absorbing nearly 57% of the net increase in short-term holder supply. Currently, these two channels together account for about 23% of short-term holder supply.
Although capital inflows have slowed in recent weeks, the overall trend shows supply is gradually shifting toward more stable, long-term holding channels—a distinctive feature of this cycle’s market structure.
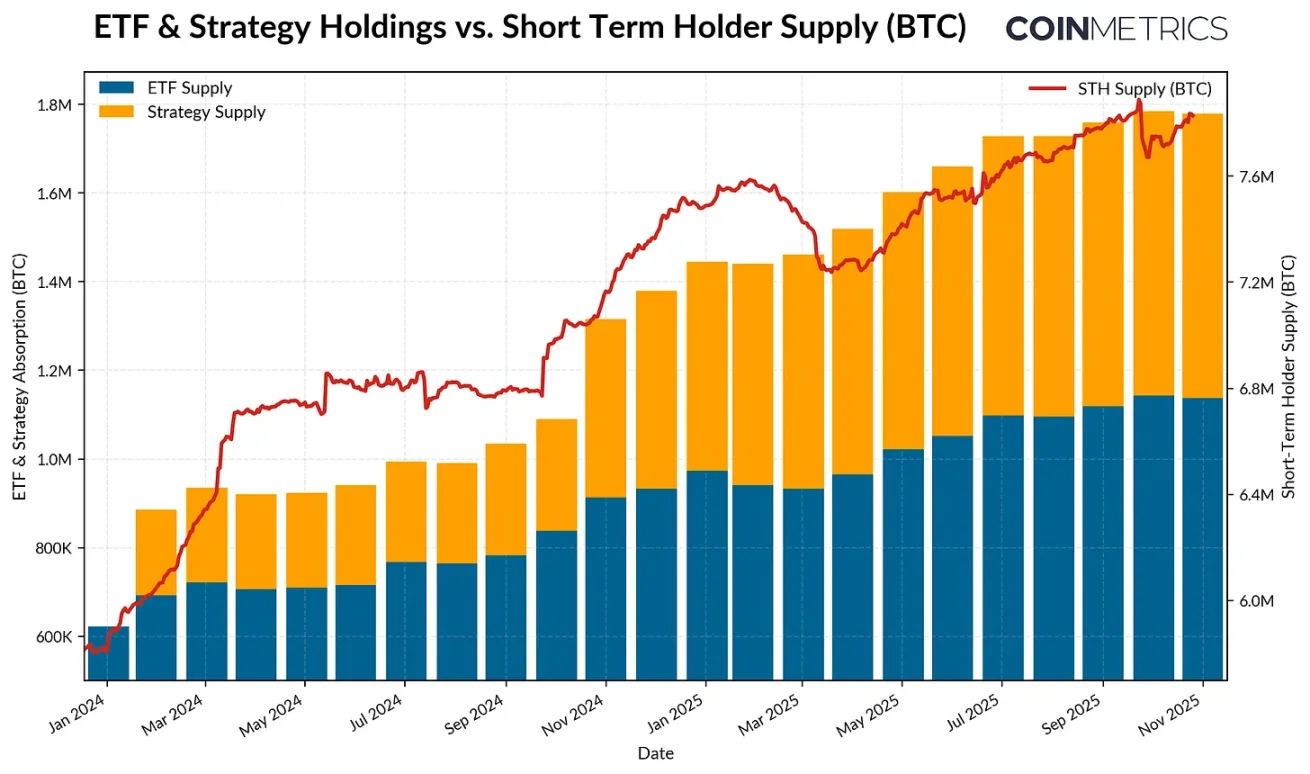
Source: Coin Metrics Network Data Pro & Bitbo Treasuries; Note: ETF supply excludes Fidelity FBTC, DAT supply includes Strategy
Behavior of Short-Term and Long-Term Holders
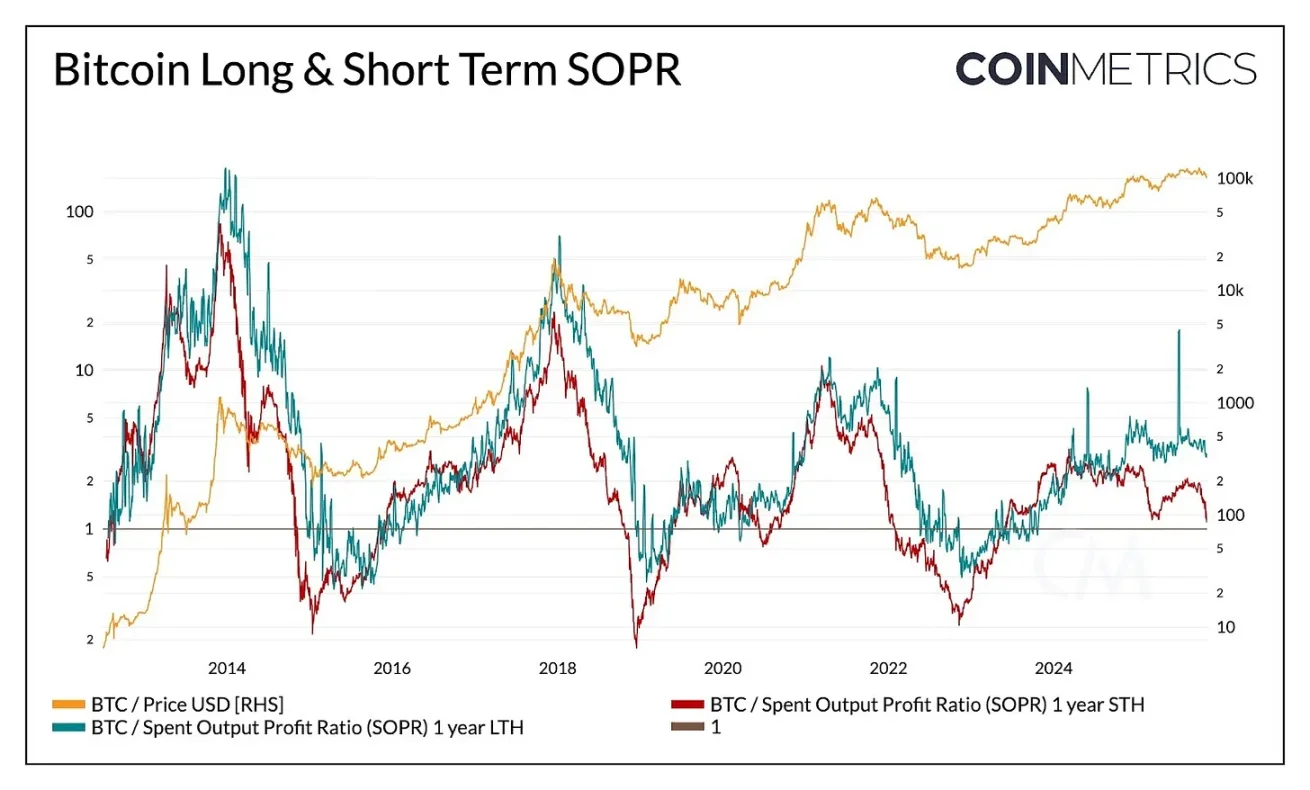
Realized profit trends further confirm the smoothing dynamics in Bitcoin supply. The Spent Output Profit Ratio (SOPR) measures whether holders are selling at a profit or loss, clearly revealing behavioral patterns across different investor groups throughout market cycles.
In previous cycles, profit realization by both long- and short-term holders often exhibited sharp, synchronized swings. Recently, however, this relationship has diverged: long-term holder SOPR remains slightly above 1, indicating steady profit-taking and moderate selling at higher prices.
Source: Coin Metrics Network Data Pro
Short-term holder SOPR hovers near the breakeven point, explaining recent market caution as many short-term positions sit close to cost basis. This divergence reflects a more gradual market phase: institutional demand is absorbing supply from long-term holders, rather than repeating the extreme boom-and-bust patterns of the past. A sustained breakout above 1 in short-term holder SOPR could signal strengthening market momentum.
While broad corrections still compress profitability across all holder groups, the overall pattern points to a more balanced market structure: supply turnover and profit realization are progressing gradually, extending Bitcoin’s cycle rhythm.
Declining Bitcoin Volatility
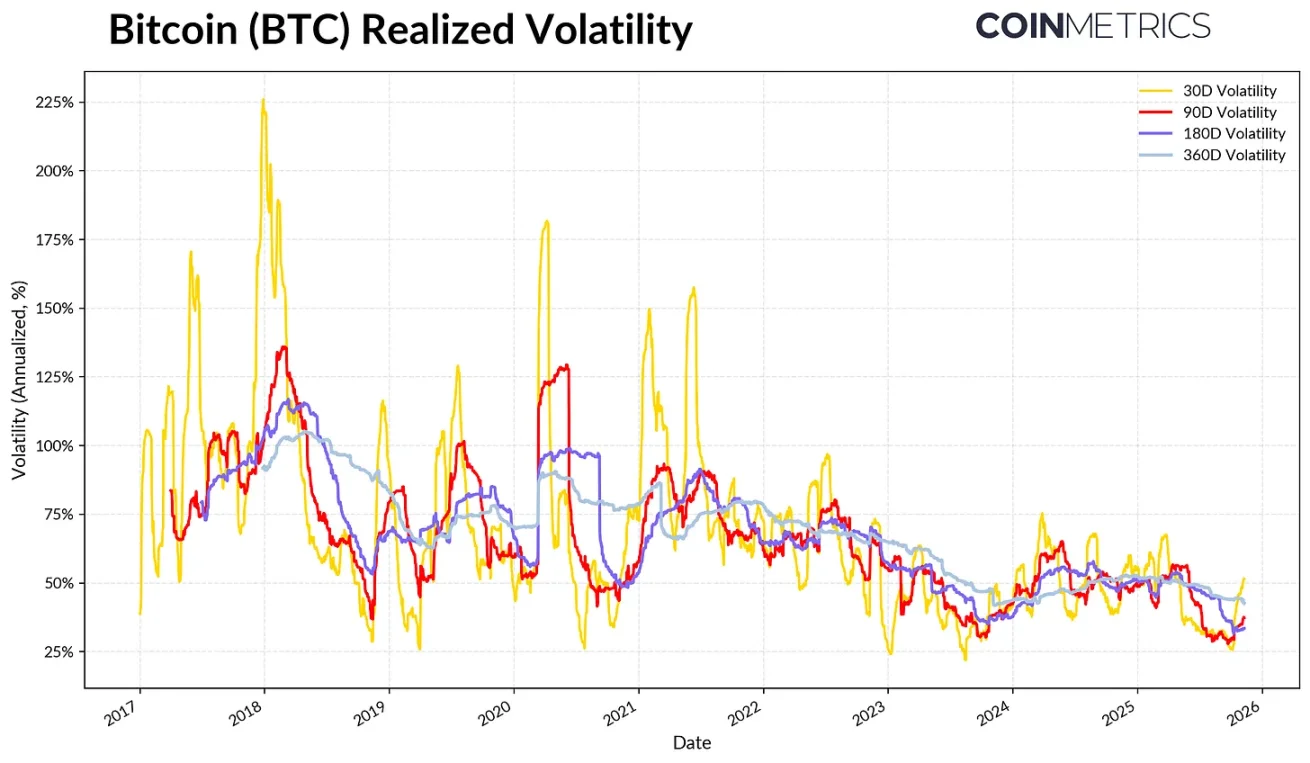
This structural smoothing is also evident in Bitcoin’s volatility, which has shown a long-term downward trend. Currently, Bitcoin’s 30-day, 60-day, 180-day, and 360-day realized volatility stabilizes around 45%-50%, whereas in the past it was far more explosive, driving wild market swings. Today, Bitcoin’s volatility profile increasingly resembles that of large-cap tech stocks, signaling asset maturity—reflecting improved liquidity and a shift toward institutional dominance in the investor base.
For asset allocators, declining volatility may enhance Bitcoin’s appeal within portfolios, especially given its dynamically evolving correlations with equities, gold, and other macro assets.
Source: Coin Metrics Market Data Pro
Conclusion
On-chain trends indicate this cycle is progressing through a smoother, longer phase, without the frenzied surges seen in prior bull markets. Long-term holders are distributing supply in batches, mostly absorbed by more sustainable demand channels—ETFs, DATs, and broader institutional holdings. This shift marks a maturing market structure: declining volatility and turnover speed, along with extended cycles.
Nonetheless, market momentum depends on sustained demand. Flattening ETF inflows, pressures on some DATs, recent broad-market liquidations, and short-term holder SOPR hovering near breakeven highlight a market in rebalancing mode. Rising long-term holder supply (coins unmoved for over a year), SOPR breaking above 1, and renewed inflows into spot Bitcoin ETFs and stablecoins could signal a return of market momentum.
Looking ahead, easing macro uncertainty, improved liquidity conditions, and regulatory progress related to market infrastructure could reignite capital inflows and extend the bull cycle. While sentiment has cooled, recent deleveraging—supported by expanding institutional channels and widespread adoption of on-chain infrastructure—has laid a healthier foundation for the market.
Join TechFlow official community to stay tuned
Telegram:https://t.me/TechFlowDaily
X (Twitter):https://x.com/TechFlowPost
X (Twitter) EN:https://x.com/BlockFlow_News