

Data Speaks: How Do CEX Tokens Perform After Being Listed on Exchanges?
TechFlow Selected TechFlow Selected
Data Speaks: How Do CEX Tokens Perform After Being Listed on Exchanges?
Most tokens experience a significant price increase within 24 hours after listing, typically starting to pull back on the second day.
Author: Simplicity Group
Translation: TechFlow

Recently, Binance's launch of different spot and futures products for meme coins has sparked controversy.
Listing on a major CEX is often the biggest expectation driving holders to wait for price increases.
However, listing isn't always a guaranteed path to profit. Your entry and exit timing, as well as which tokens you hold, are specific decisions that significantly impact final returns.
Therefore, you might be wondering about the answers to these questions:
Does being listed on Binance guarantee wealth effects? Do other CEXs lack such effects? How long after listing do wealth effects begin to diminish?
You should have a clear understanding of these issues.
Last week, research firm Simplicity Group (@SimplicityWeb3) conducted a detailed statistical analysis of over 30 tokens recently listed on seven major CEXs—Binance, OKX, Bybit, Kucoin, Coinbase, Gate, and MEXC—focusing on their performance during the first week post-listing.
TechFlow has summarized the key insights from their 60-page report for your reference.

Key Findings
1. Price Trends
The majority of tokens experience significant price increases within 24 hours of listing;
Prices typically start to pull back on the second day;
Tokens on exchanges with smaller initial surges tend to stabilize at higher levels;
Tokens experiencing large initial spikes often face severe corrections afterward;
2. Exchange Differences
Price movements of tokens across some exchanges are strikingly similar, while others show greater variation;
The exact reasons behind this phenomenon remain unclear to researchers;
3. Importance of Listing Timing
If an exchange lists a token several hours or days later than others, its price performance tends to be worse;
4. Outliers
The number of outlier tokens varies greatly between exchanges;
This suggests that internal due diligence processes play a crucial role in the overall performance of newly listed tokens;
5. Key Recommendation
Do not directly equate an exchange’s reputation with potential price performance;
Binance
1. First-Day Performance
The vast majority of tokens see notable gains on their first day;
Average gain is approximately 66%, with some exceeding 200%;
This may stem from heightened attention and investor enthusiasm upon new listings;
2. Second-Day Trends
Gains begin to slow, with some tokens pulling back;
Range of price changes widens, from -15% to +214%;
This likely reflects partial profit-taking by early investors alongside new entries;
3. Day Three to One Week
Price volatility gradually stabilizes;
Day-three price changes range from -27% to +164%;
By the end of the week, most tokens remain in positive territory, with median gains around 15%;
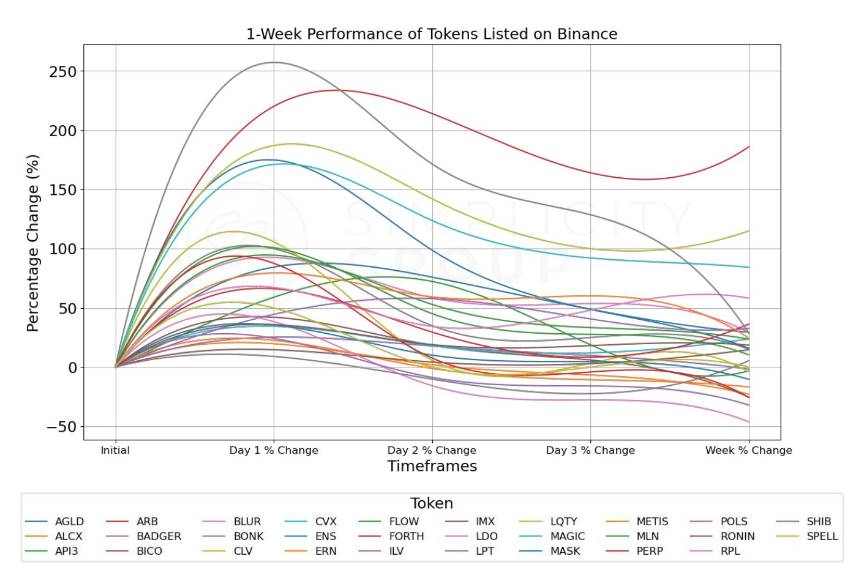
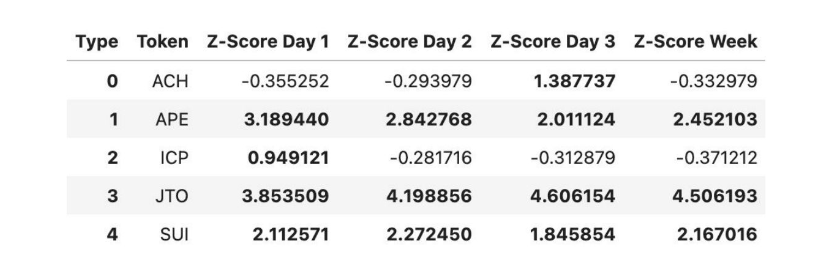
4. Tokens with Abnormal Performance
A few tokens like BONK, APE, ICP, JTO, and SUI exhibit unusually high volatility;
These clearly deviate from average behavior and may require separate analysis;
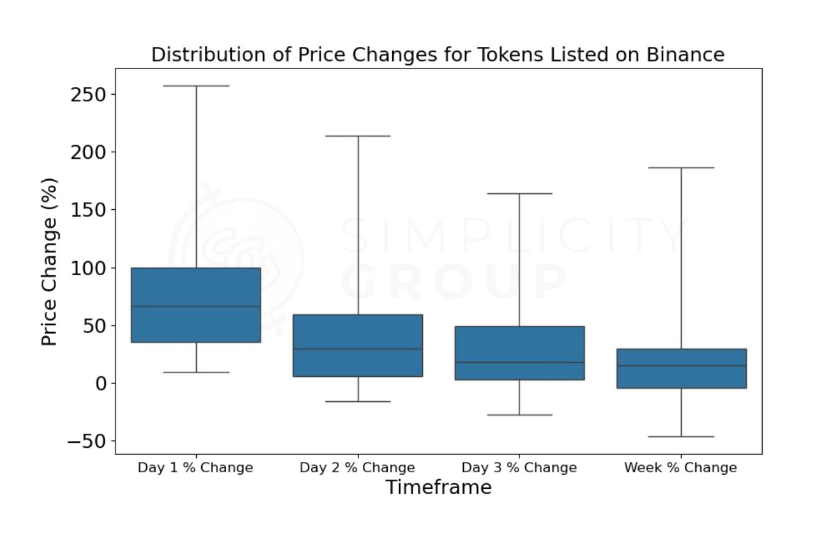
5. Distribution of Price Changes
First-day price swings are most extreme, with a median increase of 66.15%;
In subsequent days, both magnitude and range of price changes gradually shrink;
This indicates the market’s valuation of new tokens becomes more rational over time;
6. Overall Trend Observation
Tokens listed on Binance generally follow a "rally then stabilize" pattern;
High initial gains are difficult to sustain, but most maintain positive growth one week later;
After early volatility, prices gradually settle;
7. Investor Implications
Short-term profit opportunities may exist initially, but come with high risk;
Token prices may fluctuate significantly in the first week—investors should be prepared;
Long-term investors may want to wait until prices stabilize before making decisions;
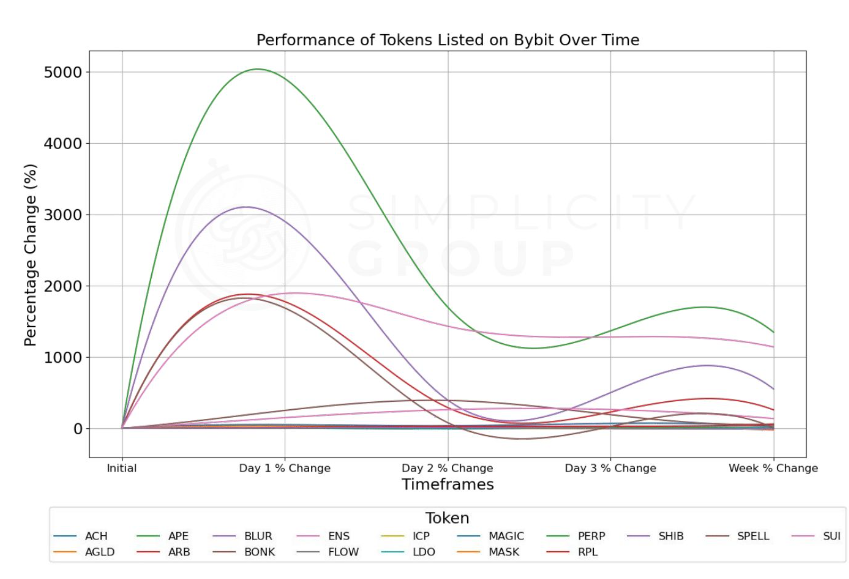
Bybit
1. First-Day Performance
Average gain reaches 806.34%, heavily skewed by a few exceptional performers;
Median gain is 45.71%, better representing typical tokens;
25% of tokens gain over 1,685.71%, showing extraordinary performance in some cases;
Highest gain hits 4,900%, lowest at 0.94%—performance varies widely;
2. Second-Day Trends
Gains slow noticeably, average drops to 273.04%;
Median falls to 27.37%, indicating most tokens can’t sustain first-day momentum;
Price range expands: low of -9.51%, high still at 1,698%;
Volatility remains high but declines slightly from day one;
3. Day Three to One Week
Day three average down to 234.88%, median at 25%;
One week later, average gain is 207.56%, median drops to 16.96%;
Volatility continues to ease, though prices remain elevated;
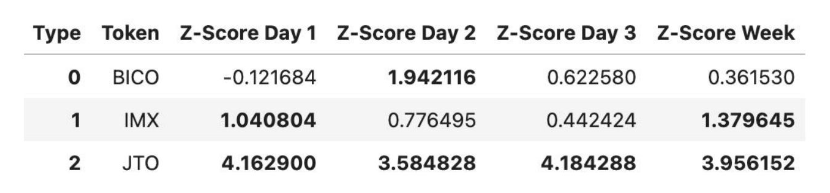
4. Tokens with Abnormal Performance
JTO stands out most, maintaining abnormally high Z-scores throughout (Z-score measures deviation from peers);
IMX also performs strongly, especially on day one and after one week;
BICO spikes sharply on day two, then retreats;
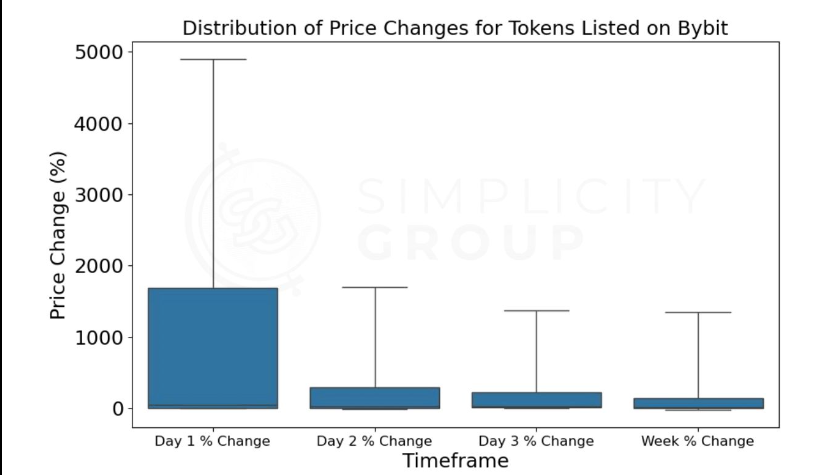
5. Distribution of Price Changes
First-day swings are most intense; middle 50% of tokens gain between 4.6% and 1,685.7%;
Subsequent days show narrowing ranges;
By week’s end, 75% of tokens still show positive gains—indicating an overall bullish trend;
6. Overall Trend Observation
Tokens on Bybit generally show a "high open, lower close" pattern but remain elevated;
Initial spikes are unsustainable, yet most tokens stay up after one week;
Volatility decreases over time but stays above normal market levels;
7. Investor Implications
Massive short-term profits possible on day one—but so is risk;
Investors must watch for sharp short-term swings;
Long-term investors may prefer to wait for stabilization;
8. Data Limitations
Analysis based on only 17 tokens, possibly unrepresentative;
Extreme performances (e.g., JTO, IMX) significantly skew averages—interpret with caution;
Missing data for some tokens may affect comprehensiveness;
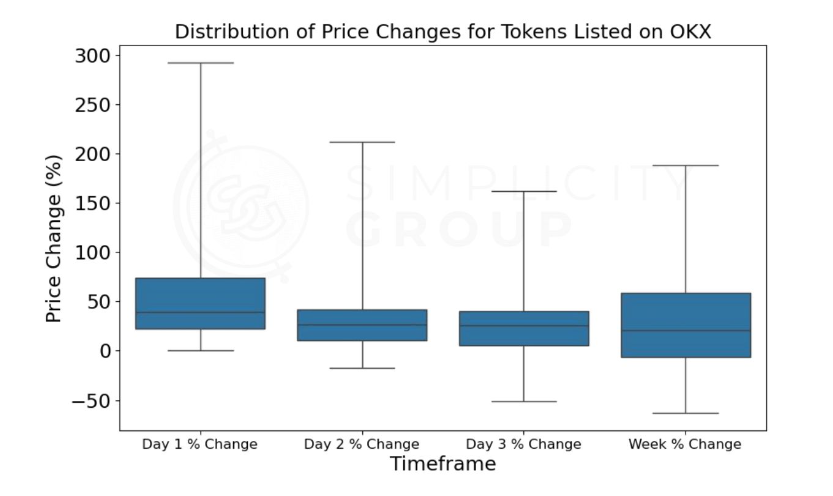
OKX
1. First-Day Performance
Average gain: 59.33%; median: 39.13%, more representative;
25% of tokens gain over 74.06%;
Top gainer: +292%, bottom: 0%—clear divergence;
2. Second-Day Trends
Gains moderate: average down to 36.94%, median to 26.85%;
Price range widens: -17.20% to +212%;
Volatility persists but eases slightly;
3. Day Three to One Week
Day three average: 32.98%, median: 25.91%;
One week later: average 32.52%, median 20.95%;
Prices stabilize gradually, maintaining steady positive momentum;
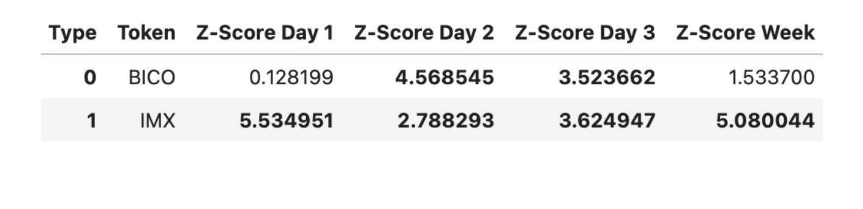
4. Tokens with Abnormal Performance
IMX leads with consistently high Z-scores;
BICO peaks on day two, then fades;
BLUR shows high volatility but remains within statistical norms;
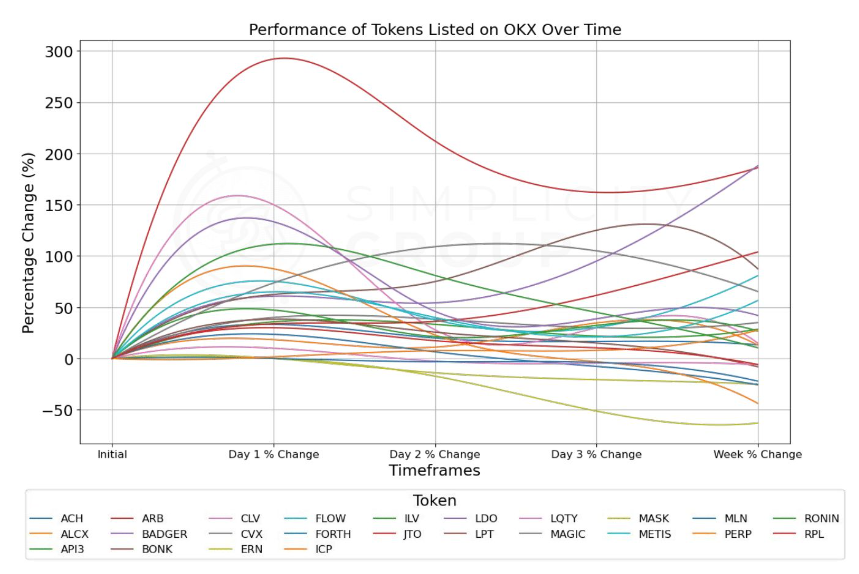
5. Distribution of Price Changes
First-day gains are relatively concentrated: 75% under 74.06%;
Subsequent days show narrowing ranges;
At week’s end, over 75% remain positive, top performer up 187.97%;
6. Overall Trend Observation
OKX tokens show relatively stable growth;
Initial gains less explosive than Bybit, but still solid;
Volatility declines steadily, suggesting good stability;
7. Investor Implications
Profitable opportunities exist on day one, with relatively lower risk;
Watch for short-term swings, though milder than on Bybit;
Long-term investors may find steadier growth prospects on OKX;
8. Data Limitations
IMX gained over 100,000% on listing day—an extreme outlier;
Tokens like IMX, AGLD, APE, BICO, BLUR, SUI, ENS, SHIB were removed due to abnormality, affecting extreme-case analysis;
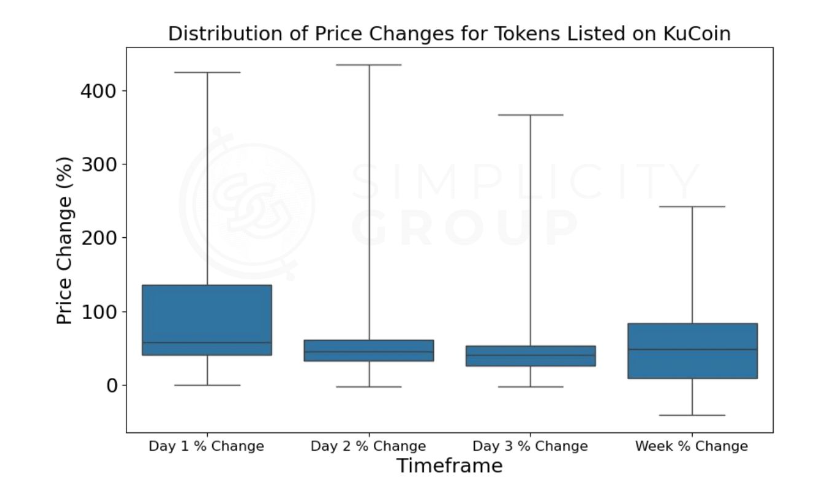
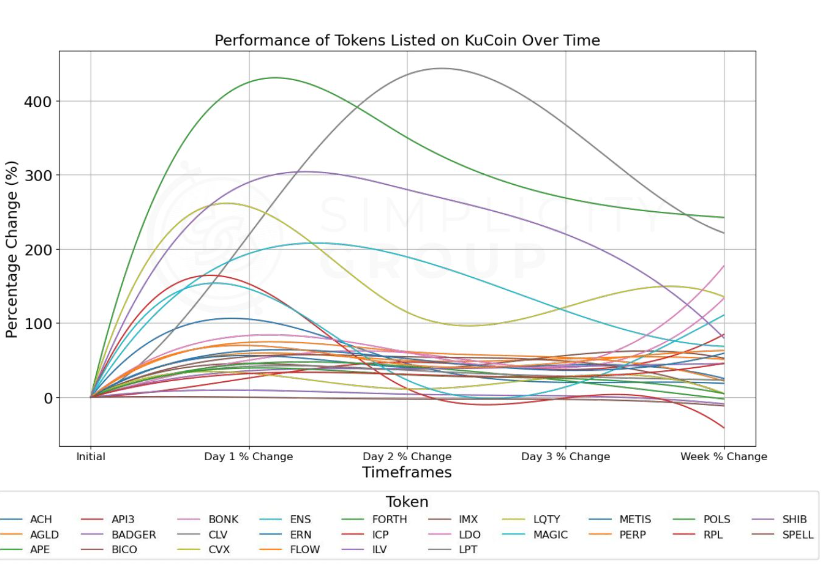
Kucoin
1. First-Day Performance
Average gain: 100.27%; median: 57.76%;
25% gain over 135.95%;
Peak: +425%, floor: 0%—significant spread;
2. Second-Day Trends
Average down to 82.54%, median to 44.58%;
Range: -2.47% to +435.14%;
Volatility remains high but dips from day one;
3. Day Three to One Week
Day three average: 67.59%, median: 40.68%;
One week later: average 61.96%, median 48.49%;
Volatility eases, but prices stay elevated;
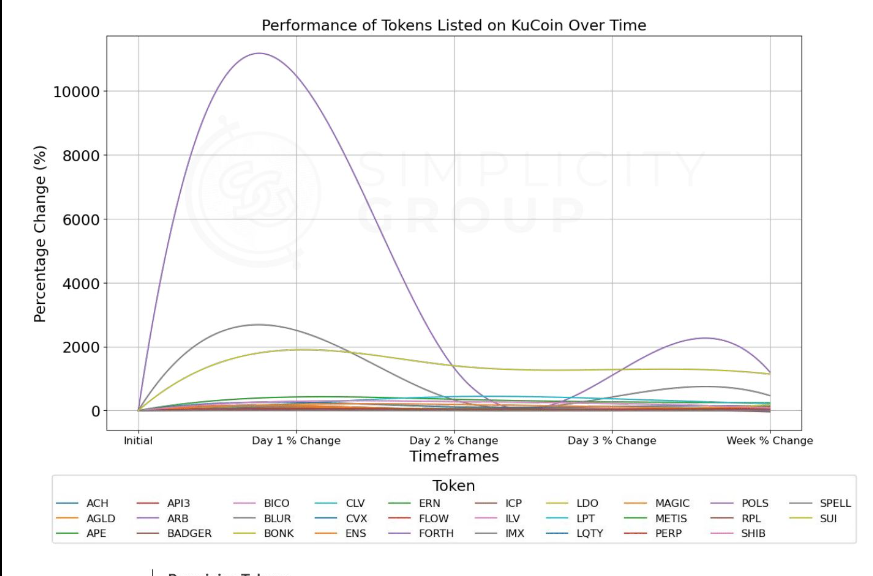
4. Tokens with Abnormal Performance
MASK stands out on day one (Z-score: 5.47);
JTO excels post-day two (Z-score >5);
These outliers heavily influence overall data;
5. Distribution of Price Changes
Day one: 25%-75% of tokens gain between 39.98% and 135.95%;
Later days show narrowing ranges;
At week’s end, 75% of tokens still up over 83.50%;
6. Overall Trend Observation
KuCoin tokens show a "high open, high continue" pattern;
Initial surge hard to maintain, but strong positive gains persist;
Volatility decreases but remains high;
7. Investor Implications
Day one offers massive short-term gains—average over 100%;
Beware of sharp swings, especially day-two pullbacks;
For long-term holders, prices remain high after one week—good holding returns possible;
8. Data Limitations
Based on 26 tokens; outliers like MASK and JTO skew averages;
Removing outliers may underestimate probability of extreme events;
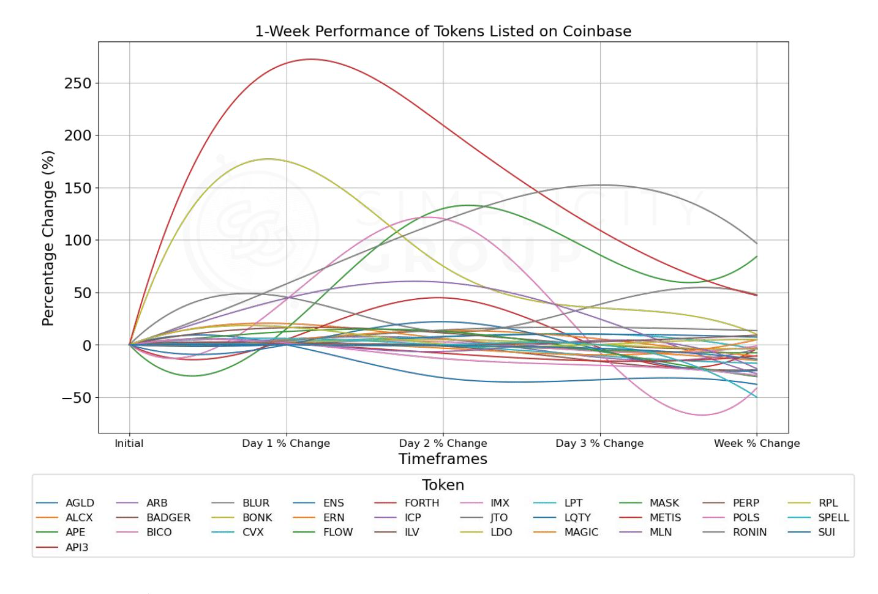
Coinbase
1. First-Day Performance
Average gain: 24.41%; median: 3.90%—most tokens rise modestly;
25% gain over 16.68%;
Peak: +268.36%, floor: 0%—notable divergence;
2. Second-Day Trends
Average rises slightly to 26.21%; median to 5.96%;
Range: -31.51% to +209.16%;
Volatility remains high but spreads out;
3. Day Three to One Week
Day three average: 10.87%, median: -0.15%;
One week later: average -1.87%, median -4.36%;
Volatility declines, but overall trend turns negative;
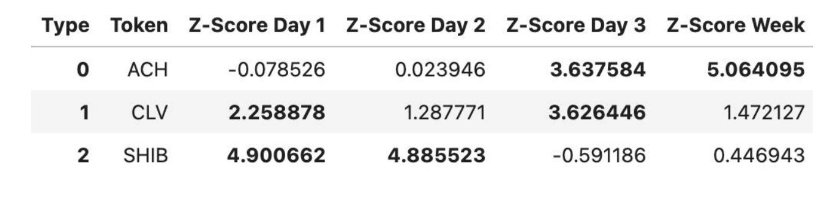
4. Tokens with Abnormal Performance
ACH shines on day three and at week (Z-scores: 3.64, 5.06);
CLV stands out on day one and three (Z-scores: 2.26, 3.63);
SHIB behaves anomalously in first two days (Z-score ~5);
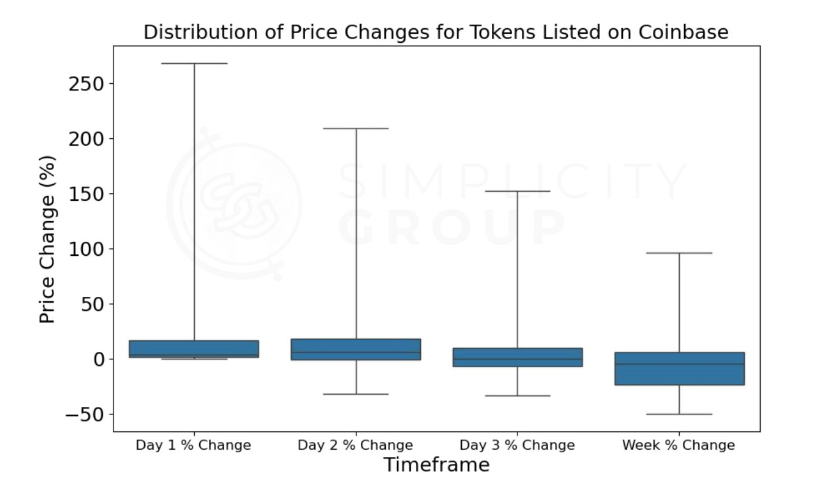
5. Distribution of Price Changes
Day one: 25%-75% gain between 1.28% and 16.68%;
Day two: range -0.52% to 17.98%;
At week’s end, 75% lose no more than 6.20%;
6. Overall Trend Observation
Coinbase tokens show a “rise then fall” pattern;
Mild initial gains possibly due to delayed listing strategy;
Volatility decreases, but trend turns downward;
7. Investor Implications
Day one and two offer mild profit chances;
Watch for volatility, especially downturns after day three;
Long-term investors should be cautious—prices often below listing level after one week;
8. Coinbase Specifics
Coinbase uses delayed listing to minimize volatility and comply with regulations;
This may result in higher initial prices compared to other exchanges, affecting short-term performance;
APE case shows how delayed listing can cause significant performance differences;
9. Data Limitations
Based on 31 tokens; outliers (ACH, CLV, SHIB) skew results;
Delayed listing may make some data incomparable;
Gate.io
1. First-Day Performance
Average gain: 82.88%; median: 39.46%—most tokens rise significantly;
75% gain over 14.19%;
Peak: +538.89%, floor: 0%—huge disparity;
2. Second-Day Trends
Average drops to 33.18%; median to 10.35%;
Range: -67.00% to +440.00%;
Volatility remains high but eases slightly;
3. Day Three to One Week
Day three average: 17.44%, median: 9.50%;
One week later: average +0.54%, median -6.35%;
Volatility declines, but trend turns negative;
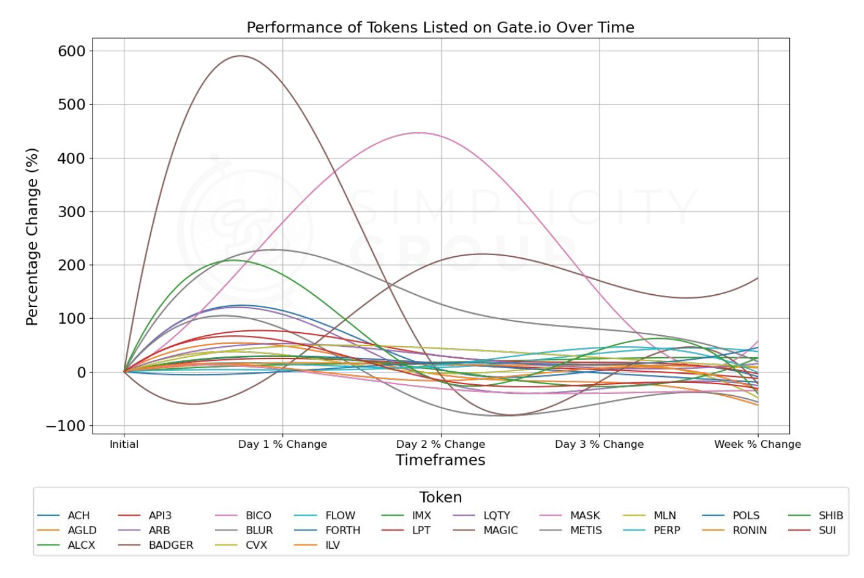
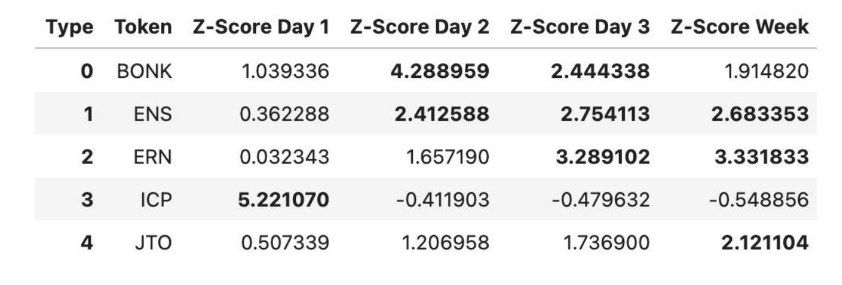
4. Tokens with Abnormal Performance
ICP stands out on day one (Z-score: 5.22);
BONK on day two (Z-score: 4.29);
ERN on day three and at week (Z-scores: 3.29, 3.33);
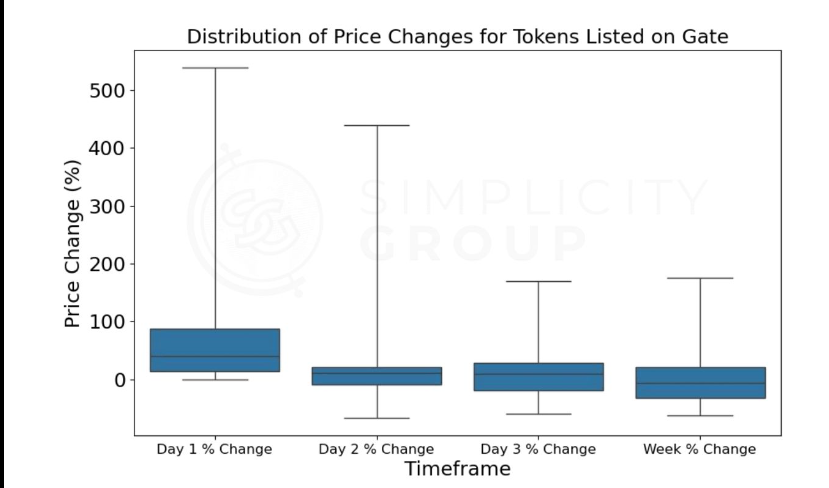
5. Distribution of Price Changes
Day one: 25%-75% gain between 14.19% and 87.06%;
Day two: -9.01% to 20.65%;
At week’s end, 75% lose no more than 20.62%;
6. Overall Trend Observation
Gate.io tokens show strong initial gains followed by decline;
Early surge is powerful but short-lived;
Volatility decreases, but trend turns bearish;
7. Investor Implications
Day one offers big short-term profits—average over 80%;
Expect sharp swings, especially significant pullbacks on day two;
Long-term investors should assess carefully—prices often near or below listing level after one week;
8. Gate.io Specifics
Strong initial performance comes with high downside risk;
About 29.4% of tokens classified as outliers—indicating huge performance variance;
Post-outlier removal, remaining tokens perform closer to “average,” but may underestimate extreme outcomes;
9. Data Limitations
Original sample: 34 tokens; main analysis based on 24 after removing outliers;
Many outliers suggest results may not fully reflect reality;
Gate.io may have unique listing strategies or market dynamics affecting performance;
MEXC
1. First-Day Performance
Average gain: 405.09%; median: 277.90%—most tokens surge dramatically;
75% gain over 153.32%;
Peak: +1,680.0%, floor: -64.0%—massive variation;
2. Second-Day Trends
Average dips to 390.49%; median to 236.67%—still very high;
Range: -90.0% to +1,610.8%;
Volatility remains intense but slightly reduced;
3. Day Three to One Week
Day three average: 376.98%, median: 266.63%;
One week later: average 330.83%, median 242.50%;
Volatility eases, but prices remain significantly elevated;
4. Tokens with Abnormal Performance
BLUR stands out on day one (Z-score: 3.35);
BONK on day three (Z-score: 3.84);
IMX at week (Z-score: 4.44);
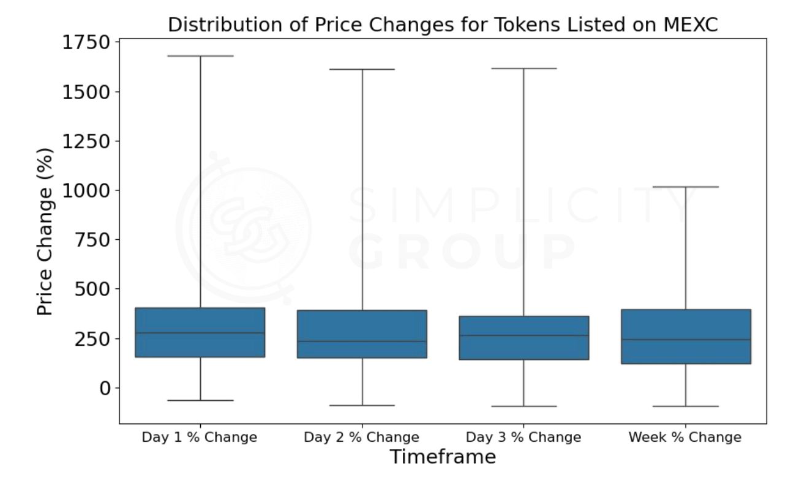
5. Distribution of Price Changes
Day one: 25%-75% gain between 153.32% and 402.98%;
Day two: 152.28% to 390.00%;
At week’s end, 75% still gain over 121.33%;
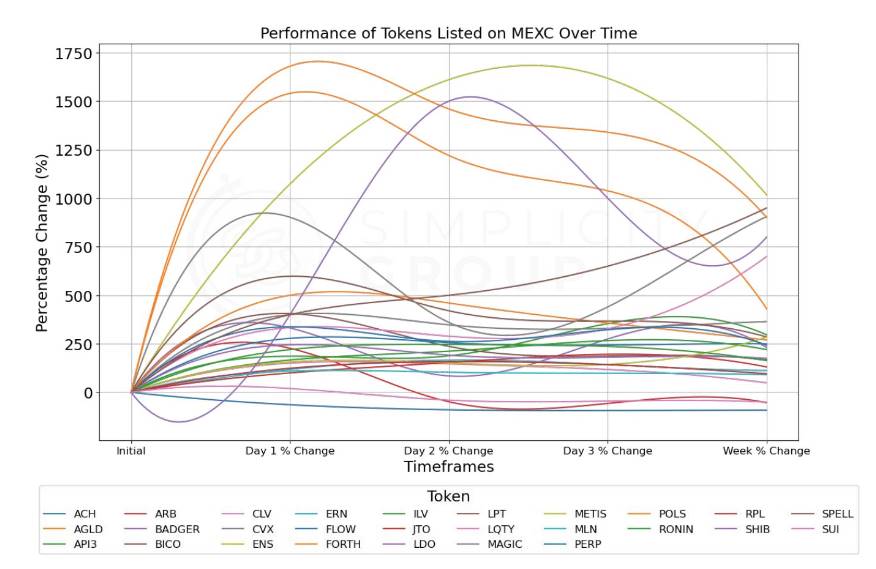
6. Overall Trend Observation
MEXC tokens show sustained strong upward momentum;
Initial surge is massive, then slightly cools but remains high;
Volatility declines over time, but bullish trend persists;
7. Investor Implications
Day one offers enormous short-term gains—average over 400%;
Expect big swings, but overall trend remains strong;
Long-term investors benefit—prices mostly above listing level after one week, showing lasting market interest;
8. MEXC Specifics
MEXC tokens show exceptionally strong and prolonged performance;
Even after one week, most remain significantly up—suggesting unique market environment or user base;
Compared to others, MEXC tokens display more enduring upward momentum;
9. Data Limitations
Based on 27 tokens; anomalies (e.g., SHIB) may stem from data issues—interpret cautiously;
Extremely high and sustained gains may reflect MEXC-specific conditions, not generalizable;
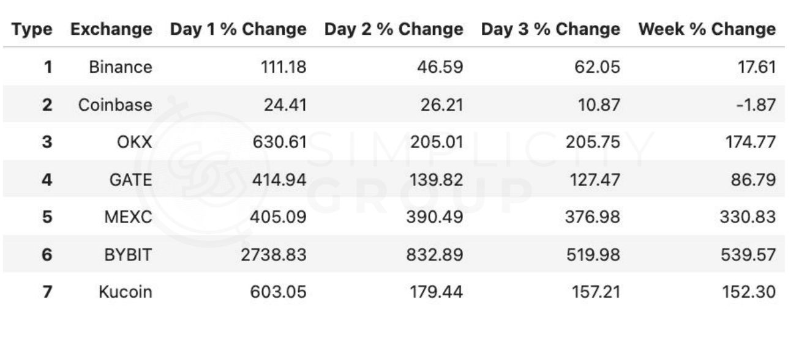
Cross-Exchange Comparison
1. Overall Performance Ranking (Average Gain After One Week)
ByBit (539.57%)
MEXC (330.83%)
Kucoin (152.30%)
OKX (174.77%)
GATE (86.79%)
Binance (17.61%)
Coinbase (-1.87%)
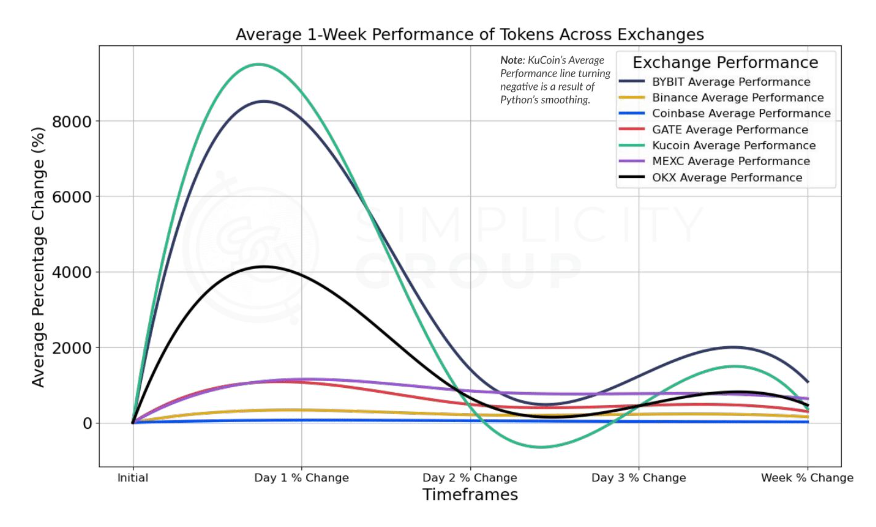
2. First-Day Performance
ByBit leads with an average gain of 2,738.83%;
OKX and Kucoin follow at 630.61% and 603.05%;
GATE and MEXC also strong: 414.94% and 405.09%;
Binance and Coinbase more conservative: 111.18% and 24.41%;
3. Price Trend Patterns
ByBit: Extreme first-day spike, rapid pullback, yet remains high;
OKX and Kucoin: Strong start, then large retracements;
MEXC: High initial jump, slower correction, sustains elevated levels;
GATE: Mild but steady uptrend;
Binance and Coinbase: Lower volatility, more stable trends;
4. Sustainability
MEXC shows best sustainability, maintaining high gains from day one to week one;
ByBit starts highest but corrects most sharply;
OKX and Kucoin strong initially, struggle to maintain;
GATE delivers consistent mid-tier performance;
Binance and Coinbase low volatility, limited upside;
5. Risk & Volatility
ByBit exhibits highest risk and volatility;
OKX, Kucoin, MEXC also highly volatile;
GATE at moderate volatility;
Binance and Coinbase least volatile, lower risk;
6. Special Observations
Differences remain significant even after removing outliers;
ByBit’s extremes may reflect unique listing strategy or user base;
MEXC excels in sustainability;
Binance and Coinbase may list more mainstream tokens first, hence more conservative performance;
7. Investor Implications
Short-term speculators may favor ByBit, OKX, Kucoin for high initial spikes;
Mid-term investors may prefer MEXC for better sustainability;
Risk-averse investors may lean toward Binance or Coinbase;
GATE may suit those balancing risk and return;
Note: All data and views expressed herein represent those of the original report author, not TechFlow.
Read the original English report: Click here
Join TechFlow official community to stay tuned
Telegram:https://t.me/TechFlowDaily
X (Twitter):https://x.com/TechFlowPost
X (Twitter) EN:https://x.com/BlockFlow_News


