2024 Web3 Funding Analysis: Public Sales Projects Account for Over 80%, Retail Investors Rally Together
TechFlow Selected TechFlow Selected
2024 Web3 Funding Analysis: Public Sales Projects Account for Over 80%, Retail Investors Rally Together
Token offerings conducted via public sales have dominated this year, accounting for 81% of all token launches since the beginning of the year.
Author: Jasper De Maere, Outlier Ventures
Translation: J1N, Techub News
Since March 2024, the cryptocurrency market has experienced a significant correction. Most altcoins (tokens other than Bitcoin and Ethereum) — especially relatively mainstream ones — have dropped over 50% from their peak prices. However, newly launched tokens have been less affected. By analyzing more than 2,000 token issuance cases, we found that early-stage projects with million-dollar funding rounds have maintained stable native token prices, demonstrating performance independent of broader market trends.
Key Takeaways
-
In the Web3 private investment market, projects raising around one million dollars during Pre-Seed and Seed rounds — particularly those with longer fundraising periods — tend to experience longer intervals before securing follow-on funding, and ultimately raise smaller amounts in subsequent rounds.
-
Based on observations from January to April, we found that the投融资 market reacts with a lag to overall market movements: a surge in投融资 activity typically occurs about one month after a major market rally.
-
This year, public sales have dominated token launches, accounting for 81% of all token issuances since the beginning of the year. No sector has seen more private sales than public sales, indicating strong market preference for public offerings.
-
Due to large discrepancies in valuation data across different funding stages and subjective biases in project disclosures, it is difficult to draw meaningful conclusions from disclosed valuations alone.
Funding Size and Sector Maturity
Web3 itself is not an industry but a technological stack transforming multiple industries. Moreover, no two Web3 sectors are alike — they differ in founder backgrounds and the blockchain solutions they offer. As a result, capital requirements vary significantly across sectors. To clarify these differences, we combined funding size with funding stage across various sectors, using data from the beginning of 2024 through August 11, resulting in the following chart:
-
X-axis: Funding stage of the project.
-
Y-axis: Average funding amount raised.
-
Bubbles: Bubble size represents the number of funding deals.
A diagonal line from bottom-left to top-right divides the chart into yellow and blue regions. Blue represents capital-light sectors, while yellow indicates capital-intensive sectors.

Funding Stage and Scale by Sector in 2024
Token Fundraising
We analyzed 375 projects from January through August 11 that either used hybrid public-private token issuance models or raised funds using non-stablecoins.
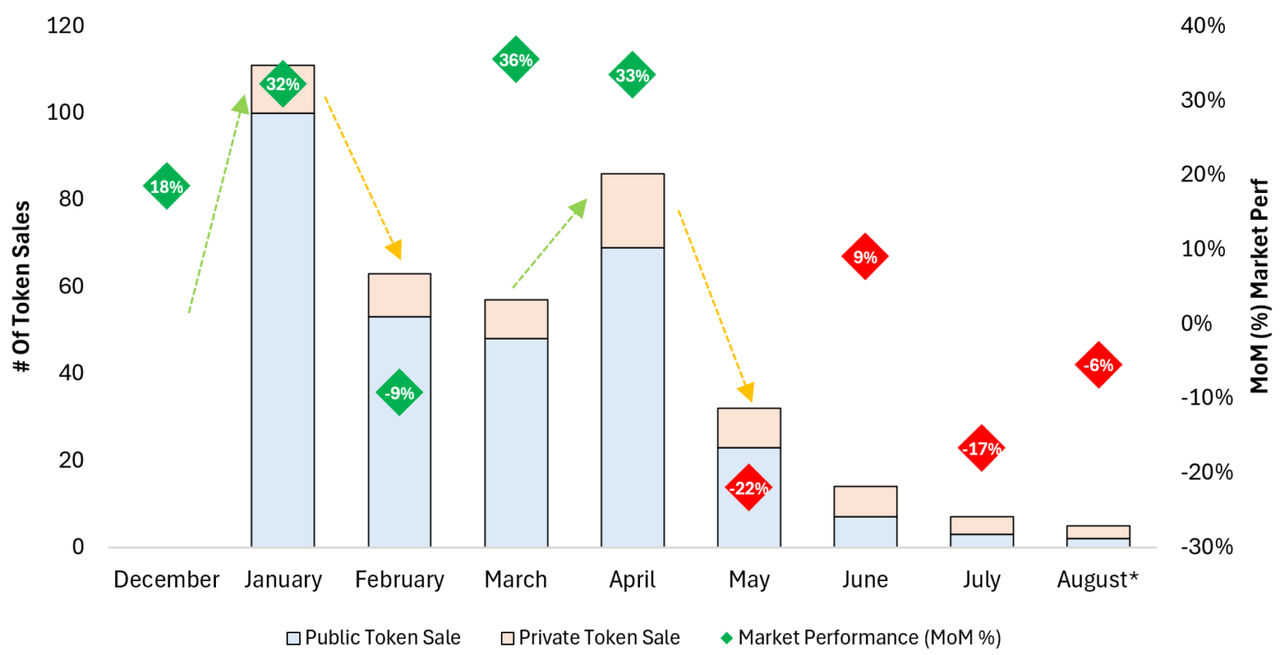
Over the past year, 375 tokens were launched in the crypto market: 70 via private sales and 305 via public sales. When plotting the number of token listings against changes in altcoin market cap, we observe a positive correlation: when altcoin market cap rises, the number of new token listings spikes the following month. Over recent months, activity declined due to holidays and weak market performance.
Comparison of Token Listing Volume and Altcoin Market Cap Changes
Further analysis reveals that not only overall listing volume but also the number of tokens launched via private sales correlates positively with market performance. This is expected, as public sales require more preparation time, which may cause projects to miss favorable market windows.
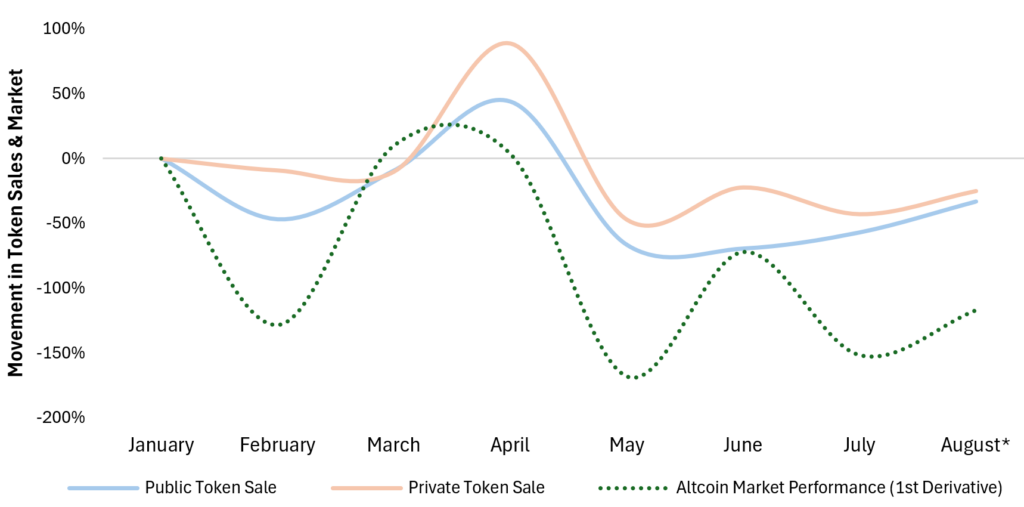
Number of Token Issuance Events vs. Monthly Altcoin Market Cap Growth
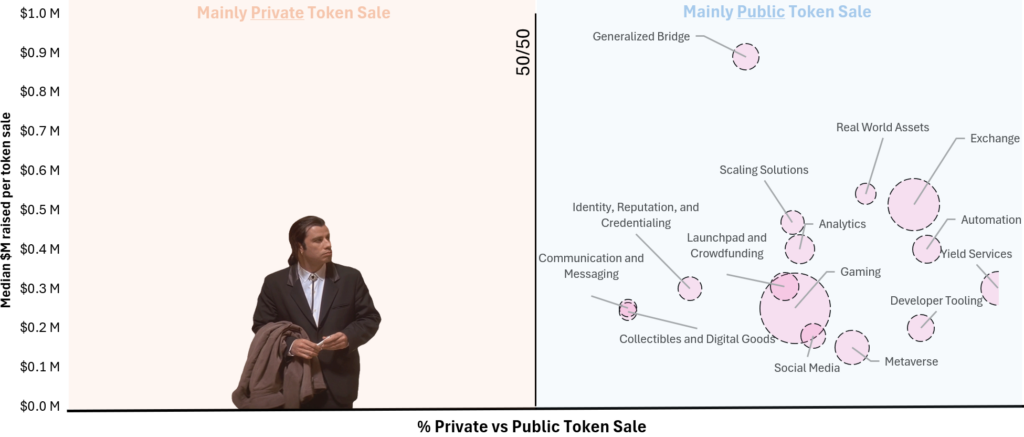
We also examined fundraising methods. Among newly launched tokens, approximately 81% used public sales. So far this year, no sector has seen more private sales than public sales.
The X-axis is split at the center: left side shows private sales, right side public sales. The Y-axis displays median funding amount raised, and bubble size reflects the number of token listings.
Gaming projects (82), exchange projects (44), DeFi yield protocols (19), and metaverse projects (19) accounted for the majority of token launches this year.
Relative Share of Public vs. Private Sales and Median Funding Amount
Traditional Venture Capital
We analyzed 1,919 funding events and derived the following insights:
-
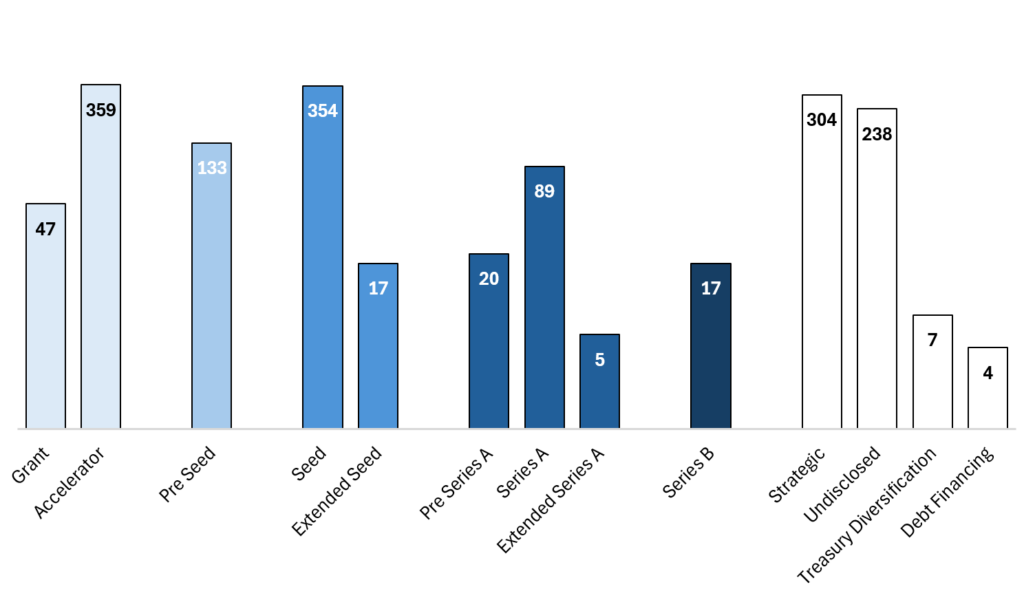
The Seed round is the most active funding stage, followed by accelerator programs and Pre-Seed rounds. As tokens launch, the gap between Pre-Seed and Seed rounds is narrowing.
-
As the cycle heats up, more ecosystems emerge, increasing the number of projects incubated by accelerators.
-
From the beginning of 2024, average funding sizes per stage were: $2.2M for Pre-Seed, $4.9M for Seed, $19.8M for Series A, and $51M for Series B.
Let’s examine these figures in detail. We find that the Seed round is the most active, followed by Pre-Seed. Interestingly, fewer companies now distinguish clearly between these two stages, as Seed rounds are sometimes replaced by private equity rounds.
Next, we observed a growing number of accelerator programs. According to our data, such programs have increased compared to last year, and many new Web3 accelerators have emerged. However, there's a data issue regarding grants. I believe the actual number of grants awarded to incubated projects is an order of magnitude higher than reported. Therefore, grants are not counted as formal funding rounds.
Number of Funding Events by Stage Year-to-Date
Plotting funding amounts yields the chart below. It's relatively common for projects not to disclose exact funding figures, but with a sufficiently large dataset, missing values can be reasonably inferred.
The gray areas in the chart represent estimated data. To minimize distortion from outliers, we used a conservative approach combining median and mean values to calculate totals.
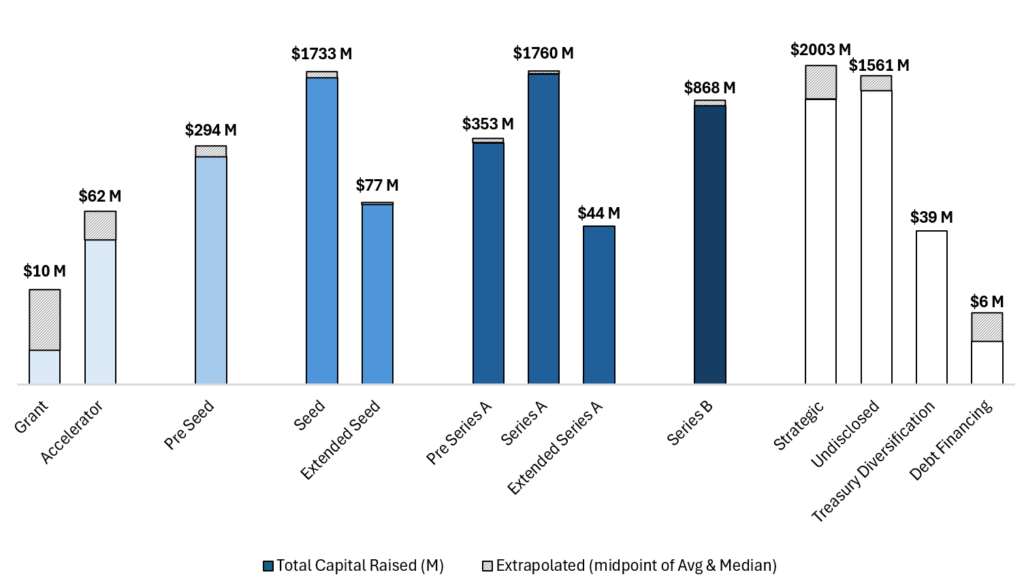
Total Funds Raised by Stage
Using both charts above, we approximated the average funding amount per stage year-to-date by dividing total funds raised by the number of deals. While not perfectly precise, the results align closely with our internal benchmarking analyses for clients.
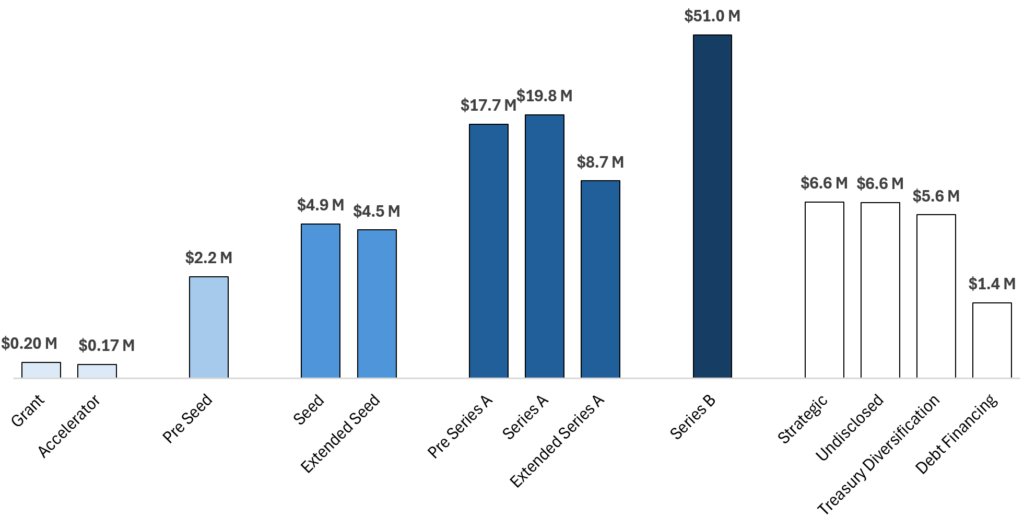
Average Funding Amount by Stage
Finally, we studied how funding sizes for Pre-Seed, Seed, and Series A rounds evolved over time. Data suggests that despite market volatility, Pre-Seed and Seed funding sizes are relatively insulated from market swings, as early-stage projects focus on innovation.
In contrast, Series A rounds occur closer to or during TGE (Token Generation Event), requiring teams to demonstrate product-market fit. Market downturns usually impact later-stage investments more severely, leading to reduced fundraising activity and lower deal sizes — as seen in 2022.
The increase in early-stage funding size since January 2024 may reflect investor sentiment that the market is transitioning from a turbulent late-cycle phase into an early recovery phase, fueling robust投融资 activity at the start of the year.
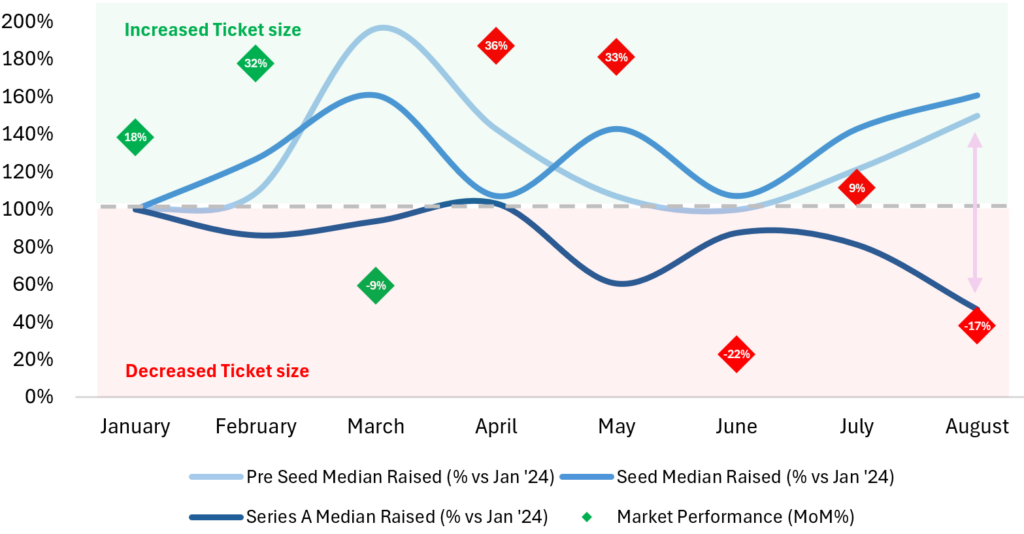
Change in Funding Size by Stage Compared to January
Data Adjustments
Key Insights:
-
Token listings often coincide with Seed, Series A, or strategic funding rounds.
-
The most common short-term funding combination is Accelerator + Seed. Many projects complete new funding shortly after joining or upon finishing accelerator programs.
We report all cryptocurrency industry funding data from the beginning of 2024. However, some data collection challenges must be noted.
In our dataset, 1,392 companies registered funding information across multiple channels, falling into two categories:
-
Companies completing multiple funding rounds within one year.
-
Companies conducting both traditional venture capital and on-chain token fundraising.
Below are the most common funding combinations. The most frequent is Accelerator + Seed, which makes sense: accelerator programs help reduce business model risk, and founders often join them while preparing for Pre-Seed or Seed rounds. We also observe public token sales occurring alongside strategic or Seed rounds, typically timed with or just before TGE. Additionally, only four companies completed both Seed and Series A rounds simultaneously this year.
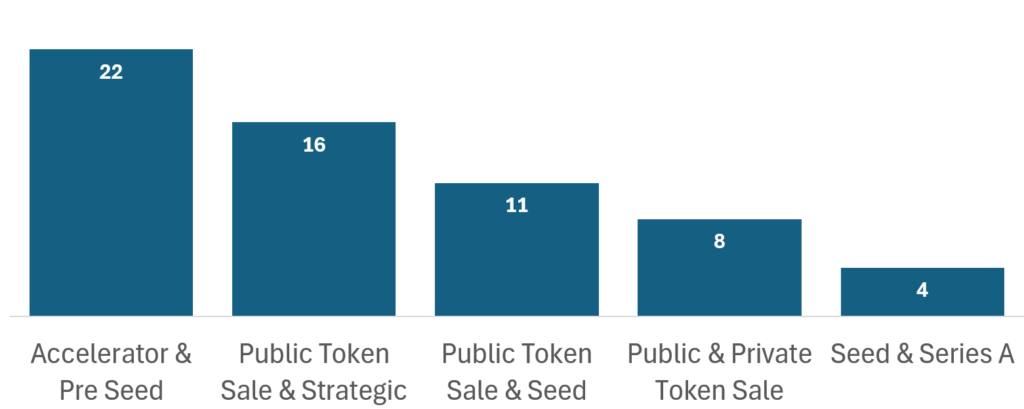
Funding Structures and Their Adoption Frequency
We highlight these trends to inform project founders: non-traditional funding structures are not rare. We strongly recommend founders consider combining traditional equity financing with token-based fundraising.
Join TechFlow official community to stay tuned
Telegram:https://t.me/TechFlowDaily
X (Twitter):https://x.com/TechFlowPost
X (Twitter) EN:https://x.com/BlockFlow_News