








Is Rollup Overvalued or Undervalued? An Analysis of Rollup Revenue and Cost Structure
TechFlow Selected TechFlow Selected
Is Rollup Overvalued or Undervalued? An Analysis of Rollup Revenue and Cost Structure
Although the Rollup L2 ecosystem faces challenges such as revenue model adjustments and insufficient user attraction, it has made significant progress in pursuing lower Ethereum transaction costs and improved efficiency.
 Navigating Web3 tides with focused insights
Author: Danny
Translation: Baicai Blockchain
The Ethereum Rollup Layer 2 ecosystem is thriving, with total daily locked value (TVL) exceeding $37 billion. However, the short-term price performance of Rollups has not met expectations. In terms of fully diluted valuation (FDV), major Rollups such as Arbitrum have an FDV of $8 billion, Optimism $7.4 billion, Starknet $7.1 billion, zkSync $3.7 billion, while Solana's FDV stands at $77 billion.
From a revenue perspective, Ethereum generated $2 billion in income in 2023, while Arbitrum and Optimism mainnets produced annual revenues of $63 million and $37 million respectively. Newcomers showing strong performance this year, such as Base and zkSync, earned $50 million and $23 million respectively in the first half of 2024, compared to Ethereum’s $1.39 billion during the same period, indicating the gap has yet to narrow. Rollups have not achieved revenue scale comparable to Ethereum.
One factor is that applications on Rollups lack sufficient appeal to users—a common issue across most chains. Our question is: How effective are Rollups as infrastructure for mass adoption? Are they undervalued due to their current low activity levels?
It all circles back to the original premise: Rollups emerged due to increasing congestion on Ethereum and unacceptably high user costs. Rollups were fundamentally designed to reduce costs. Beyond security purposes, Rollups possess a disruptive cost structure that becomes more economical as transaction volume increases. If this principle can be effectively realized, Rollups could hold irreplaceable value.
This article briefly analyzes the current economic structure of Rollups and explores future possibilities.
1. Rollup Business Model
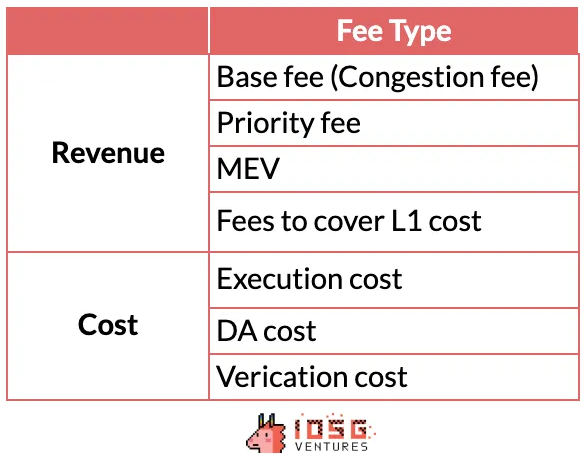
Rollups generate revenue by charging fees on transactions through the Sequencer—the entry point of cash flow—to cover costs incurred on both L1 and L2, while generating additional profit.
On the revenue side, fees include:
-
Base fees (including congestion fees)
-
Priority fees
-
Fees covering L1 costs
Additionally, protocols can capture potential revenue through:
-
MEV fees
On the cost side, expenses include relatively minor L2 costs and larger L1 costs such as:
-
Data availability (DA) costs
-
Verification costs
-
Execution costs
What distinguishes Rollups from other L2 solutions is their cost structure. The largest portion—DA costs—is considered a variable cost fluctuating with the amount of data submitted to L1, whereas verification and execution costs are treated more as fixed costs necessary to maintain Rollup operations.
Our goal is to clarify the marginal cost of Rollups—how much lower the incremental cost of an additional transaction is compared to the average cost per transaction. This analysis is crucial for validating the claim that “the more users, the cheaper Rollups become.”
The rationale behind this is that Rollups batch, compress, and aggregate data and validation, theoretically leading to lower marginal costs than other L1s. Fixed costs of Rollups should be well amortized across each transaction; when transaction volume is high, these fixed costs become negligible—but this also requires our verification.
2. Rollups Revenue
1) Transaction Fee Revenue
The primary source of Rollup revenue comes from L2 transaction fees. These fees aim to cover Rollup operating costs and generate a profit margin to hedge against long-term fluctuations in L1 gas costs. Some Rollups also charge priority fees, allowing users to expedite urgent transactions.
Arbitrum and zkSync use a first-come-first-served mechanism, processing transactions in the order they are received. The OP stack takes a more flexible approach, allowing users to "jump the queue" by paying a priority fee.
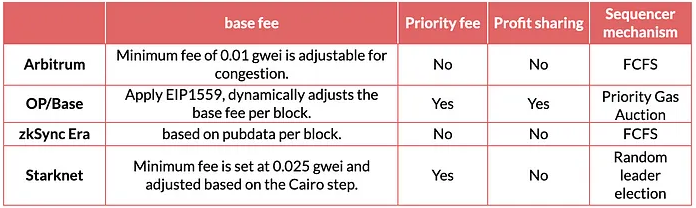
For users, base L2 fees during low-activity periods are determined by minimum fees. During busy times, congestion fees are charged based on each Rollup’s assessment of congestion levels, often growing exponentially.
Since L2 costs for Rollups are extremely low (limited to off-chain engineering and operational costs) and fee structures are highly flexible, nearly all income collected from L2 fees becomes protocol profit. Due to the current centralization of sequencers, governance bodies can relatively freely set fee parameters to meet short-term needs.
2) MEV Revenue
MEV transactions fall into two categories: malicious and non-malicious. Malicious MEV includes front-running attacks like sandwich attacks. Non-malicious MEV involves follow-up trades such as arbitrage and liquidations.
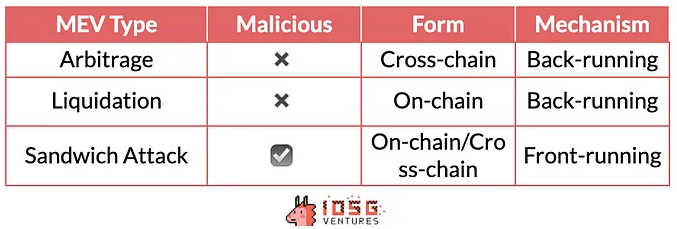
Unlike L1s, Rollups do not provide a public mempool; only the sequencer sees transactions before finality, so only the sequencer has the ability to initiate MEV on L2. Since most L2s currently operate centralized sequencers, the occurrence of malicious MEV is temporarily unlikely.
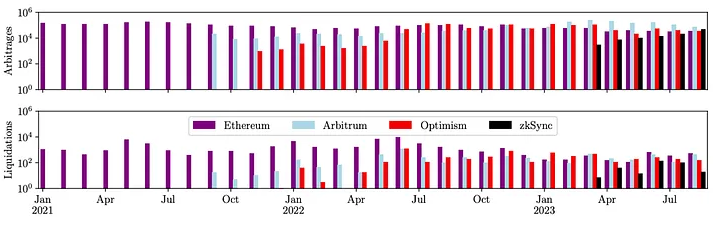
According to research by Christof Ferreira Torres et al., replaying transactions on Rollups concluded that Arbitrum, Optimism, and zkSync indeed participate in on-chain non-malicious MEV activities. These three chains collectively generated $22 million in MEV value, making it a significant revenue source worth noting.
3) Fees Covering L1 Costs
These fees are charged by Rollups to cover L1 costs. In addition to predicting L1 gas fees to cover L1 data costs, Rollups may collect extra fees as reserves to hedge against future gas price volatility—this effectively represents a form of Rollup revenue. For example, Arbitrum introduced a "dynamic" fee, while the OP Stack uses a "dynamic overhead" multiplier applied to fees. Before the EIP-4844 upgrade, these fees accounted for about one-tenth of DA costs.
4) Revenue Sharing
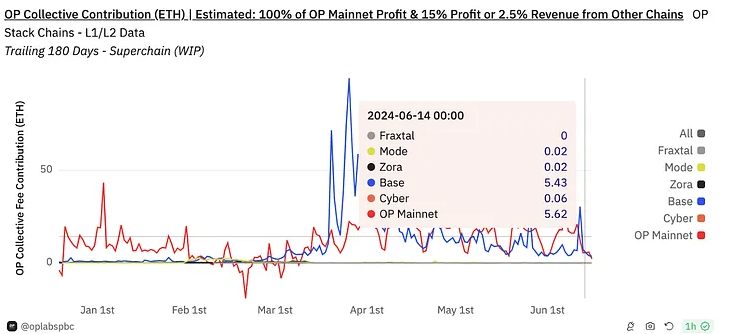
Base, using the OP Stack, has a special revenue-sharing model with the OP Superchain. Base commits to giving either 2.5% of its total revenue or 15% of L2 transaction profits (after deducting data submission costs to L1)—whichever is higher—to the OP Stack. In return, Base will participate in OP Stack and Superchain on-chain governance and receive up to 2.75% of the total OPToken supply. Latest data shows Base contributes approximately 5 ETH per day to Superchain revenue.
Clearly, Base provides a significant revenue stream for Optimism. Beyond cash flow, healthy network effects also make the OP Stack ecosystem more attractive to users and the market. Although some metrics of Arbitrum—such as TVL or stablecoin market cap—may exceed those of Base + Optimism combined, in terms of transaction volume and revenue, it no longer surpasses them. This is reflected in their price-to-sales (P/S) ratios—considering Base’s revenue, $OP’s P/S ratio is 16% higher than $ARB’s, reflecting the added value the ecosystem brings to $OP. (The P/S ratio is a financial metric measuring the relationship between a company’s market capitalization and sales revenue, used to assess valuation levels and market expectations for future sales growth.)
3. Rollups Costs
Ethereum L1 data costs vary per chain but generally break down into execution costs, data availability (DA) costs, and verification costs (for ZK Rollups).
1) Execution Costs
These primarily include state updates between L1 and L2 and cross-chain interactions.
2) DA Costs
This involves posting compressed transaction data, state roots, and ZK proofs to the DA layer. Before the EIP-4844 upgrade, L1’s primary cost—especially for protocols like Arbitrum and Base (over 95%) and for zkSync (over 75%) and Starknet (over 80%)—came from DA costs. After the EIP-4844 upgrade, DA costs dropped significantly, with reductions ranging from 50% to 99% depending on the Rollup mechanism.
3) Verification Costs
Primarily associated with ZK Rollups, these costs are for verifying the reliability of Rollup transactions via ZK methods.
4) Other Costs
These mainly include off-chain engineering and operational costs. Given current Rollup operations, node operation costs are close to cloud server costs and are relatively low (similar to enterprise AWS server costs).
4. L2 Profit vs. Other L1 Data Comparison
So far, we have a general understanding of Rollup's overall revenue and expenditure structure. We can now compare it with other L1s. We selected average weekly data from Rollups including Arbitrum, Base, zkSync, and Starknet to represent average Rollup performance.
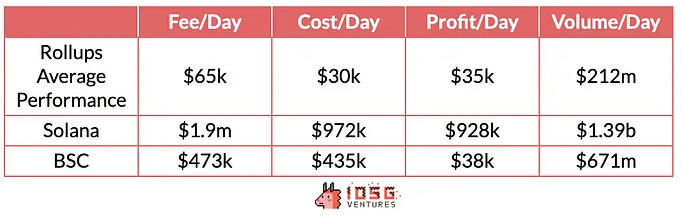
Overall profitability of Rollups is similar to Solana and clearly outperforms BSC, reflecting superior business model performance in profitability and cost management.
5. Comparison Among Rollups
1) Overview
Fundamental performance differences among Rollups at different stages are significant. For instance, transaction volumes spike notably around expected token airdrops. This surge is accompanied by significant increases in both revenue and costs.
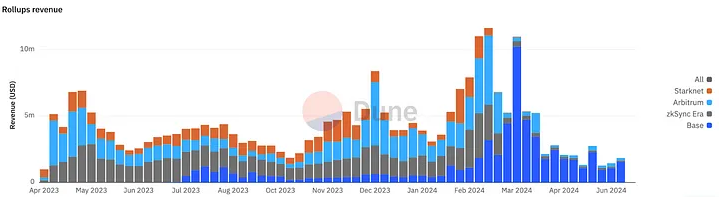
Most Rollups are still in early stages, where short-term profitability is less critical than ensuring financial sustainability and supporting long-term competitiveness. This aligns with Starknet’s current stance of not charging users extra profit-based fees.
However, since mid-March 2024, Starknet has been in continuous loss. What are the underlying causes of these losses? Will this situation persist long-term?
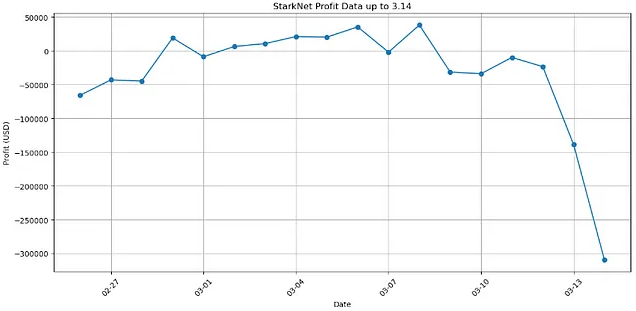
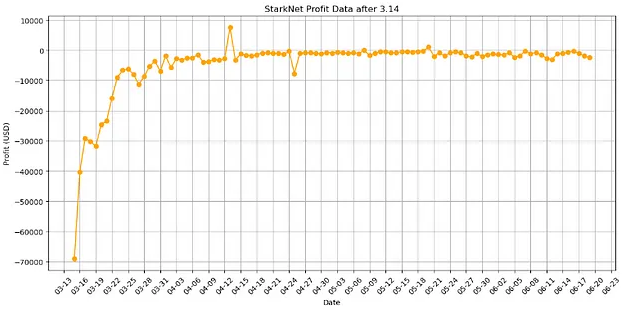
Let’s delve deeper. Marginal cost structures differ among Rollups based on the specific Rollup mechanism used by each chain, with variations in data compression techniques and other computational mechanisms causing cost differences.
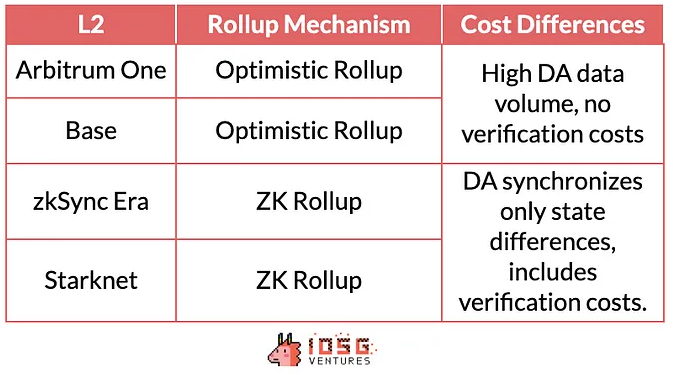
Our goal is to compare internal Rollup costs to help us horizontally evaluate the characteristics of different Rollups.
2) Cost Structures Across Different Rollup Types
A. ZK Rollups
ZK Rollups primarily differ in verification costs, which are typically seen as their fixed costs. These are difficult to offset through fee allocation and are fundamental reasons why Rollups fall into financial deficits.
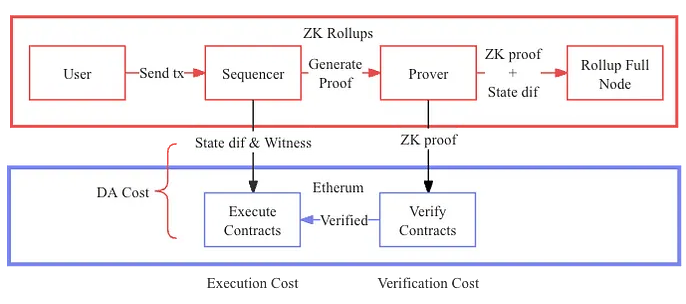
We’ll use Starknet and zkSync as examples.
Starknet
Starknet uses its proprietary SHARP service to handle transaction sequencing, confirmation, and block generation. After these steps, transactions are batched, and SHARP builds transaction proofs, which are then sent to the L1 contract for verification. Once approved, the proof is forwarded to the core contract. In Starknet, fixed costs for verification and data availability stem from block and batching processes.
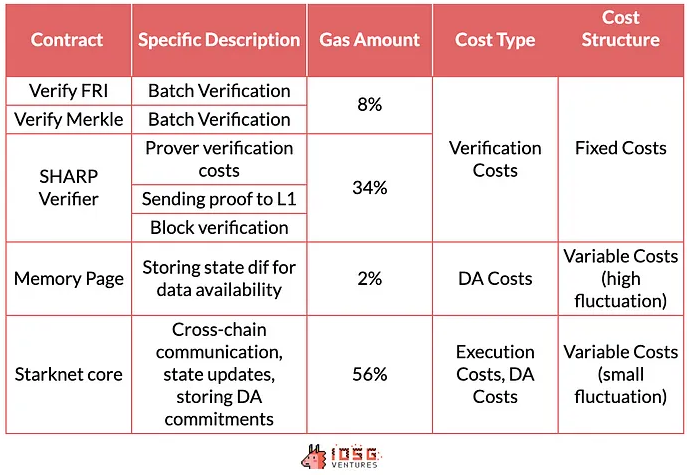
In Starknet, variable costs increase with transaction count, primarily due to data availability (DA) costs. Theoretically, DA costs should not impose extra burdens on users. However, in practice, Starknet charges transaction fees per write operation, while its DA cost is determined only by the number of updated memory units—not by update frequency per unit. Thus, Starknet previously overcharged for DA costs.
Transaction fee collection and operational cost payments occur at different times, potentially leading to latent losses or profits.
Therefore, as long as transactions continue, Starknet must continuously produce blocks and pay fixed costs related to blocks and batching. Moreover, the more transactions there are, the higher the variable costs. Fixed costs contribute little to marginal cost increases.
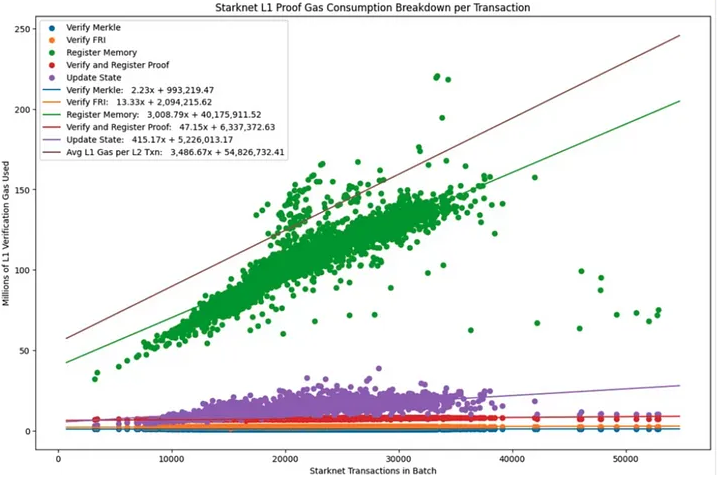
Due to computational resource limits per block (Cairo Steps), Starknet calculates gas fees based on resources used and data volume, covering both fixed and variable costs. However, allocating each block’s or batch’s cost to individual transactions is difficult. But since a block completes once a certain computational threshold (triggering fixed cost) is reached, part of the fixed cost can be calculated and charged based on resource usage.
Yet, due to block time constraints, if transaction volume is insufficient (low computational load per block), resource usage cannot effectively reflect allocable costs, thus failing to fully cover fixed costs. Additionally, “computational resource limits” may change with Starknet network parameter upgrades. A short-term major loss after EIP-4844 was exactly such a case—losses were only mitigated after adjusting computational resource parameters included in fee calculations.
Starknet’s fee model fails to effectively cover fixed costs within each transaction. Therefore, under mainnet updates and extremely low transaction volumes, it incurs losses.
zkSync (zkSync Era)
After the Boojum upgrade, zkSync Era shifted from block validation to batch validation and stores only state diffs, effectively reducing verification and DA costs. The process is largely similar to Starknet: the Sequencer submits batches to the Executor contract (state diffs and DA commitments), Prover nodes submit verifications (ZK proofs and DA commitments). Batch execution occurs after every 45 batches. The difference lies in Starknet incurring verification costs for both blocks and batches, while zkSync incurs them only for batches.
Cost Comparison Between zkSync and Starknet
Compared to zkSync Era, Starknet has much larger batch sizes. zkSync Era limits each batch to 750 or 1,000 transactions, whereas Starknet imposes no transaction limit per batch.
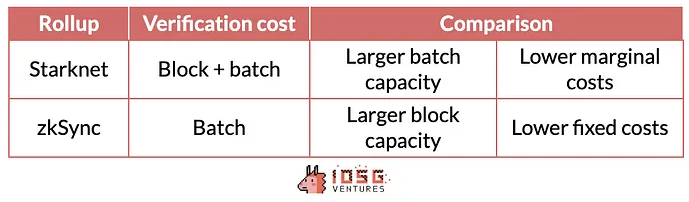
As shown in the table, Starknet possesses stronger scalability. Its per-block computational limit enables handling more transactions and batches, enhancing performance in high-frequency trading and scenarios involving numerous simple operations. However, during low-volume periods, Starknet faces high fixed costs. Conversely, zkSync, with its high compression efficiency and flexible block resources, adapts better to L1 gas price fluctuations and low-activity periods. Yet, zkSync has limitations in block generation speed.
For users, Starknet’s fee model tends to be friendlier, less correlated with L1, and offers stronger economies of scale. zkSync’s fees are more cost-effective but subject to greater volatility relative to L1. For Rollups, during low activity, Starknet’s high fixed costs may lead to losses, while zkSync is better suited for such conditions. Starknet is more suitable for handling large volumes of high-frequency transactions while controlling costs, whereas zkSync’s current mechanism may lag slightly under high transaction loads.
B. Optimistic Rollups
Optimistic Rollup cost structures are relatively simple. Without verification costs, users only pay L2 computation costs and DA costs for posting data to L1. Each block—or some blocks—regularly uploads a state root to L1, often a fixed cost. Uploading compressed transactions represents predictable variable costs, evenly distributed across each transaction.
Compared to ZK Rollups, Optimistic Rollups have lower fixed costs, making them more suitable for moderate transaction volume scenarios. However, since each transaction requires a signature, DA or variable costs are higher. During high activity, the marginal cost advantage of optimistic rollups diminishes.
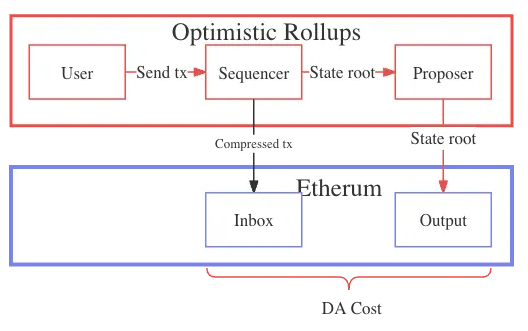
Given current adoption scales, ZK Rollup fixed costs may result in higher overall costs than Optimistic Rollups, thereby increasing user costs. However, ZK Rollup scalability advantages are significant: as transaction volume grows, verification costs gradually decrease, and the saved marginal costs will eventually surpass those of Optimistic Rollups. Additionally, running Validiums/Volitions requiring only state diffs for DA, along with faster withdrawal speeds, benefits scalability and RaaS ecosystems.
C. Data Comparison
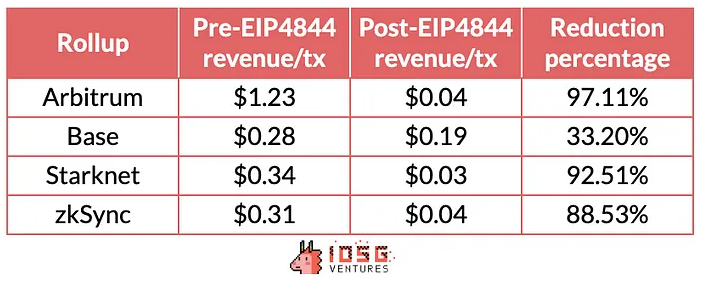
From the table, Base generates higher revenue per transaction, while Starknet generates less. Notably, before the EIP-4844 upgrade, Arbitrum had higher per-transaction revenue, but after the upgrade, Base’s per-transaction revenue increased.
D. Costs
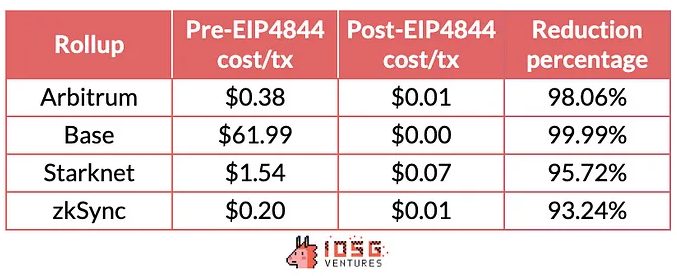
Based on cost per transaction, before EIP-4844, Base’s transaction costs were too high due to elevated DA costs, resulting in higher marginal costs. Expected economies of scale did not clearly translate into cost advantages. After the EIP-4844 upgrade, due to significantly reduced DA costs, Base’s per-transaction cost dropped sharply, becoming the lowest among all Rollups. Comparing OP and ZK types, it's evident that OP Rollups benefited more from the upgrade.
StarkNet’s DA costs decreased by roughly 4 to 10 times, slightly less than OP Rollups. This aligns with our theory: ZK Rollups did not benefit as much from the EIP-4844 upgrade as OP Rollups did. Post-EIP-4844 ZK Rollup cost performance also reflects the impact of fixed costs.
E. Profits
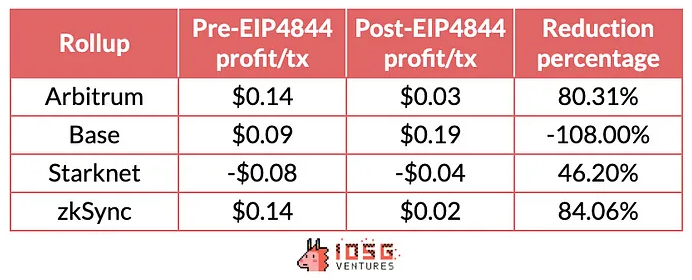
According to the data, Base enjoys the highest profit margin due to economies of scale, clearly surpassing Arbitrum. Among ZK Rollups, Starknet currently cannot cover its fixed costs due to low transaction volume, resulting in negative transaction profits, while zkSync, though profitable, remains constrained by fixed costs, yielding lower profits than OP Rollups. The EIP-4844 upgrade did not directly improve profit margins; the main beneficiaries will be users who experience significantly reduced cost expenditures.
6. Future Outlook
1) Cost Perspective
Currently, most Rollups remain in the early stage of the profit curve, where marginal costs and average fixed costs decline as transaction volume increases. However, in the future, as transaction volume rises within the L2 ecosystem, increased network capacity will cause average transaction costs to rise, leading marginal costs to gradually increase (as seen in Base’s performance from March to May). This is a critical issue that cannot be ignored for the long-term development of Rollups.
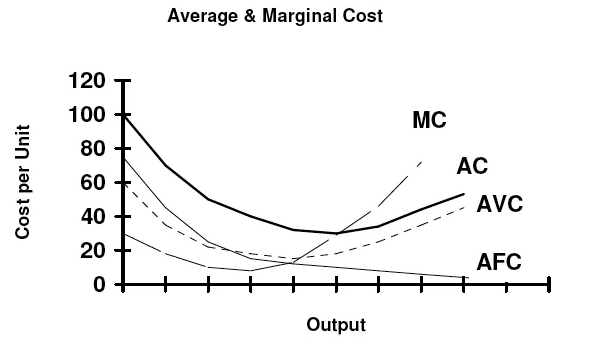
In the short term, for Rollups, more effectively reducing marginal costs is the best way to win in competition. Strategically, adjusting revenue and cost models according to market conditions is a sound solution.
2) Revenue Perspective
To maintain long-term competitiveness, ideally, protocols should avoid charging users extra fees—and may even subsidize users—to keep transaction costs low and stable. While priority fees can boost revenue, sufficient chain activity is essential.
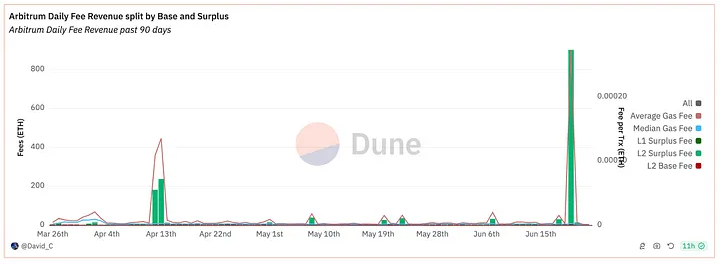
After EIP-4844, some Rollups (like Arbitrum) saw significant revenue declines due to the near elimination of hidden profits from DA data fees. Rollup revenue models have become simpler, focusing primarily on extracting income from L2 fees.
Overall, Rollup business models do benefit from economies of scale, especially ZK Rollups. It’s just that current market conditions are not favorable for Rollups to fully leverage their advantages.
Join TechFlow official community to stay tuned
Telegram:https://t.me/TechFlowDaily
X (Twitter):https://x.com/TechFlowPost
X (Twitter) EN:https://x.com/BlockFlow_News
 IOSG Ventures






