

Using a $1,000 hands-on example to instantly understand the impact of spot ETFs on Bitcoin's price
TechFlow Selected TechFlow Selected
Using a $1,000 hands-on example to instantly understand the impact of spot ETFs on Bitcoin's price
Take the full cycle of $1,000 flowing through an ETF as an example to understand the trading execution mechanism behind ETFs.
Author: Atlascap Invest
On January 10, the U.S. SEC approved 11 spot Bitcoin ETF applications, formally marking the entry of crypto assets into the core portfolio of global institutional investors. However, on the first day of trading, Bitcoin’s price moved completely contrary to the previously bullish market sentiment, dropping from $49,000 to a low of $41,500—erasing nearly all gains accumulated over the prior month. What exactly happened? Why did prices fall after ETF approval, and why has significant capital flowed out of the BTC market through ETFs rather than into it? After hands-on analysis, we take a close look at the full lifecycle of $1,000 invested in a Bitcoin ETF to reveal the underlying execution mechanics and help investors better navigate investment opportunities in the ETF era.
Part 1: Tracking $1,000 to Uncover the Capital Flow Behind ETFs
First, it's essential to understand the four key participants in the spot Bitcoin ETF ecosystem:
-
Sponsor: Responsible for designing and managing the ETF product, calculating its daily Net Asset Value (NAV), and charging management fees. The 11 currently approved sponsors include BlackRock, Fidelity, Ark, and Grayscale.
-
Authorized Participant (AP): The only entities authorized to directly create or redeem ETF shares with the sponsor, typically asset managers or broker-dealers.
-
Market Maker: Provides liquidity in the secondary market by buying and selling ETF shares. When liquidity imbalances arise, they coordinate with APs to create or redeem shares.
-
Investor: Individual or institutional buyers who trade ETF shares on the secondary market.
With these roles in mind, let’s follow $1,000 invested in a Bitcoin ETF to uncover how capital flows behind the scenes.
It’s important to note: because the U.S. SEC has only approved cash-based creation and redemption for spot Bitcoin ETFs, none of the current ETFs allow in-kind transactions. As such, capital flows operate exclusively through the following mechanism:
-
When you invest $1,000 in a spot Bitcoin ETF, you typically do so via a brokerage platform like Robinhood or Interactive Brokers (IBKR). Once your order executes at market price, your $1,000 flows to the market maker.
-
If multiple buy orders accumulate and the market maker lacks sufficient ETF shares to meet demand, the ETF price may rise above its NAV (creating a positive premium). To rebalance, the market maker requests new shares from an authorized participant (AP). A portion of your $1,000—say $200—is then transferred to the AP.
-
The AP, upon receiving the request and funds, submits a creation order to the sponsor, transferring the $200 to them.
The sponsor uses this $200 to purchase Bitcoin via platforms like Coinbase. Depending on the fund’s policy, the purchase may occur on the same day or within 1–2 days. Ultimately, this capital enters the cryptocurrency market.
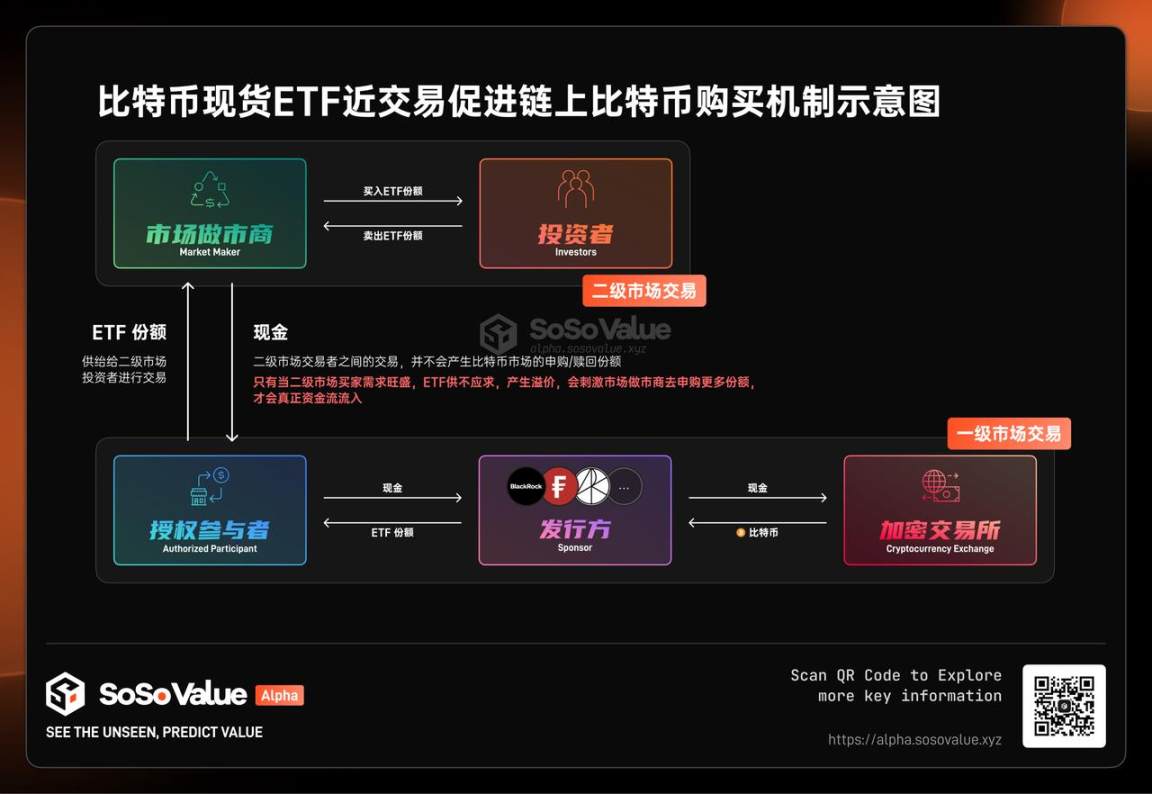
Part 2: Secondary Market ETF Trading Volume ≠ Net Inflow/Outflow to Bitcoin Market
From analyzing this capital flow process, we reach a critical conclusion: ETF secondary market trading volume ≠ net capital inflow/outflow into the Bitcoin market. These two figures are not equivalent, though they influence each other.
When assessing the impact of spot Bitcoin ETFs on Bitcoin’s price, the most important metric is how much USD actually flows through ETFs into the Bitcoin market to purchase physical Bitcoin—i.e., Total Net Inflow.
How is net inflow calculated? By aggregating the daily creation and redemption data across all 11 ETFs. Sponsors publish this data on their websites, and specialized tools like Bloomberg or SoSoValue’s ETF dashboard provide daily updates. For example, using SoSoValue’s ETF dashboard:
We observe that Grayscale’s GBTC saw $594 million in outflows on January 16 (the third trading day post-approval). Additionally, GBTC experienced redemptions on the first two trading days (January 11 and 12), with net outflows of $95 million and $480 million respectively—totaling $580 million in outflows. Despite combined ETF trading volumes reaching $4.67 billion and $3.19 billion on those days, and other ETFs like ARK, BlackRock, and Fidelity collectively gaining $1.4 billion in net creations, Grayscale’s massive outflows caused the overall net inflow to Bitcoin to fall far below expectations, triggering Bitcoin’s price correction starting January 12 (see chart below, January 12 snapshot).
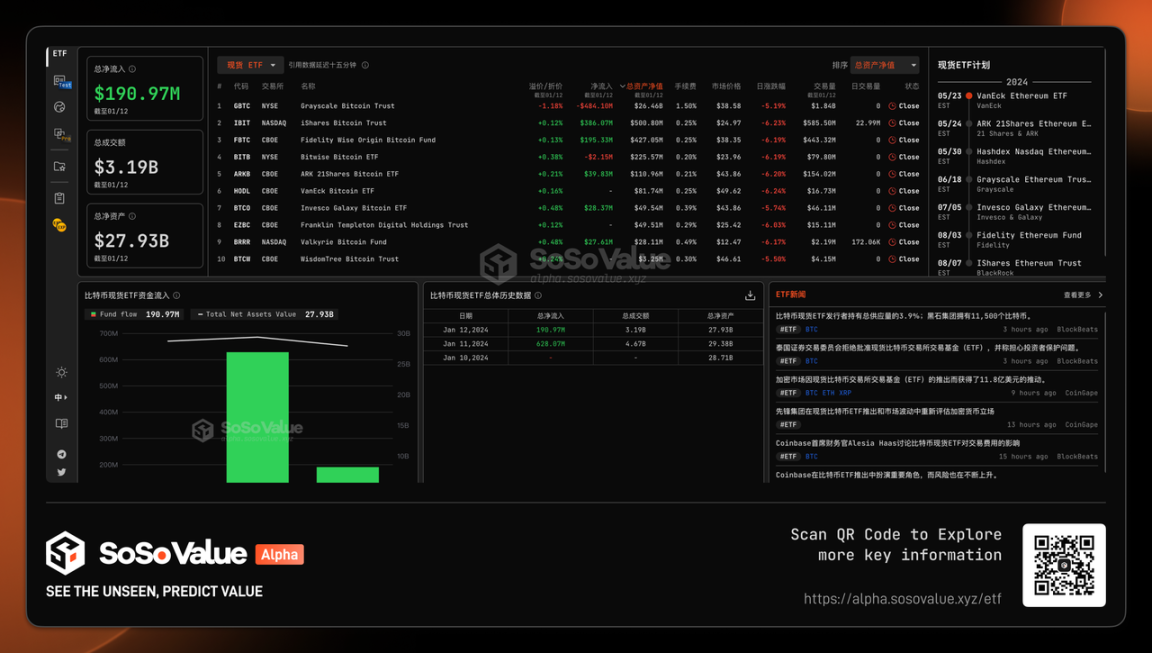
Source: SoSoValue, January 12, 2024 Snapshot Data
Part 3: Why Is Grayscale’s Bitcoin ETF Seeing Massive Outflows? How Long Will This Last?
Grayscale’s three consecutive days of redemptions have introduced approximately 26,000–28,000 BTC of sell pressure, increasing market caution. According to SoSoValue data, GBTC recorded outflows on January 11, 12, and 16, totaling $1.174 billion in net redemptions.

Source: SoSoValue, January 16, 2024 Snapshot Data
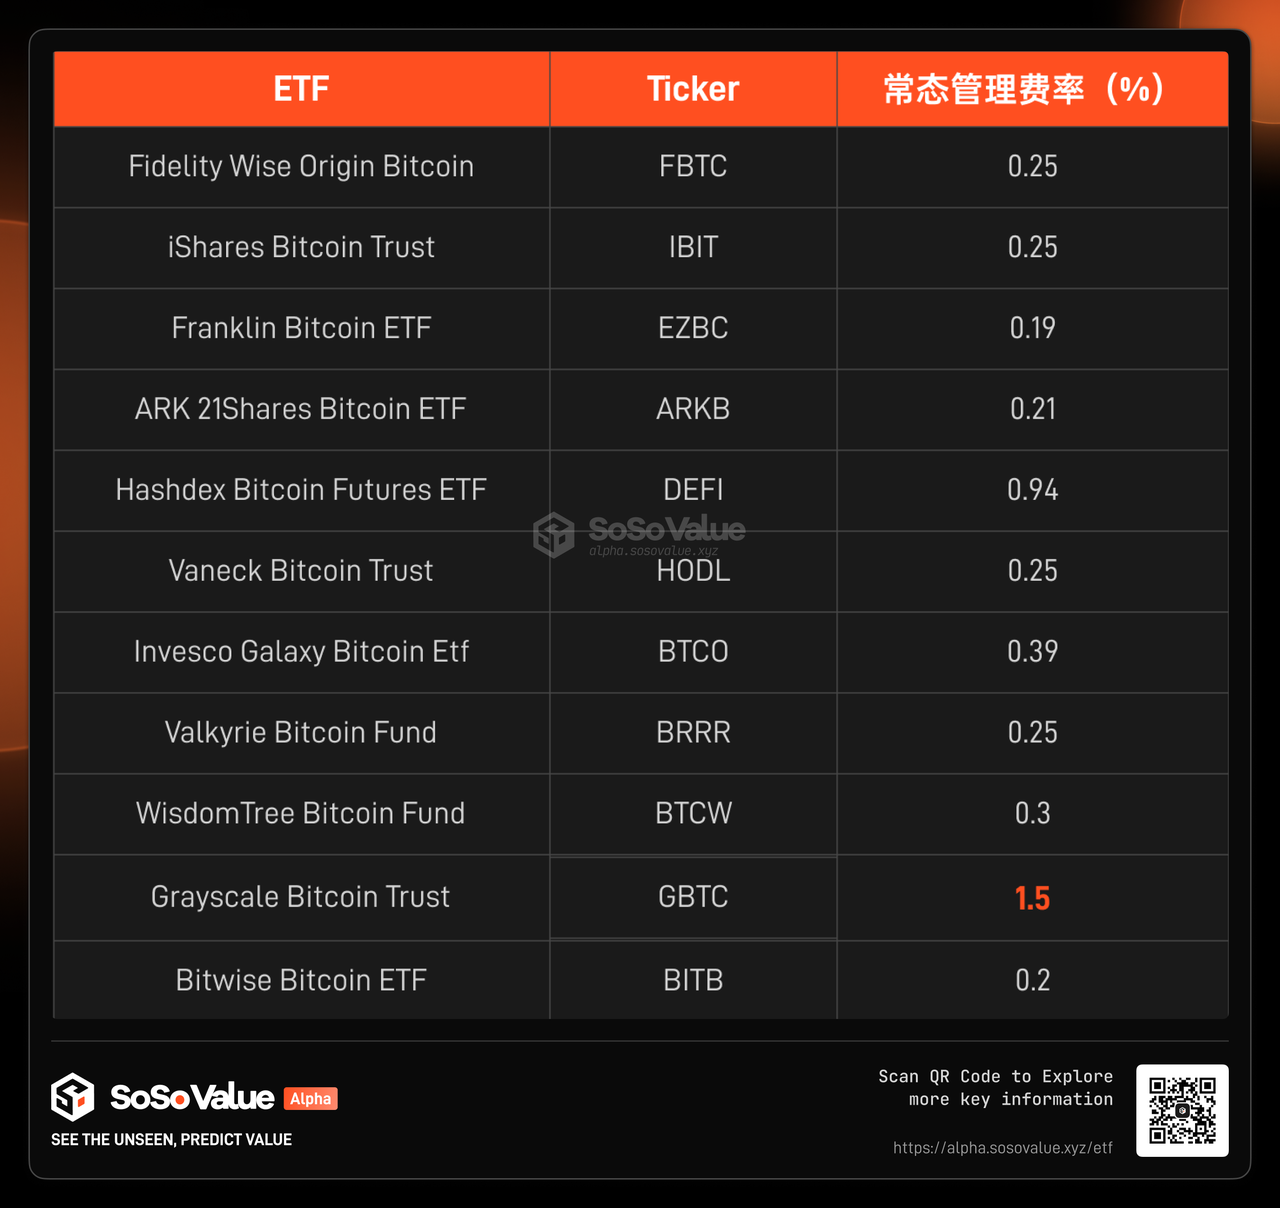
Two primary factors drive Grayscale’s outflows: a management fee six times higher than competitors, and the unwinding of pre-existing discount arbitrage positions.
Prior to January 10, Grayscale’s Bitcoin Trust (GBTC) operated as a closed-end fund—shares could be bought or traded but not redeemed. From a Bitcoin market perspective, this meant capital entering via GBTC was effectively locked in forever—a "Pilou" (mythical wealth-retaining creature) that only absorbs BTC without releasing it. Over its 8-year history, GBTC accumulated around 620,000 BTC. On January 10, after SEC approval to convert to an ETF, investors gained the ability to redeem shares via APs and convert holdings back into cash—opening a long-closed exit channel for this capital. We can categorize redeeming investors into two types; analyzing their motivations helps predict how long this outflow trend will affect Bitcoin’s price:
Type 1 Investors:
Long-term Bitcoin believers shifting holdings to lower-fee ETFs due to Grayscale’s high management costs. Among the 11 ETFs, GBTC charges a 1.5% management fee—5–6 times higher than rivals, most of whom charge under 0.3% and offer early-investor fee waivers. Large investors thus have strong incentives to switch from GBTC to cheaper alternatives. For instance, Ark, once a top-10 GBTC holder, is expected to migrate its position to its own ETF (ARKB). Whether BlackRock or Fidelity held prior GBTC positions remains unclear. Such migration creates timing lags between ETF outflows and new inflows into Bitcoin, and any resulting BTC price drop further dampens new capital inflows.
Type 2 Investors:
Arbitrageurs who bought GBTC at a discount and hedged with short BTC positions off-exchange. Following the FTX collapse and broader crypto turmoil, GBTC traded at steep discounts—up to 49%, and consistently around 20%—due to its non-redeemable structure. Six months ago, as expectations grew for SEC approval of spot Bitcoin ETFs, traders anticipated the discount would vanish once GBTC became redeemable. They began buying discounted GBTC shares while shorting BTC externally to capture the spread. By January 12, GBTC’s discount had narrowed to just -1.18%, prompting strong profit-taking incentives. Since most arbitrage positions were likely hedged externally, closing them should involve covering short positions—meaning this group’s activity should have minimal net impact on BTC price.
Based on this analysis, we conclude that Grayscale’s outflows will directly pressure Bitcoin’s price over the next 1–2 months. How long will this last? With Grayscale holding ~620,000 BTC and recent daily outflows averaging ~9,000 BTC, this net outflow pressure should subside within two months.
Part 4: ETFs Broaden Crypto Investor Base—Long-Term Bullish
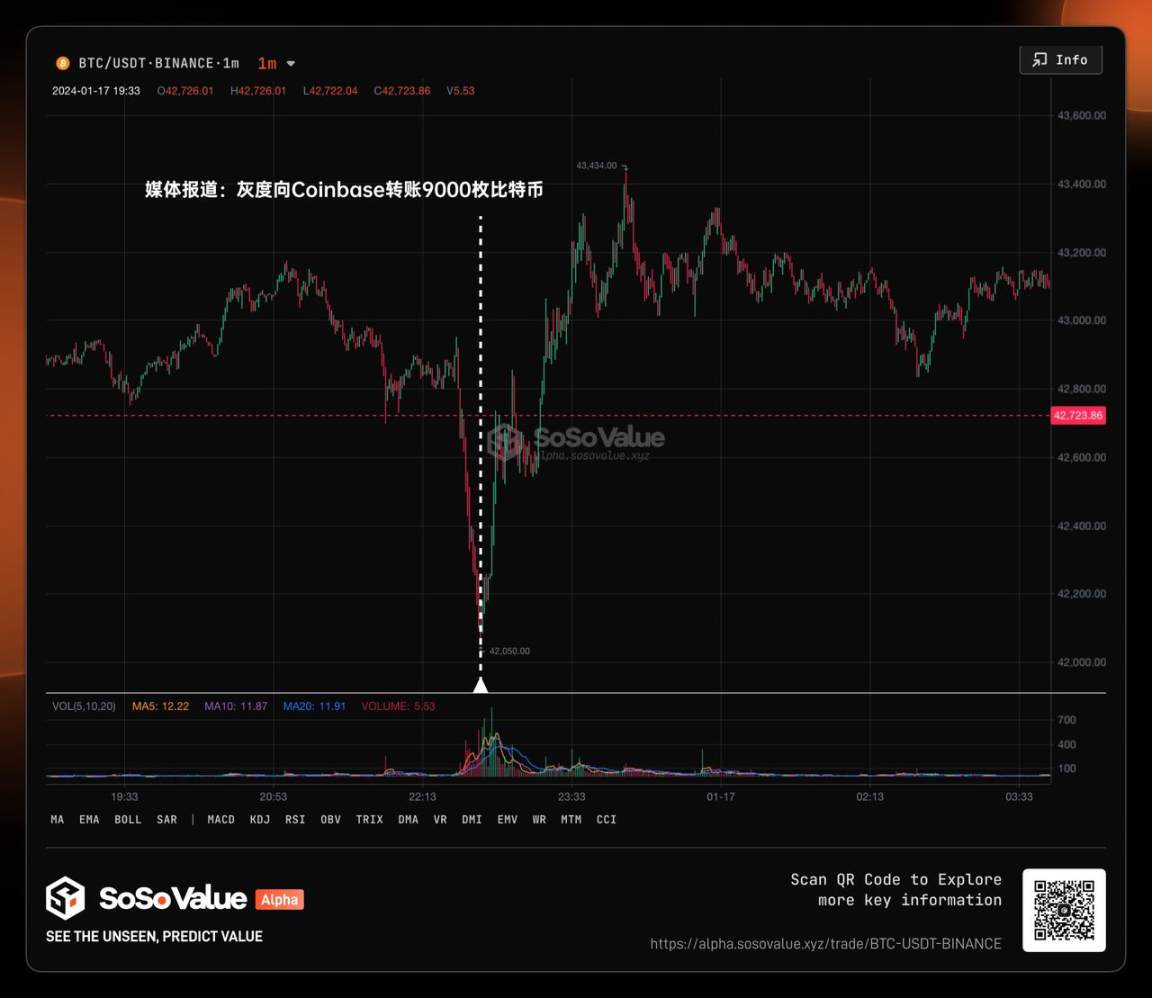
Although Grayscale’s outflows created short-term selling pressure, across all spot Bitcoin ETFs, there was still a net $740 million in Bitcoin purchases from January 11 to 16. BlackRock’s ETF (IBIT) led with $710 million in net inflows over three days. After news broke on January 16 that Grayscale transferred 9,000 BTC to Coinbase—sparking a sharp price drop—Bitcoin quickly rebounded to around $43,000, signaling potential stabilization.
The reason lies in scale: Grayscale’s redemption impact is temporary, while the broader inclusion of institutional investors through ETFs represents the dominant long-term narrative. As analyzed earlier, investors moving due to fee differences are expected to reinvest in other Bitcoin ETFs, sustaining demand. Arbitrage-driven redemptions are neutral. Meanwhile, consider the caliber of newly approved sponsors: BlackRock ($8.59 trillion AUM), Fidelity ($4.5 trillion AUM), and Invesco ($1.6 trillion AUM) rank among the world’s largest asset managers. BlackRock, Vanguard, and State Street are often called the “Big Three,” dominating U.S. index funds. By comparison, the entire crypto market caps at ~$1.7 trillion. These firms bring superior operational experience, rigorous compliance standards, and greater risk tolerance—bolstering investor confidence in Bitcoin as an emerging asset class. Moreover, their decades-built global distribution networks will significantly boost adoption of spot Bitcoin ETFs.
Part 5: Three Key Catalysts for Crypto in the Next Three Months
In order of significance:
1/ Bitcoin Halving:
Expected April 2024: New supply of Bitcoin will sharply decline, while demand rises via ETFs.
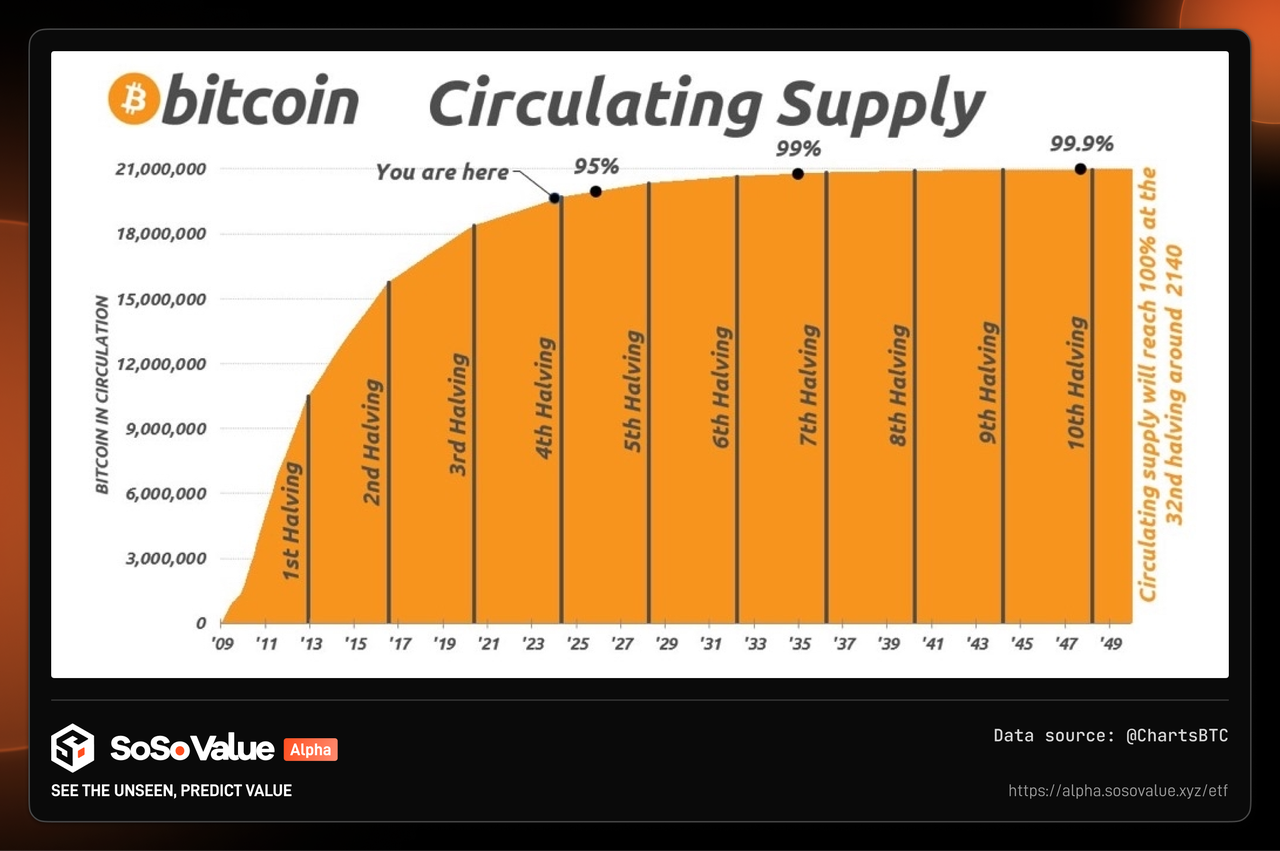
Bitcoin’s protocol limits total supply to 21 million via a halving mechanism every four years, cutting miner rewards in half. This upcoming halving will drastically reduce new Bitcoin issuance. Combined with growing demand from ETF inflows and a dovish Fed cycle favoring risk assets, many investors expect a clear bull run in 2024—often dubbed the “open-secret” bull market.
We can examine past performance post-halving:
-
First halving: November 2012, block reward reduced from 50 to 25 BTC. Price rose from $13 to $1,152 within a year.
-
Second halving: July 2016, reward cut to 12.5 BTC. Price climbed from $664 to $17,760.
-
Third halving: May 2020, reward halved to 6.25 BTC. Price surged from $9,734 to $67,549.
-
Next halving: Expected April 2024.
According to CoinShares, after this halving, the average operating cost per BTC mined (excluding one-time hardware costs) will rise to $37,856.

2/ Ethereum Spot ETF Approval:
Expected May 2024. BlackRock, Fidelity, and Invesco have also filed for spot Ethereum ETFs, with high approval likelihood. Following Bitcoin ETF approval, markets now anticipate Ethereum ETFs by May, and prices are already reflecting this expectation.
3/ Ethereum’s Dencun Upgrade:
Expected February–March 2024: Transaction costs on Ethereum Layer 2 networks will drop by up to 90%. The Dencun upgrade could be Ethereum’s “iPhone moment”—dramatically lowering fees and improving user experience, paving the way for mass-market dApps.

In most cases, people overestimate short-term impacts and underestimate long-term ones. The launch of spot Bitcoin ETFs is a milestone—the first gateway bringing crypto assets into the core financial system. Years from now, this will undoubtedly be seen as a lasting, transformative catalyst.
Join TechFlow official community to stay tuned
Telegram:https://t.me/TechFlowDaily
X (Twitter):https://x.com/TechFlowPost
X (Twitter) EN:https://x.com/BlockFlow_News


