
Token Terminal: In-depth analysis of L1 and L2 economic principles, operational data, and market performance
TechFlow Selected TechFlow Selected
Token Terminal: In-depth analysis of L1 and L2 economic principles, operational data, and market performance
Token Terminal has examined the blockchain economic models of major PoW- and PoS-based L1s and L2s, as well as emerging models from protocols such as liquid staking.
Author: Tokenterminal
Translation: TechFlow
We often intuitively experience the costs and revenues associated with using different blockchains—namely gas fees and incentives.
But do you truly understand their complete economic models? Where do gas fees and incentives come from, and where do they flow? How do different economic model designs perform in the market?
Token Terminal explores the economic models of major PoW- and PoS-based L1s and L2s, as well as emerging models from protocols like liquid staking. It breaks down and illustrates in simple terms the economic principles behind each blockchain's design.
Additionally, by visualizing daily fee changes across blockchains, it offers insights into the market performance of leading blockchains, enabling investors to use the framework in this article to compare blockchains’ economic performance, potential, and sustainability.
Introduction
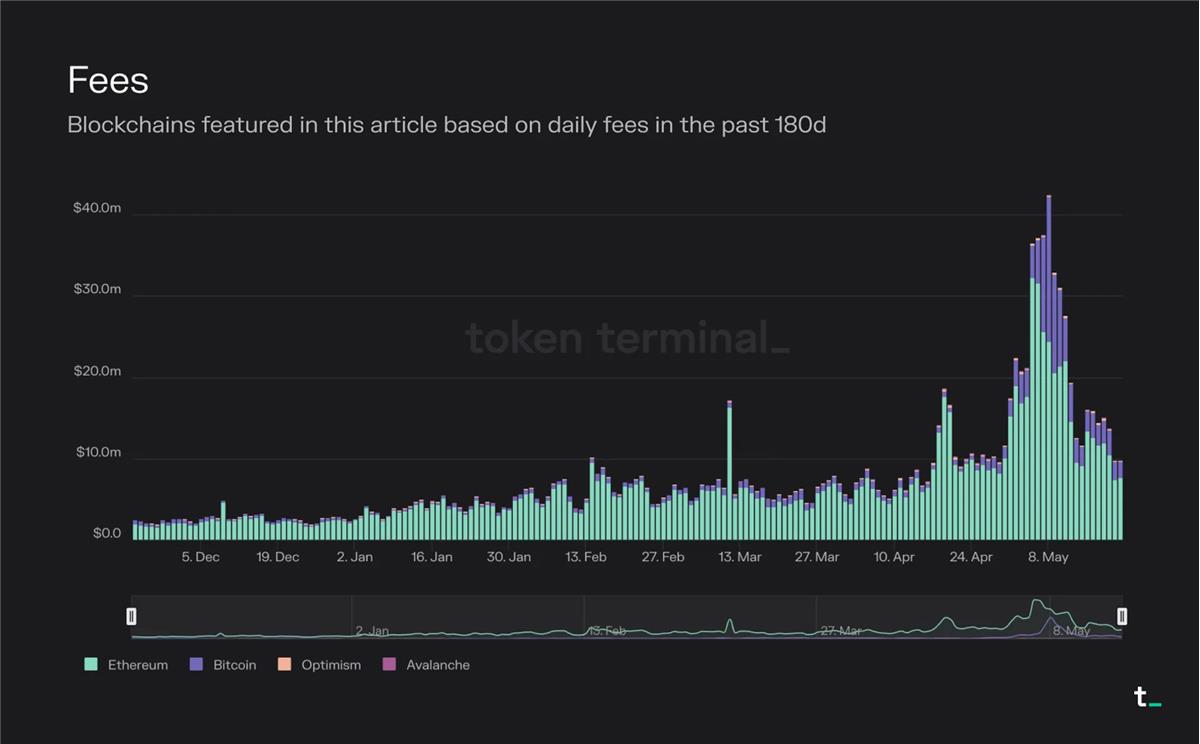
The chart below visualizes the daily fees of the blockchains mentioned in this article over the past 180 days.
TechFlow Note: Ethereum and Bitcoin remain far ahead in total transaction fees.
The key components that typically constitute a blockchain’s economic structure are transaction fees, inflationary block rewards (incentives), and fee burning.
Transaction fees represent the market price for block space.
Incentives are economic rewards encouraging participants to take actions (e.g., validating transactions).
Fee burning is a mechanism that removes part of each transaction fee from circulation.
Given the limited capacity of any single blockchain, we are moving toward a world of multiple distinct blockchains—each optimized for different use cases—interoperating with one another. The blockchain market was initially dominated by Bitcoin, an extremely simple and limited contract execution environment. With the launch of Ethereum, deploying arbitrarily complex contracts or programs on a blockchain became theoretically possible. Now, with the rise of scaling solutions, application-specific blockchains, and cross-chain bridges, deploying complex contracts has also become practical (scalability is no longer the bottleneck). In this article, we will break down the economic models of the most common types of blockchains.
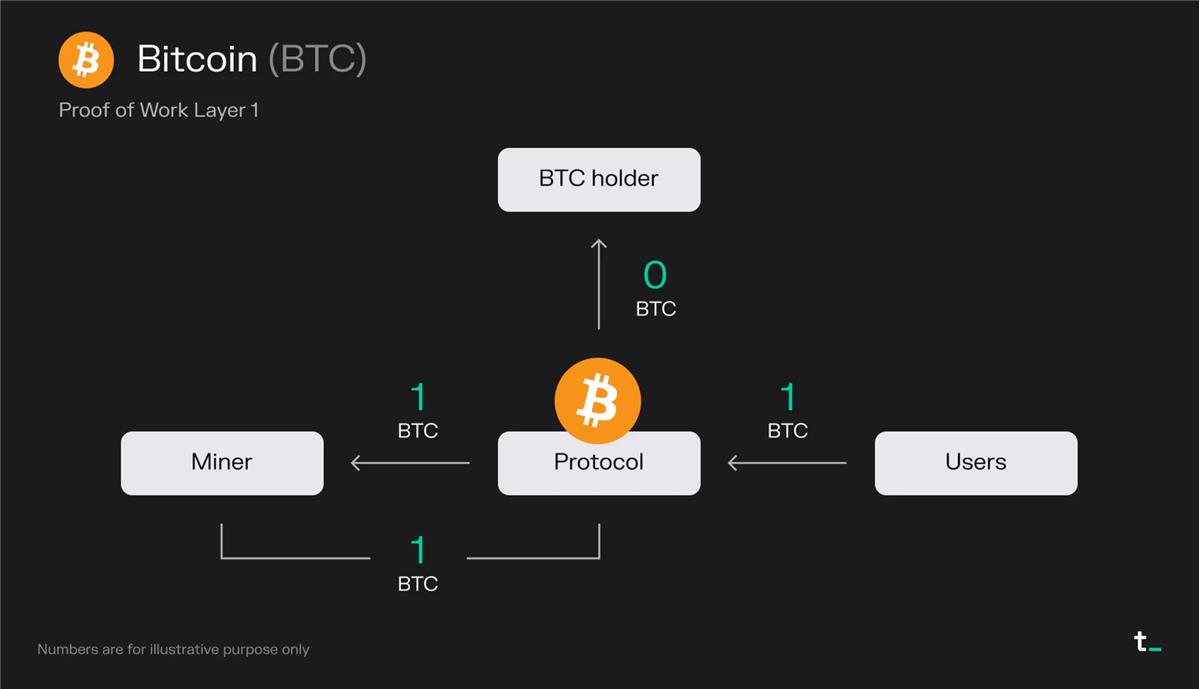
PoW-Based L1
Principle Explanation:
Users pay 1 BTC in transaction fees for a block
Miners receive all fees (1 BTC)
Miners receive 1 BTC from the block reward (newly issued BTC)
Final Outcome:
Miners receive 2 BTC
Key Points:
-
Demand for submitting transactions on Bitcoin creates a market for block space. Users pay miners for block space. Block subsidies further incentivize miners; these are newly minted bitcoins that increase the total supply of the currency. Currently, all fees and block subsidies on Bitcoin go entirely to miners.
-
Bitcoin secures itself through CPU power. Its value proposition is creating a secure, transparent, and immutable global ledger that enables trustless and irreversible value transfers. This security is derived from CPU usage. Each block requires substantial CPU effort to be validated on the network. Essentially, 1 CPU equals 1 vote on the network. Thus, the network remains secure as long as the majority of CPU power is held by honest miners.
-
Bitcoin’s economy is governed by two variables: transaction fees and block subsidies. Transaction fees are determined by supply and demand for block space. Block subsidies are inflationary rewards that increase BTC’s circulating supply. Currently, miners receive a 6.25 BTC reward per block, which halves every four years. Eventually, Bitcoin will reach its maximum supply of 21 million (projected around 2140), after which block rewards will consist solely of transaction fees. This means user adoption is crucial for the network’s long-term economic sustainability.
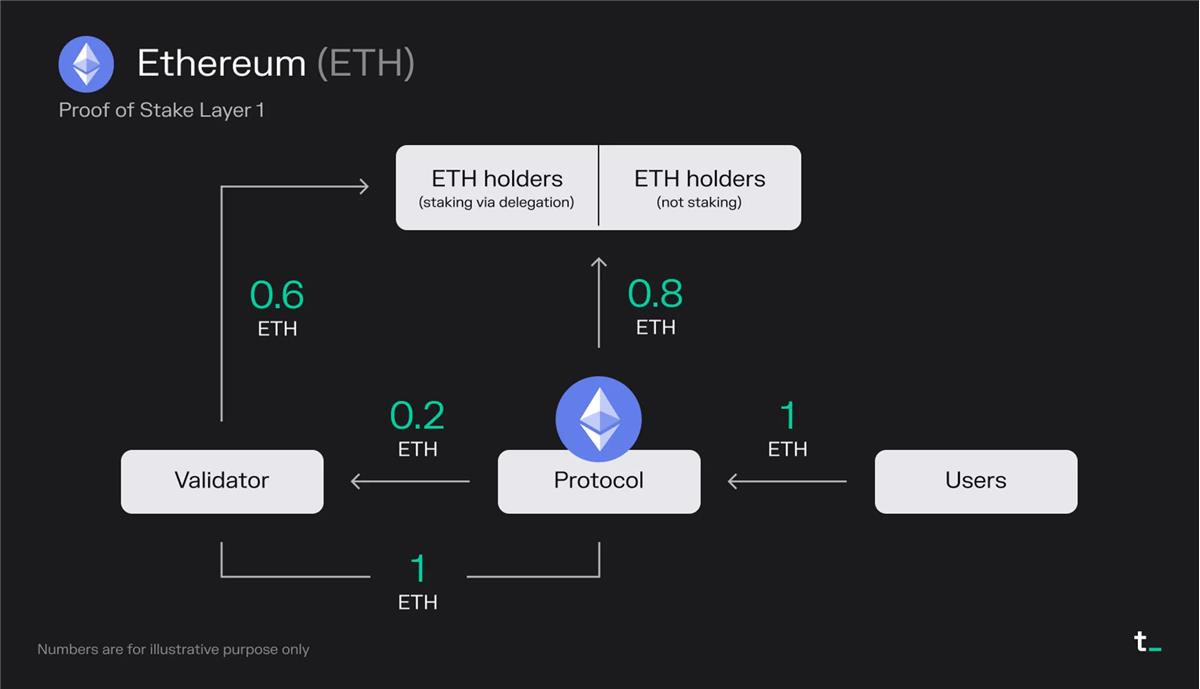
PoS-Based L1
Principle Explanation:
-
Users pay 1 ETH in transaction fees for a block (including MEV)
-
0.8 ETH is burned → a "stock buyback" that benefits all ETH holders equally
-
Validators earn 0.2 ETH from fees
-
Validators receive 1 ETH from the block reward (newly issued ETH)
-
Since validators already hold half of their stake from delegators, they must share 50% of their income with those ETH holders
Final Outcome:
-
0.8 ETH is burned
-
Validators receive 0.6 ETH
-
ETH holders who delegated receive 0.6 ETH
Key Points:
-
On Ethereum, approximately 85% of total transaction fees are burned, effectively acting as a "stock buyback" that equally benefits all ETH holders. Meanwhile, validators earn the remaining fees plus additional staking rewards (newly minted ETH). Over the past 30 days, Ethereum has collected an average of about $15 million in fees per day.
-
The fee-burning mechanism implemented via EIP-1559 in August 2021 transformed ETH into a productive asset. Additionally, the transition from PoW to PoS reduced the rate of new ETH issuance. Since The Merge in September 2022, Ethereum no longer distributes block rewards to miners. This change reduced new ETH issuance by about 90% (replacing ~14k ETH/day in block rewards with ~1.7k ETH/day in staking rewards), resulting in deflationary pressure on ETH supply during periods of high usage.
-
Ethereum’s economic model consists of three key elements: total transaction fees, portion of fees burned, and staking rewards. Transaction fees are set by supply and demand for block space. Staking rewards are inflationary, increasing ETH’s total supply. Fee burning exerts deflationary pressure on ETH’s circulating supply, which could increase token value over time.
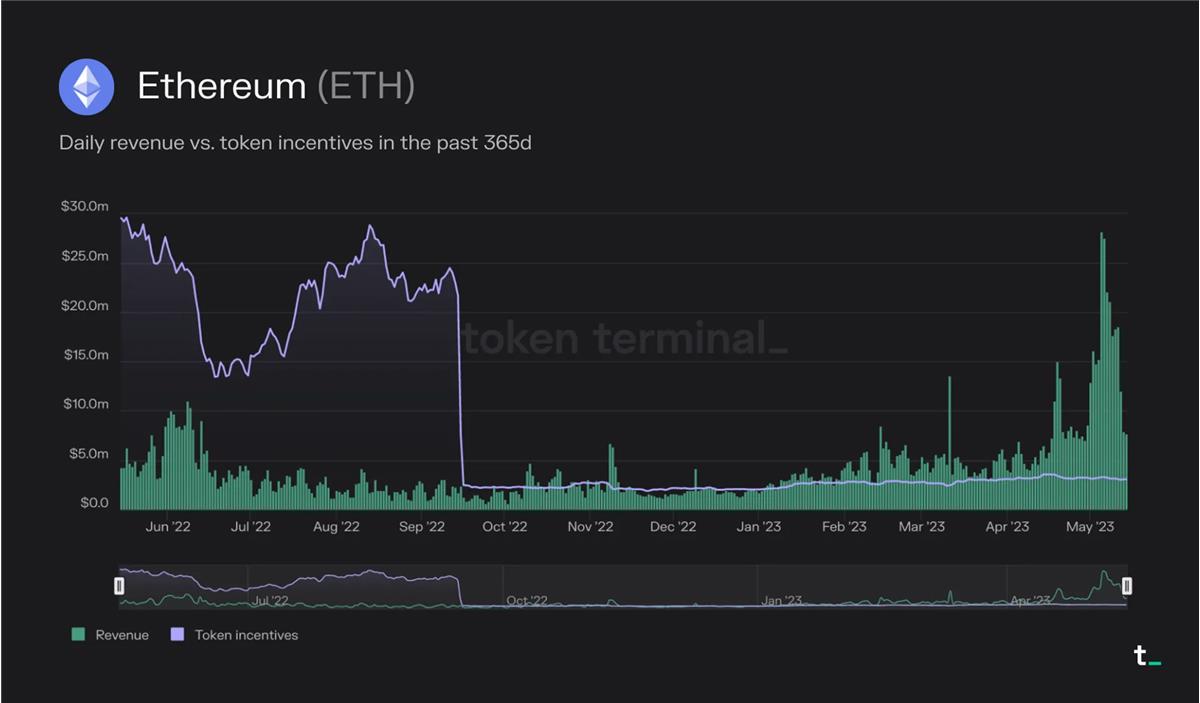
Post-Merge, ETH supply has been deflationary during periods of high usage. For example, in May this year, the amount of ETH burned (revenue) consistently exceeded the amount minted as staking rewards (token incentives).
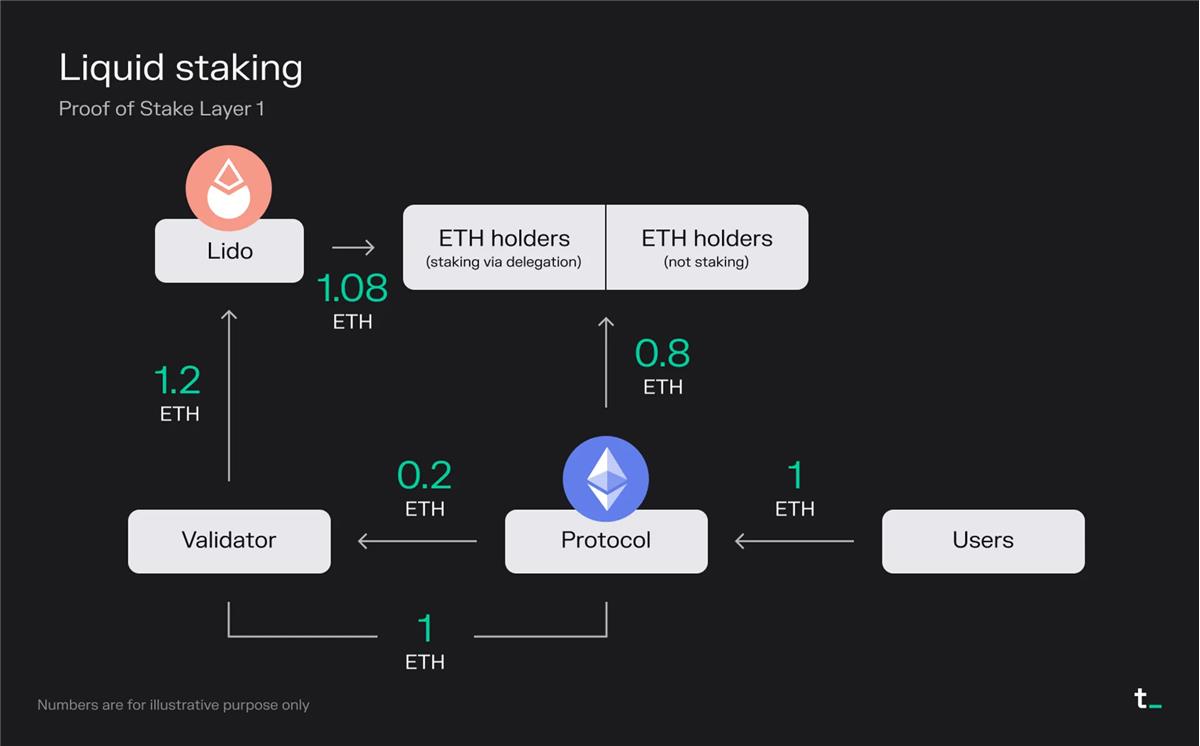
Liquid staking protocols allow users to stake their assets while maintaining liquidity through derivative liquidity tokens (liquid staking derivatives, LSDs) that represent the underlying assets.
Principle Explanation:
Users pay 1 ETH in transaction fees for a block (including MEV)
0.8 ETH is burned → a "stock buyback" that benefits all ETH holders equally
Validators earn 0.2 ETH from fees
Validators receive 1 ETH from the block reward (newly issued ETH)
Validators have received full stake from users depositing ETH via the liquid staking protocol Lido, so they share 100% of their revenue with these ETH holders
Lido takes a 10% cut (0.12 ETH) from the total staking rewards for providing the service, distributing the remaining 90% (1.08 ETH) to ETH holders who staked via Lido
Final Outcome:
0.8 ETH is burned
Validators receive 0 ETH
Lido receives 0.12 ETH (half of which covers node operator costs)
ETH holders who staked via delegation receive 1.08 ETH
Key Points:
-
Liquid staking protocols enhance user experience. Staking, traditionally a technical and high-maintenance process, has been simplified by protocols like Lido. By allowing users to lock up their ETH and receive a transferable utility token (stETH), Lido enables seamless staking while letting users earn rewards from validation activities. In return for this service, Lido takes a 10% fee from total rewards, split evenly between node operators and the Lido DAO.
-
The technical complexity and high capital requirements of staking create business opportunities for liquid staking protocols. Traditional Ethereum staking requires users to run a node, commit significant capital (32 ETH), and sacrifice token liquidity. In contrast, Lido aggregates users’ tokens and allocates them to validators, eliminating the 32 ETH barrier. By simplifying UX, providing liquidity, and democratizing staking, Lido and similar protocols are unlocking a rapidly growing market segment.
-
Democratizing staking allows broader investor participation. Alongside blockchain L2s, the liquid staking sector is one of the fastest-growing markets. The successful Shapella upgrade (April 12) arguably reduced risks associated with ETH as both an investment and yield-generating asset. As a result, the ETH staking ratio (staked assets / circulating market cap) is expected to grow and converge with other PoS chains. Currently, ETH’s staking ratio is around 15%, relatively low compared to other PoS chains. For instance, Solana and Avalanche currently have staking ratios above 60%. Given ETH’s large market cap (~$220 billion at the time of writing), we could see tens of billions of dollars in staked assets grow over the coming quarters.
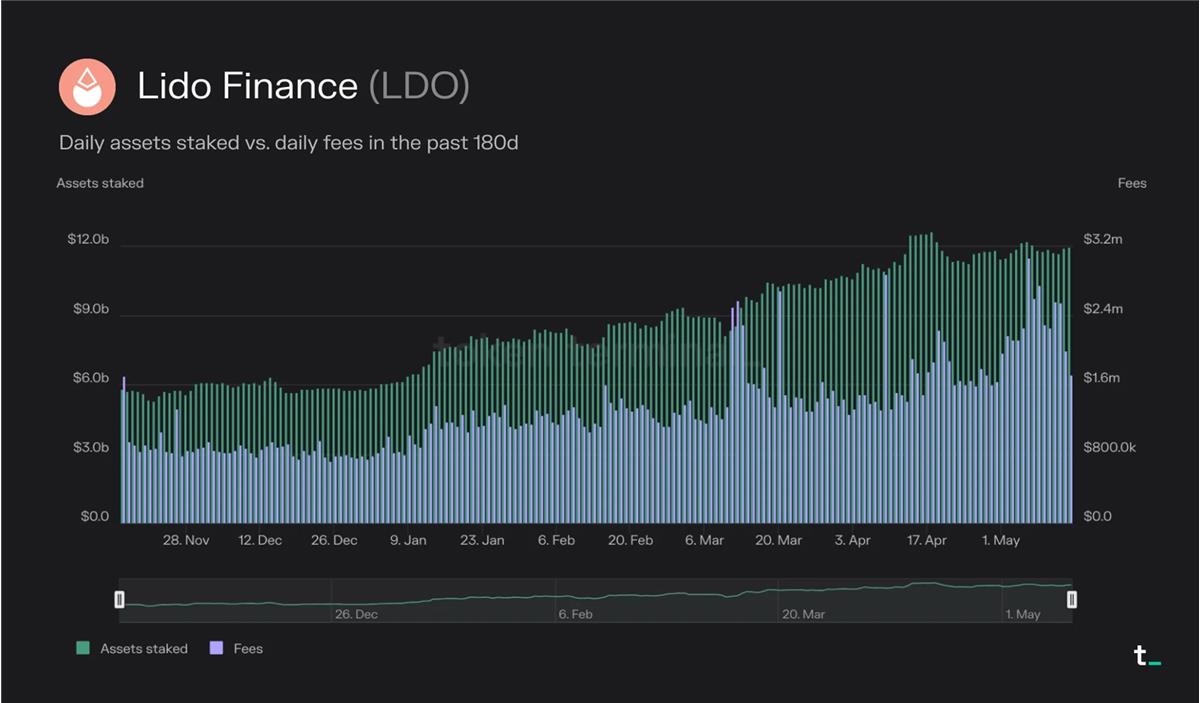
Lido has emerged as the current market leader in the liquid staking sector, with $12 billion in staked assets. This represents a 38% year-over-year increase and a 105% growth over the past 180 days.
Over the past 30 days, Lido generated $60.4 million in fees, taking a 10% cut ($6.04 million) as revenue. This revenue is split 50/50 between node operators and the Lido DAO.
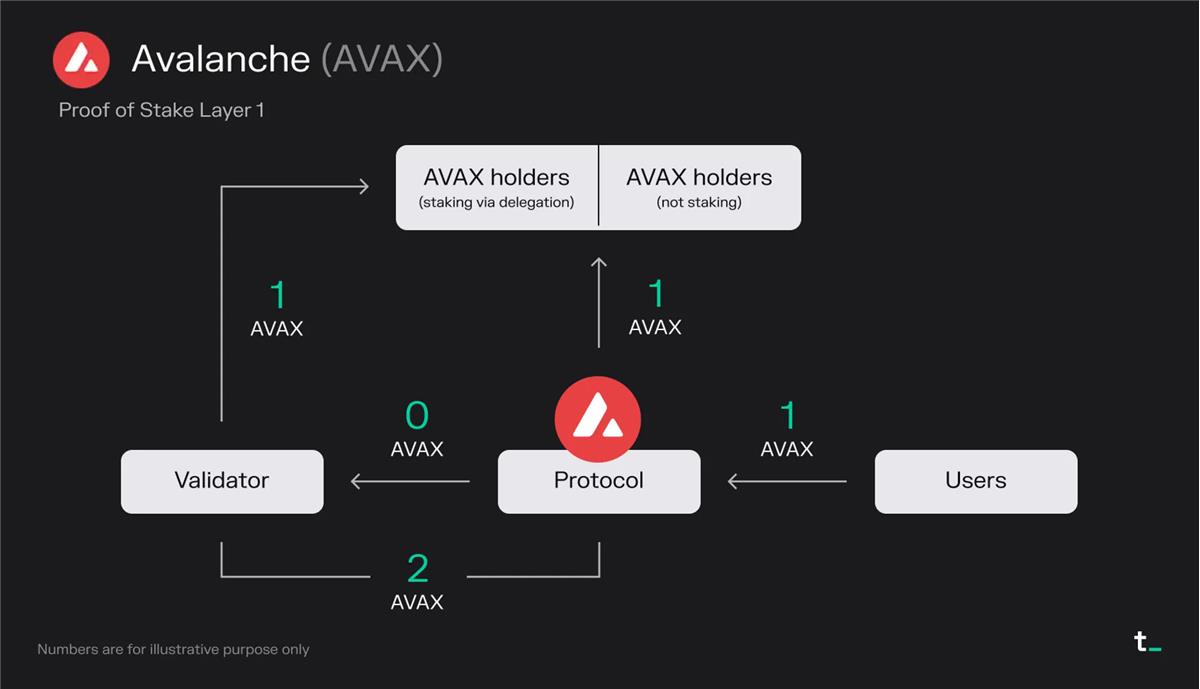
Avalanche is a blockchain (L1) competing with Ethereum by prioritizing scalability and faster transaction speeds. It uses a novel consensus algorithm that delivers strong security, fast finality, and high throughput while maintaining decentralization.
Principle Explanation:
Users pay 1 AVAX in transaction fees for a block
1 AVAX is burned → a "stock buyback" that benefits all AVAX holders equally
Validators earn 0 AVAX from fees
Validators receive 2 AVAX from the block reward (newly issued AVAX)
Since validators have received partial stake from delegators, they must share their income with those AVAX holders
Final Outcome:
1 AVAX is burned
Validators receive 1 AVAX
AVAX holders who delegated receive 1 AVAX
Key Points:
-
On Avalanche, all transaction fees are burned. Validators' sole income comes from staking rewards. The burn mechanism acts as a "share buyback," equally benefiting all AVAX holders. Over the past 30 days, Avalanche’s average daily fees were approximately $64,000.
-
As a relatively new entrant in the blockchain space, Avalanche is issuing large amounts of AVAX tokens to reward its validators. This approach is commonly used to bootstrap growth in the platform’s early stages. These rewards attract validators and stimulate growth and activity within the Avalanche ecosystem.
-
Avalanche’s economic model may evolve in the future. Fee and reward structures are not fixed and can be adjusted based on future governance decisions. Currently, 50% of the total AVAX token supply is allocated for validator staking rewards, distributed over ten years (2020–2030). As this distribution concludes, we may see a portion of transaction fees redirected to validators in the future.
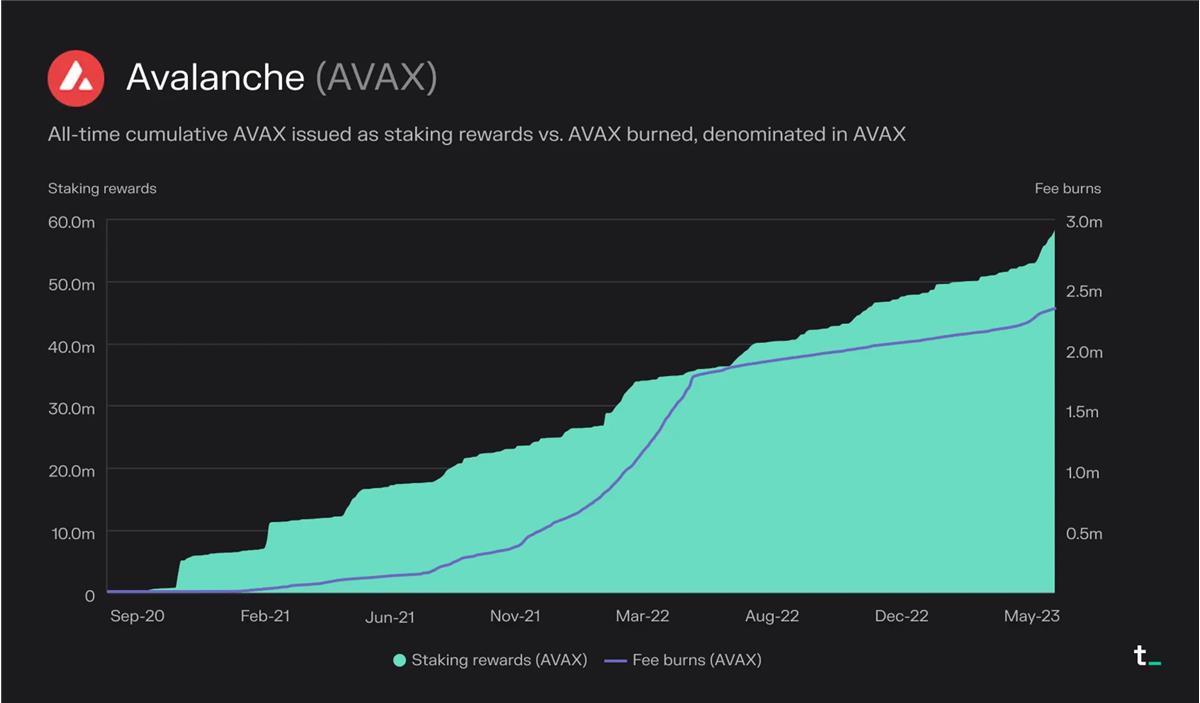
Since the network launched in September 2020, approximately 2.3 million AVAX have been burned, while about 57 million AVAX have been distributed as staking rewards.
PoS-Based L2
Optimism is a scaling solution (optimistic rollup) designed to make Ethereum better by improving its transaction speed and throughput. Optimism executes transactions on L2 and batches them for finalization on L1. Depending on transaction type, this results in roughly 5–20x lower gas costs.
Principle Explanation:
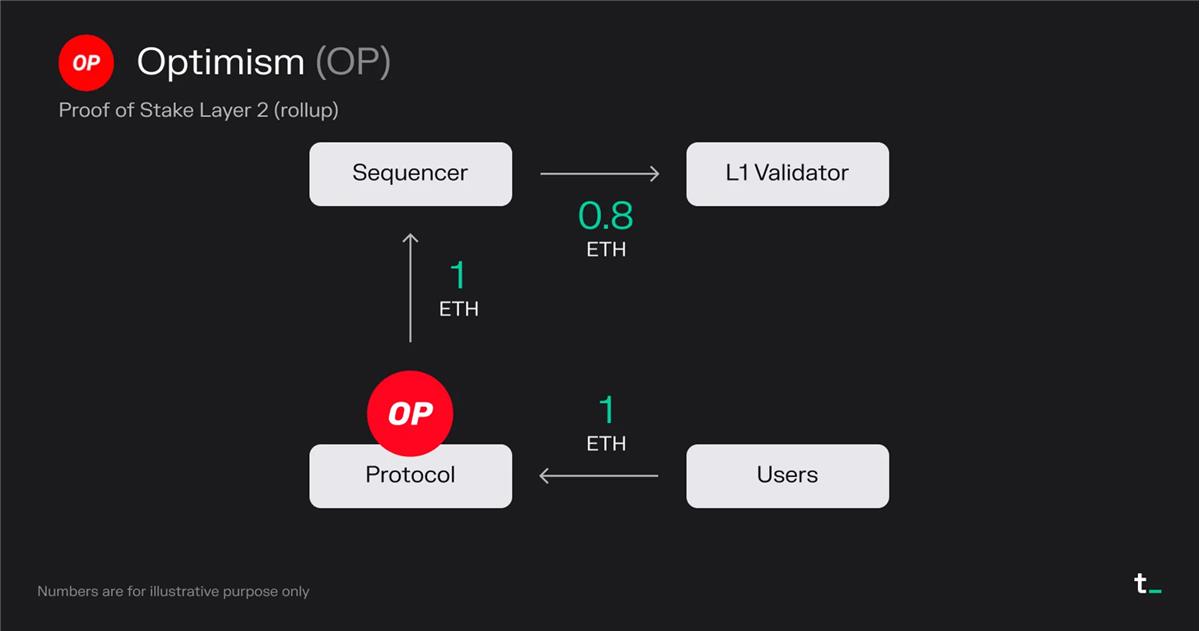
Users pay 1 ETH in transaction fees for a block
All transaction fees (1 ETH) go to the sequencer operated by the Optimism Foundation
The sequencer pays 0.8 ETH in transaction fees to submit transactions to L1 (Ethereum)
The sequencer (in this case, the Optimism Foundation) retains 0.2 ETH as profit
Final Outcome:
0 ETH burned (excluding burns on Ethereum)
Sequencer receives 0.2 ETH
L1 validators receive 0.8 ETH
Key Points:
-
Layer 2 blockchains scale applications. L2 blockchains allow widely used L1 applications such as Uniswap, Blur, OpenSea, etc., to move their transaction activity off L1 onto a separate chain that periodically settles transactions back to L1. Currently, over 30% of Uniswap’s volume comes from L2s.
-
Layer 2 blockchains support more optimized user experiences. As an L2, the application can optimize UX (e.g., transaction fees, MEV capture and rebates, on-chain privacy) for its specific use case. Such optimizations are possible while still maintaining transaction records on the more secure L1.
-
The economics of Layer 2 blockchains are driven by two variables: fees collected on L2 and the cost of settling transactions on L1. The primary business model of L2 blockchains is generating revenue by capturing a portion of user-paid transaction fees. Profit margins are determined by the cost of settling transactions on L1. For example, users on Optimism have paid $38.2 million in transaction fees since launch. Of this, $28.5 million was spent on gas fees to submit transactions to Ethereum. Thus, Optimism captured the difference—$9.7 million—as revenue. As competition intensifies, L2 profit margins are expected to decline. L2 blockchains that can optimize their Ethereum gas expenditures through data compression and other techniques, thereby reducing L2 fees further, may gain market share in the future.
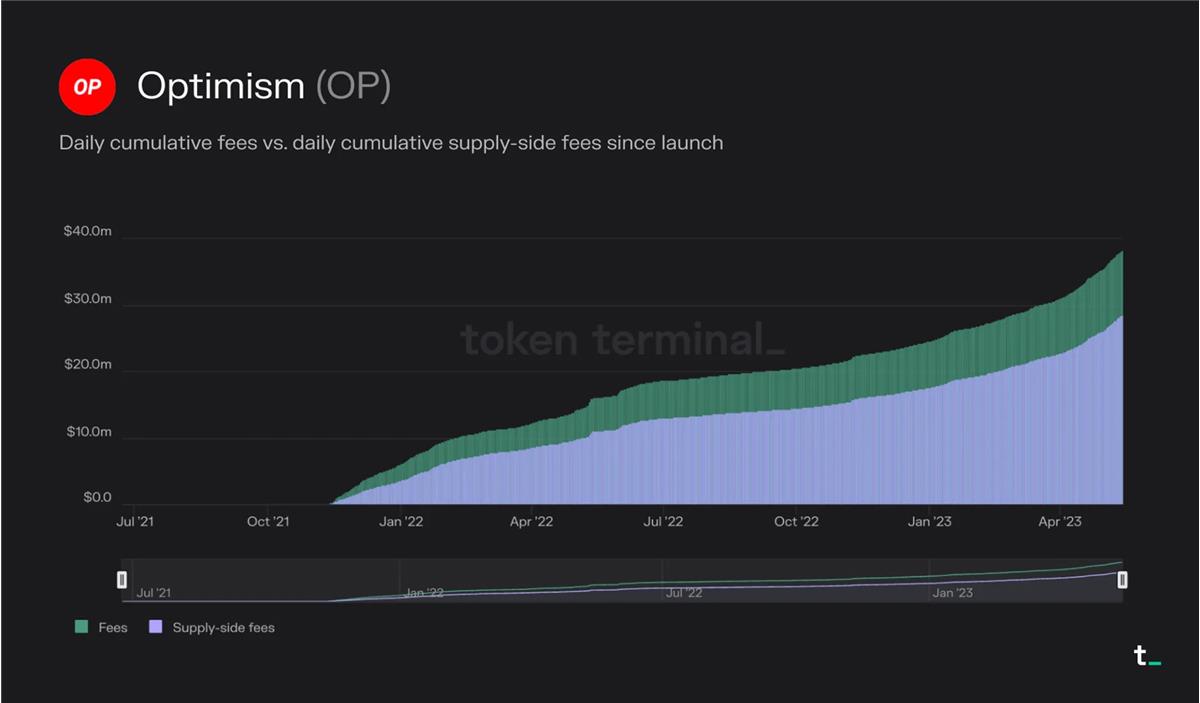
Since launch, users on Optimism have paid a total of $38.2 million in transaction fees. Of this, $28.5 million was spent on gas fees to submit transactions to Ethereum.
Conclusion
Blockchains are redefining the infrastructure of economic activity by offering decentralized, secure, and transparent transaction processing architectures. In a rapidly evolving industry like crypto, we are witnessing continuous innovation in the economic models of these computing platforms. Despite their differences, investors can use the framework outlined above to evaluate and compare their economic performance, potential, and sustainability.
Join TechFlow official community to stay tuned
Telegram:https://t.me/TechFlowDaily
X (Twitter):https://x.com/TechFlowPost
X (Twitter) EN:https://x.com/BlockFlow_News


