

ETF fund inflows slow down, BTC at a crossroads
TechFlow Selected TechFlow Selected
ETF fund inflows slow down, BTC at a crossroads
Reclaiming $114,000 is key for the uptrend, while falling below $108,000 could face deeper pressure.
Written by: Chris Beamish, CryptoVizArt, Glassnode
Translated by: AididiaoJP, Foresight News
Bitcoin price is oscillating between $110,000 and $116,000, with profit-taking and weakening ETF inflows dampening upward momentum. Derivatives are playing an oversized role, while futures and options are helping balance the market. Reclaiming $114,000 is key for a sustained rally, while a break below $108,000 could lead to deeper selling pressure.
Summary
After retreating from its all-time high in August, Bitcoin remains within a "gap" range of $110,000 to $116,000. The rebound from $107,000 was supported by dip buyers, but short-term holder sell-offs have so far limited upside momentum.
Profit-taking by 3- to 6-month holders and loss realization by recent high-cost buyers have created resistance. To sustain the rebound, price must stabilize above $114,000 to restore confidence and attract fresh capital inflows.
On-chain liquidity remains constructive but is trending downward. Meanwhile, ETF inflows have slowed to around ±500 BTC per day, weakening the traditional finance demand that previously fueled rallies in March and December 2024.
With spot demand softening, derivatives have become the primary driver. Futures basis and volume remain balanced, while options open interest is rising, indicating a market structure with greater risk awareness.
The market stands at a crossroads—reclaiming $114,000 could spark renewed bullish momentum, while falling below $108,000 may expose the next major supply cluster’s lower bound near $93,000.
Range-Bound Action
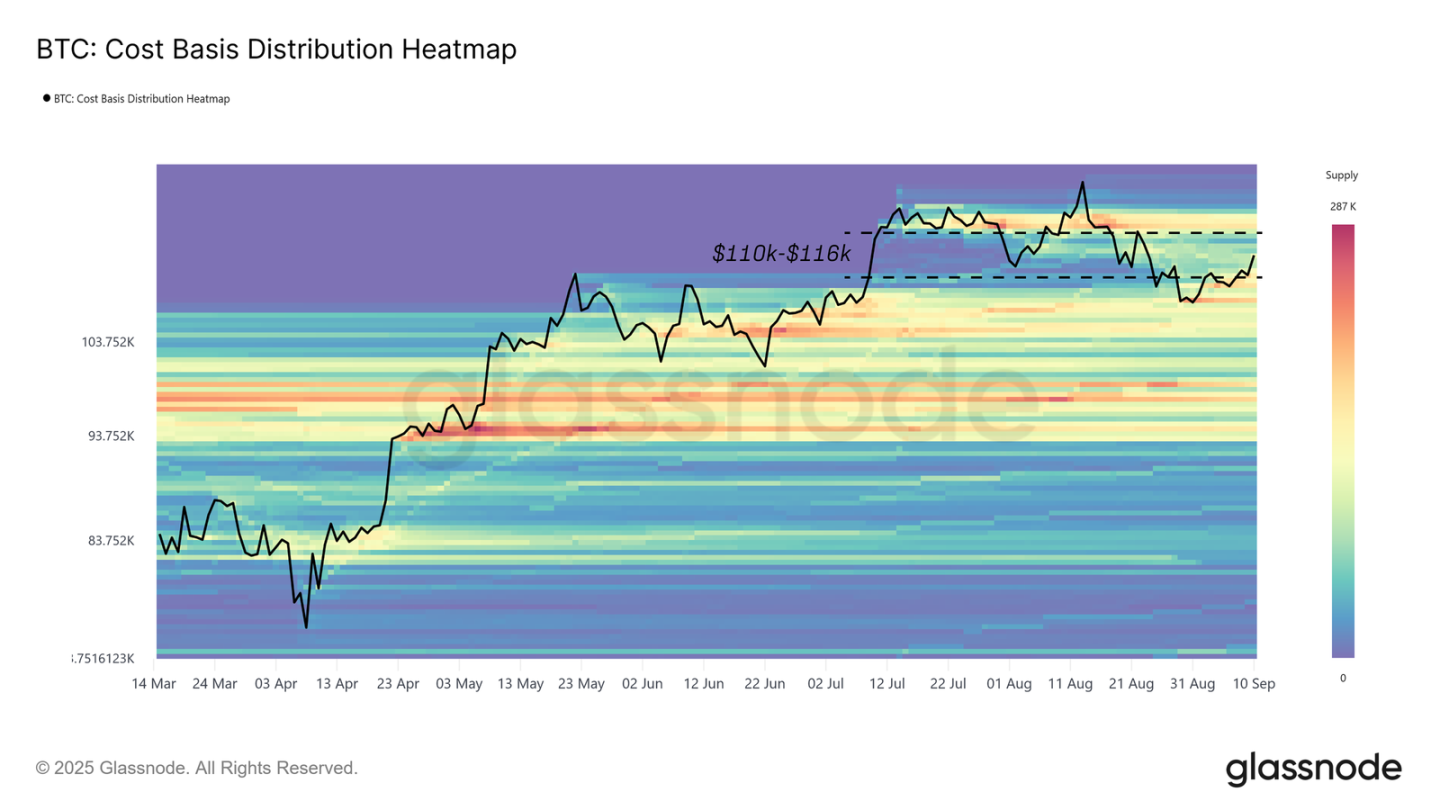
Following its peak in mid-August, market momentum has steadily weakened, pulling Bitcoin below the cost basis of recent high-cost buyers and back into the $110,000–$116,000 "gap" range. Since then, price has fluctuated within this range as supply is gradually redistributed, filling the gap. The key question now is whether this represents healthy consolidation or the first phase of a deeper correction.
As shown by cost basis distribution, the rebound from $108,000 was supported by clear on-chain buying pressure—a "buy-the-dip" structure that helps stabilize the market.
This report examines seller dynamics and momentum using both on-chain and off-chain indicators, focusing on the forces most likely to drive Bitcoin’s next decisive breakout from this range.
Mapping Supply Clusters
First, we map out cost basis clusters near current price levels, as these often anchor short-term price action.
The heatmap reveals three distinct investor groups currently influencing price movement:
-
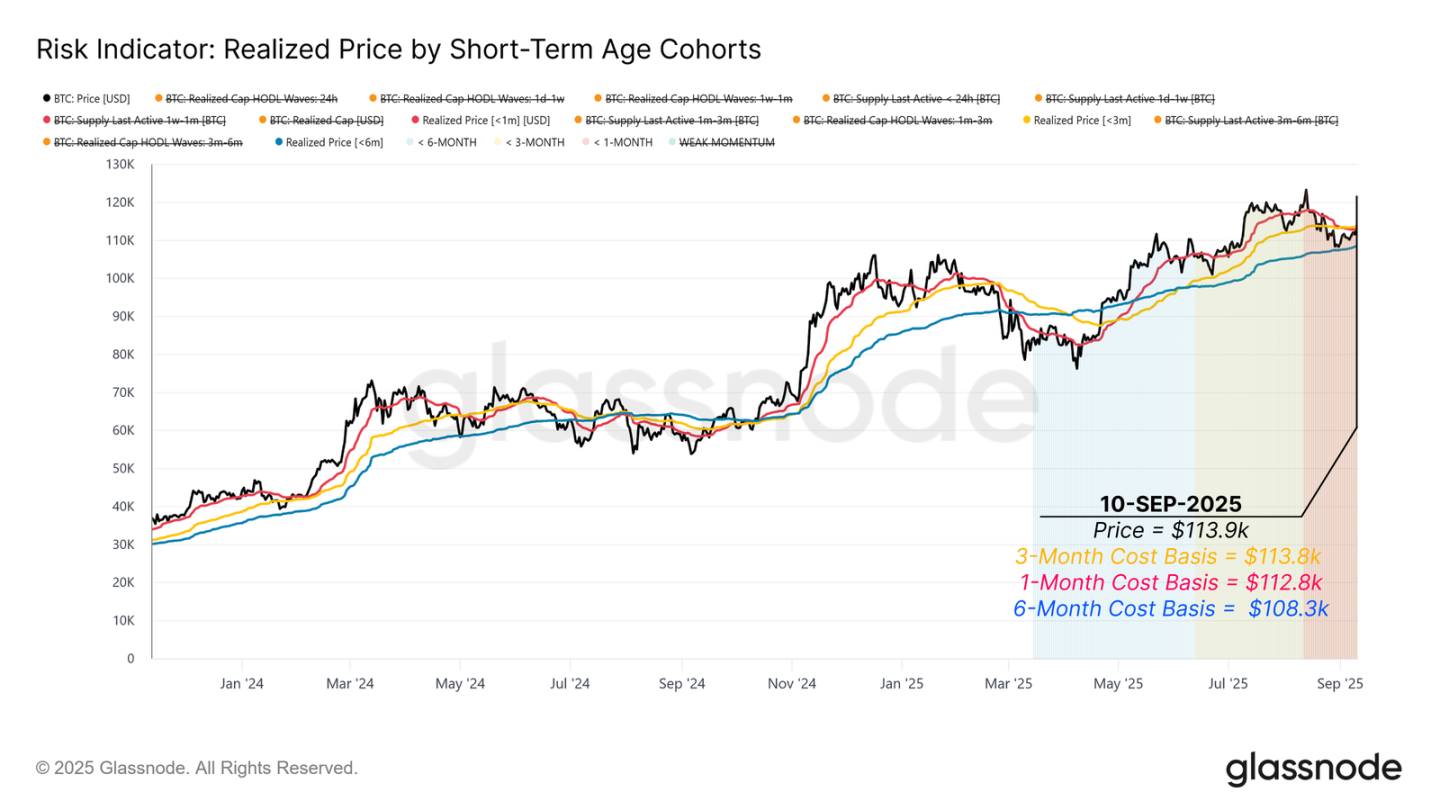
High-cost buyers from the past three months, with a cost basis near $113,800.
-
Dip buyers from the past month, clustered around $112,800.
-
Short-term holders over the past six months, anchored near $108,300.
These price levels define the current trading range. Reclaiming $113,800 would return high-cost buyers to profitability and support further bullish momentum. However, breaking below $108,300 could push short-term holders back into loss territory, potentially triggering new selling pressure and opening the path toward the lower bound of the next major supply cluster at $93,000.
Experienced Short-Term Holders Taking Profits
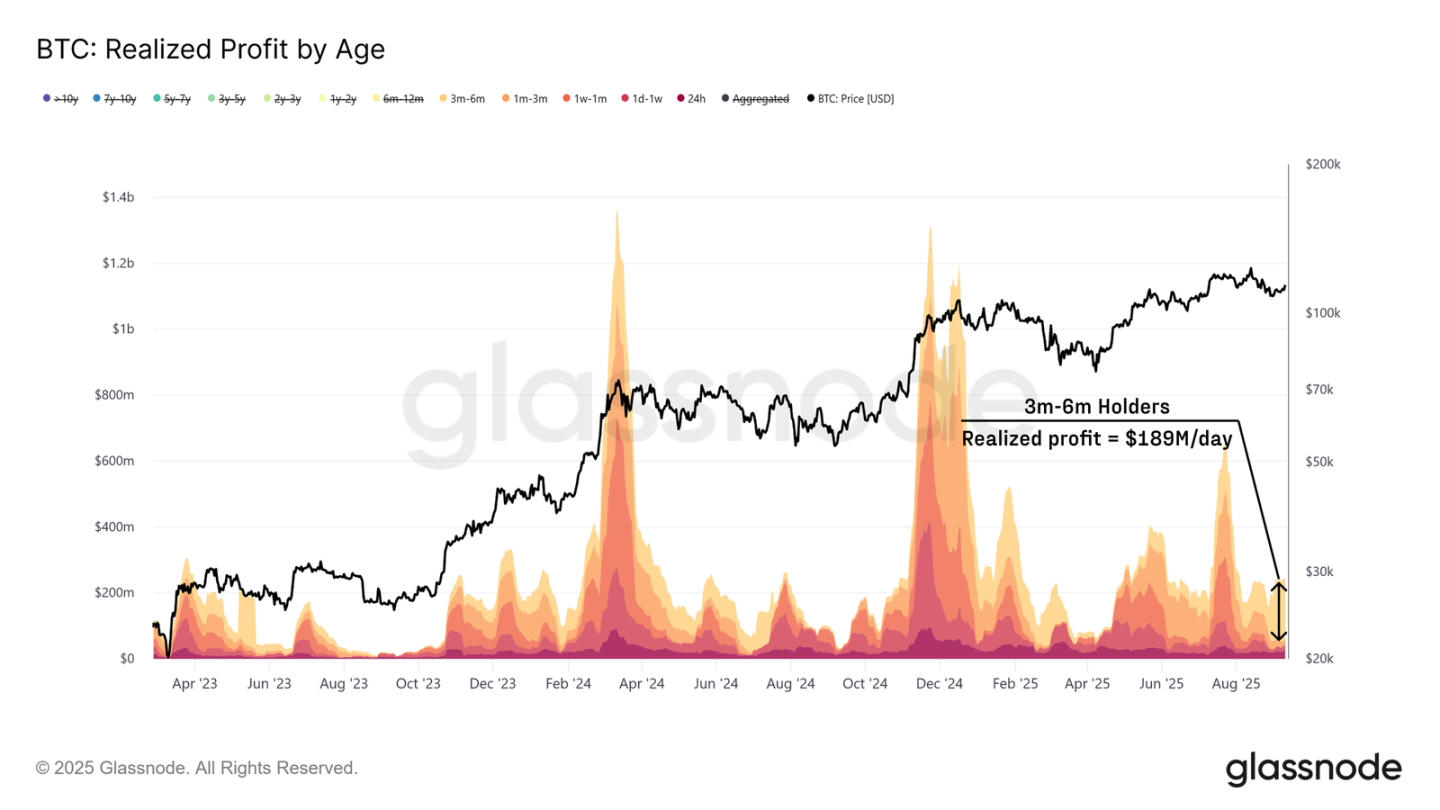
Having identified the immediate supply clusters shaping the current range, we now examine the behavior of different holder cohorts during the rebound from $108,000 to $114,000.
While dip buyers provided support, selling pressure has primarily come from experienced short-term holders. The 3–6 month holder group realized approximately $189 million in profit daily, accounting for about 79% of all short-term holder profits. This indicates investors who bought earlier during the February–May downturn are taking profits on the recent rebound, creating visible resistance.
Recent High-Cost Buyers Realizing Losses
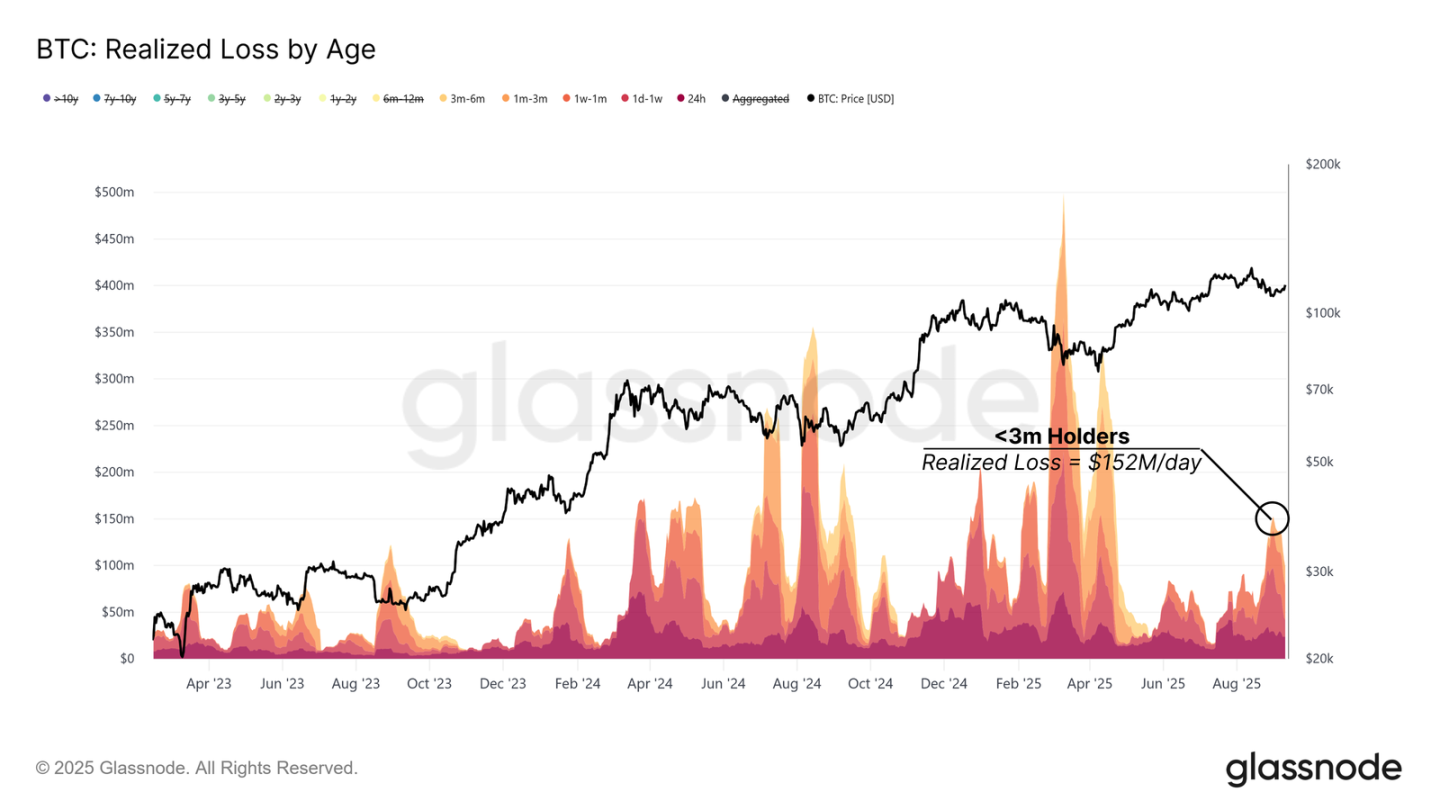
In addition to experienced short-term investors taking profits, recent high-cost buyers have also pressured the market by realizing losses during the same rebound period.
The cohort holding for up to 3 months realized up to $152 million in losses per day. This behavior mirrors stress periods seen in April 2024 and early January 2025, when high-cost buyers capitulated in a similar fashion.
For a sustainable medium-term rebound to resume, demand must be strong enough to absorb these sellers. Confirmation would come if price stabilizes above $114,000, restoring confidence and encouraging new capital inflows.
Liquidity Absorbing Seller Pressure
With both profit-taking and loss-realization pressuring the market, the next step is assessing whether new liquidity is strong enough to absorb these sellers.
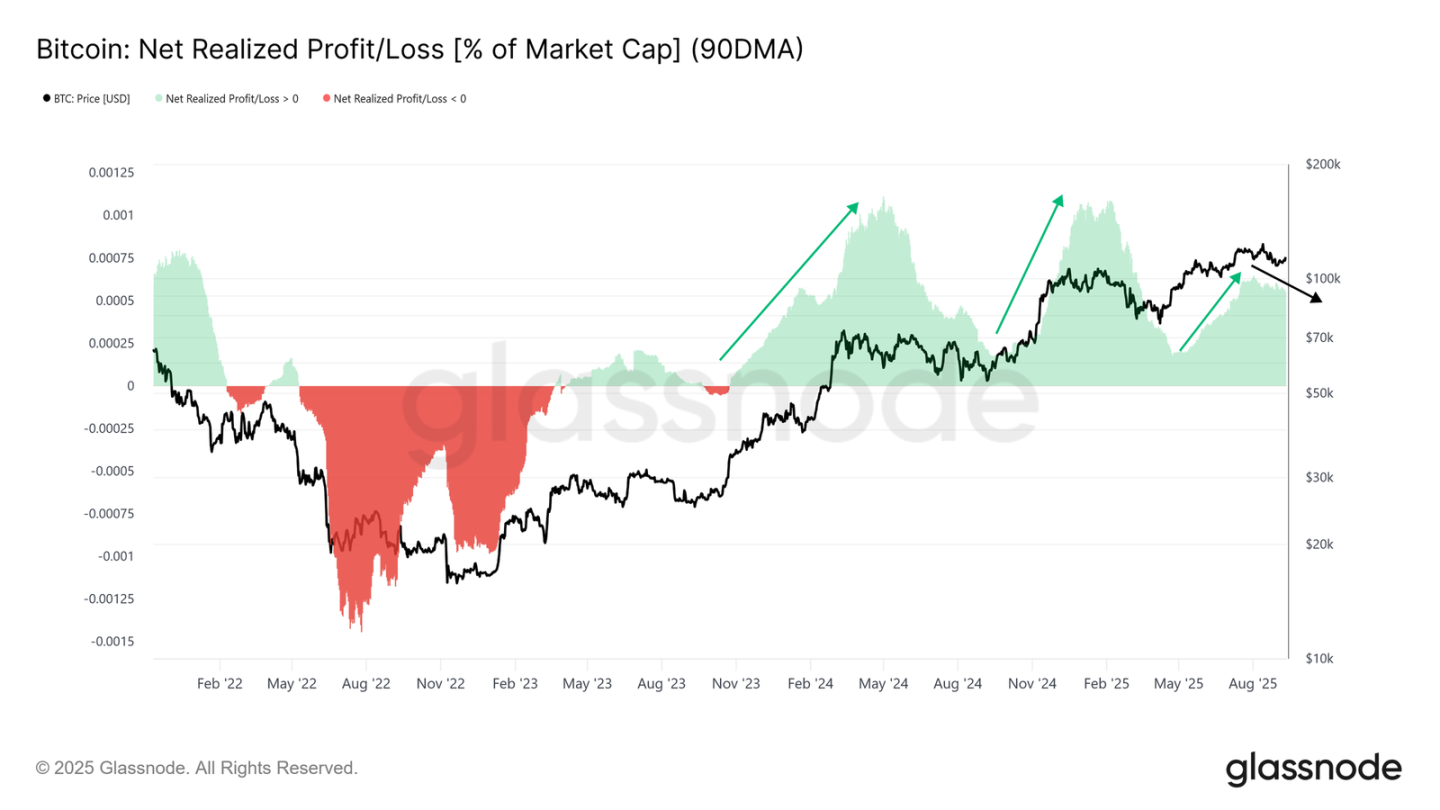
Net realized profit as a percentage of market cap provides this measure. The 90-day simple moving average peaked at 0.065% during August's rebound and has since trended downward. While weaker than the peak, current levels remain elevated, suggesting inflows continue to provide support.
As long as price holds above $108,000, the liquidity backdrop remains constructive. However, a deeper decline could exhaust these inflows and hinder further recovery.
Traditional Finance Flows Losing Momentum
In addition to on-chain flows, evaluating external demand via ETFs is critical, as they have been a primary driver in this cycle.
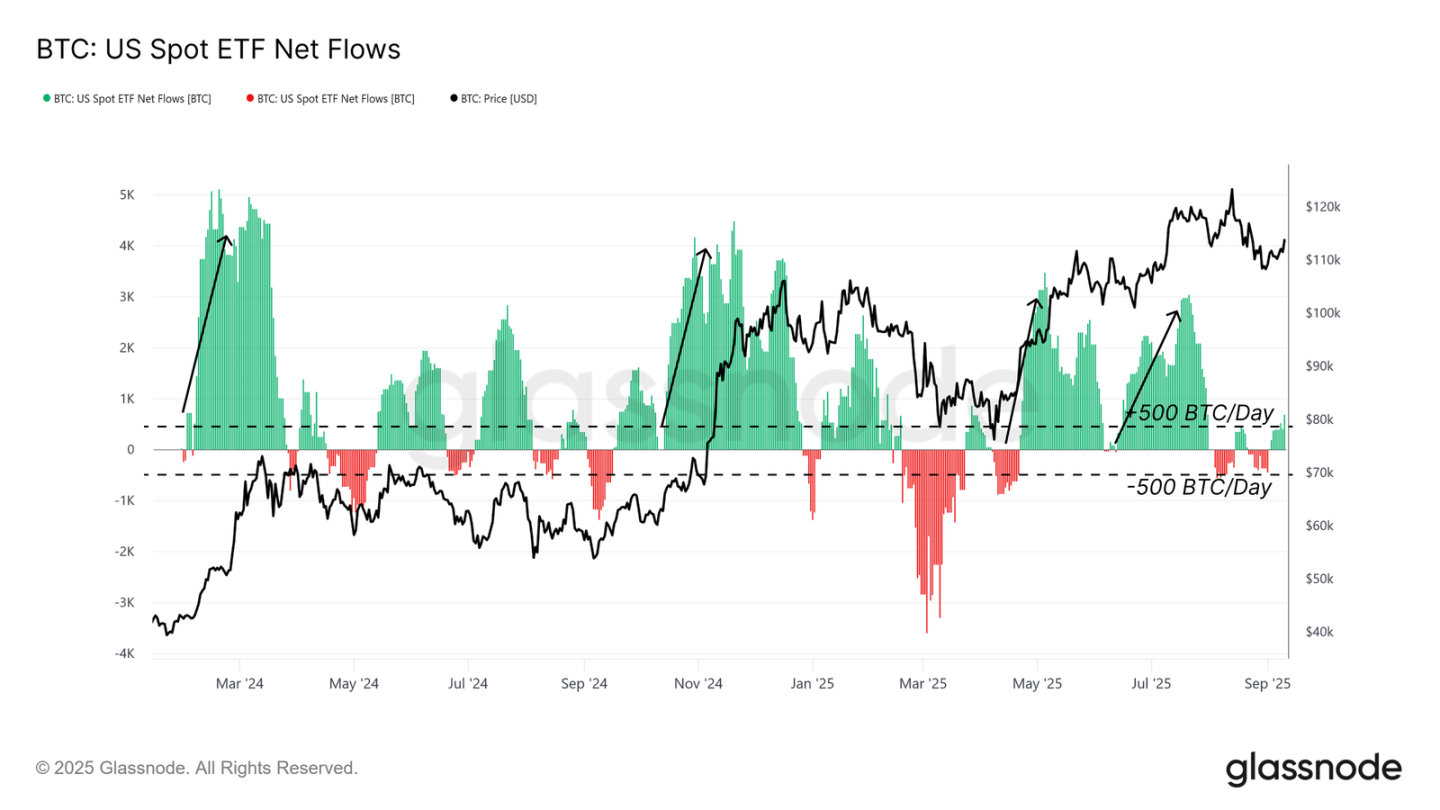
Since early August, net inflows into U.S. spot ETFs have sharply declined, now hovering around ±500 BTC per day. This is far below the inflow intensity that supported earlier rallies in the cycle, highlighting a loss of momentum among traditional finance investors. Given the key role ETFs played in driving prior gains, their slowdown increases the fragility of the current structure.
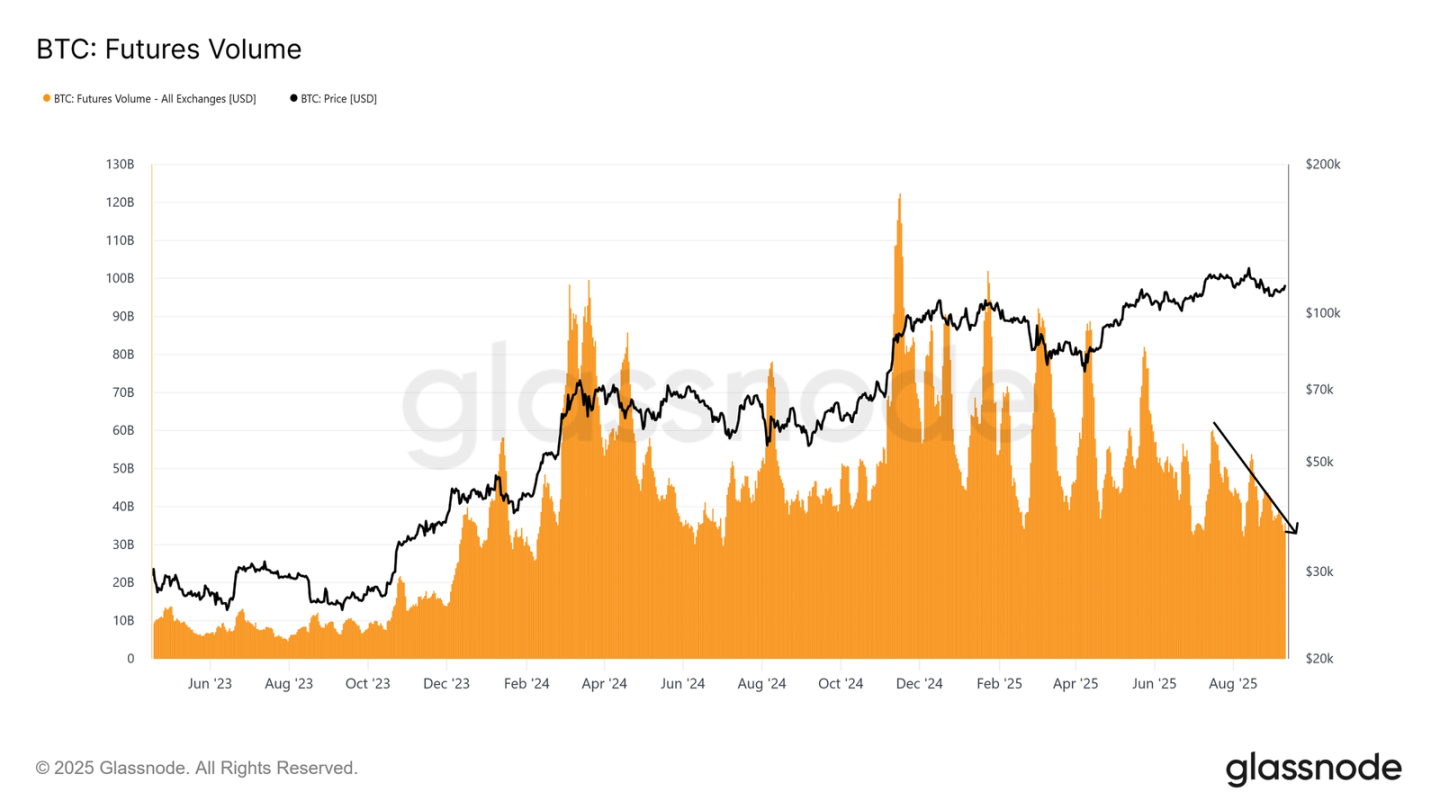
Derivatives Take Center Stage
With on-chain liquidity weakening and ETF demand fading, attention now shifts to derivatives markets, which often set the tone when spot flows diminish.
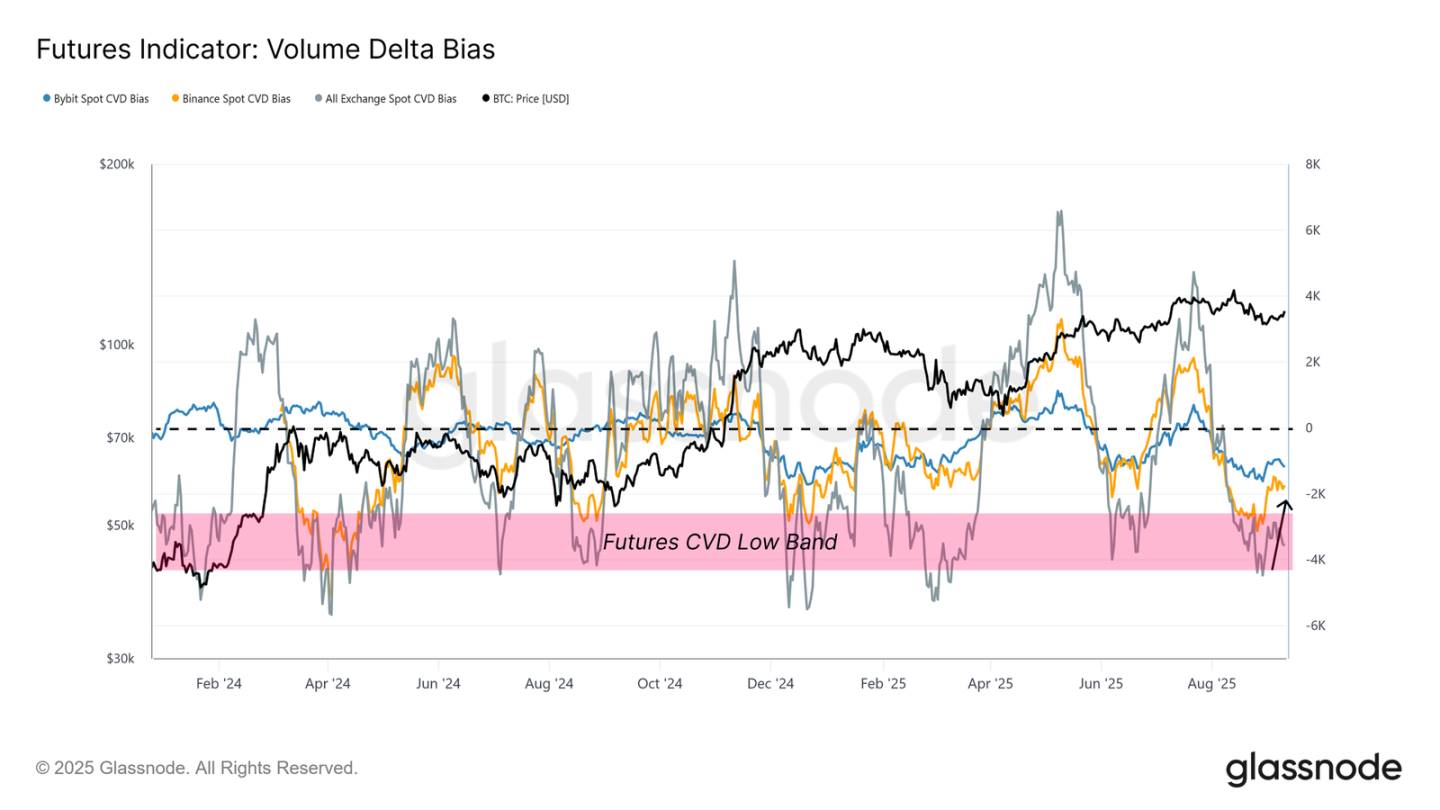
Volume Delta skew—a measure of cumulative volume relative to its 90-day median deviation—recovered during the rebound from $108,000, indicating waning seller strength on exchanges like Binance and Bybit. This suggests futures traders helped absorb recent selling pressure.
Going forward, the evolution of derivative positions will be crucial for navigating the market in this low spot-flow environment.
A Balanced Futures Market
Digging deeper into the futures market, we find it appears balanced rather than overheated.
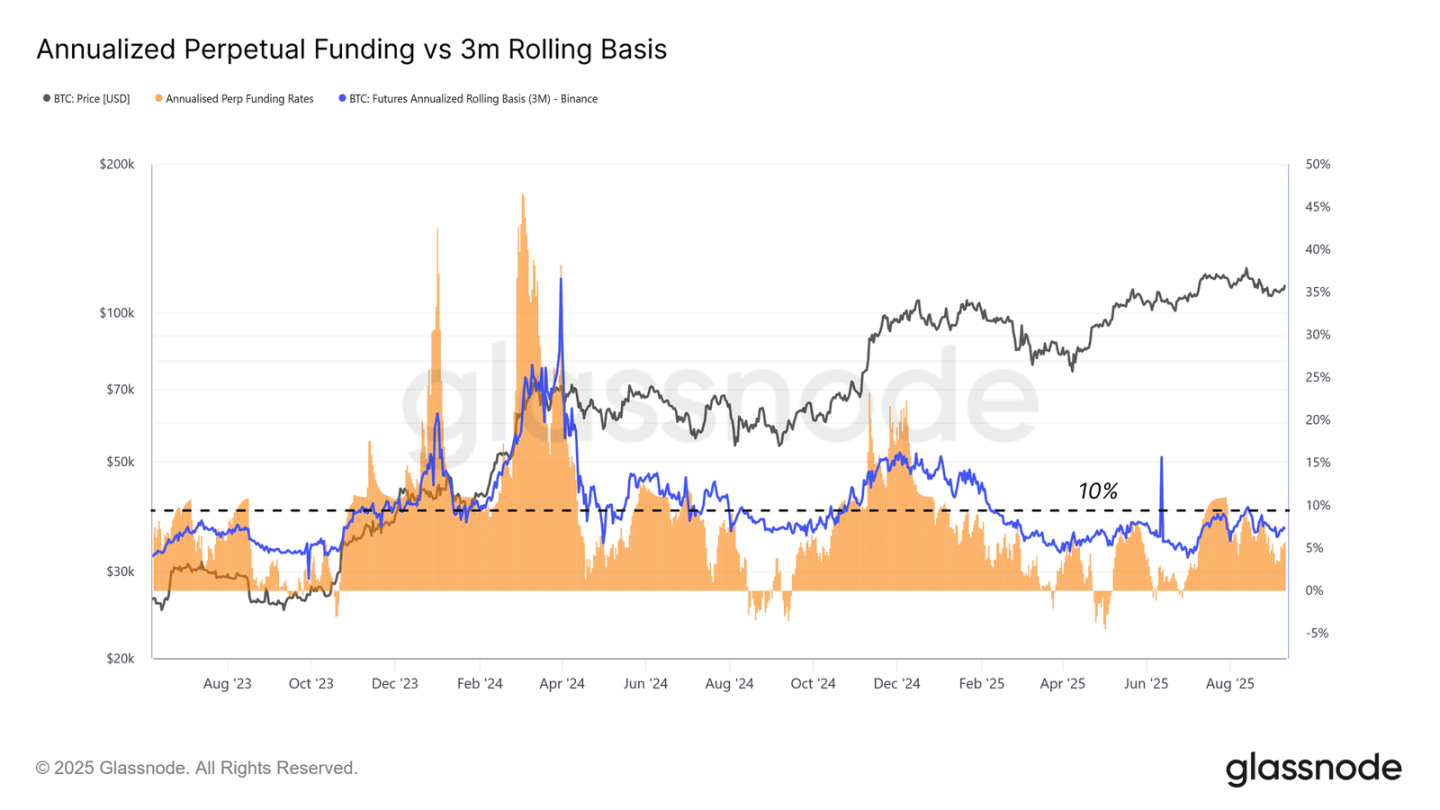
Despite higher prices, the 3-month annualized futures basis remains below 10%, reflecting stable leverage demand without the extreme conditions typically seen before liquidations. This indicates a healthier market structure more aligned with accumulation than speculation.
Perpetual futures volume also remains subdued, consistent with the calm period following typical euphoria phases. The absence of aggressive leverage spikes suggests the rally is built on a more stable foundation rather than excessive speculation.
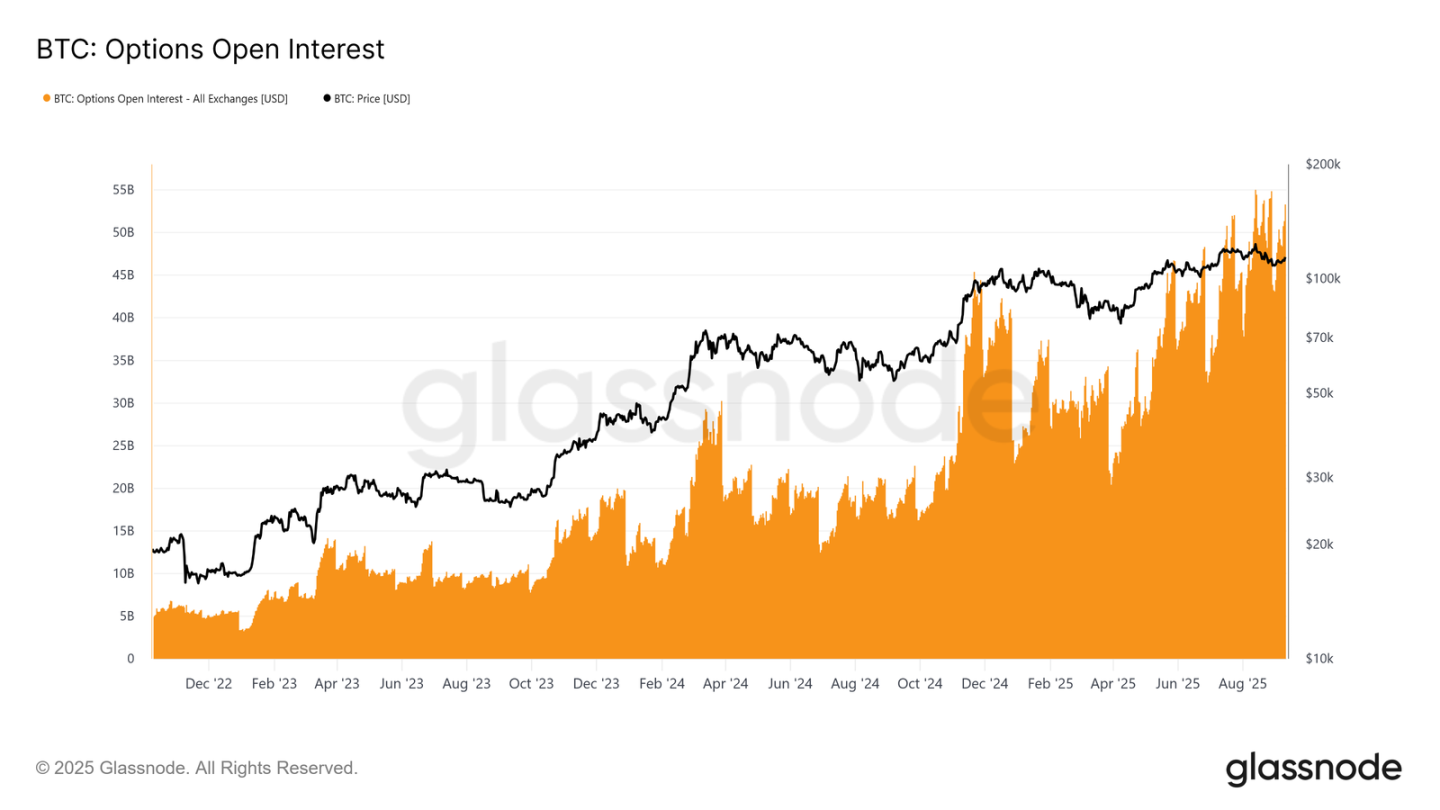
Growing Role of Options in Risk Management
Finally, the options market offers further insight into how participants are managing risk and structuring positions.
Bitcoin options open interest has reached an all-time high, reflecting growing importance. With ETFs providing spot access, many institutions prefer using options for risk management—via protective puts, covered calls, or defined-risk strategies.
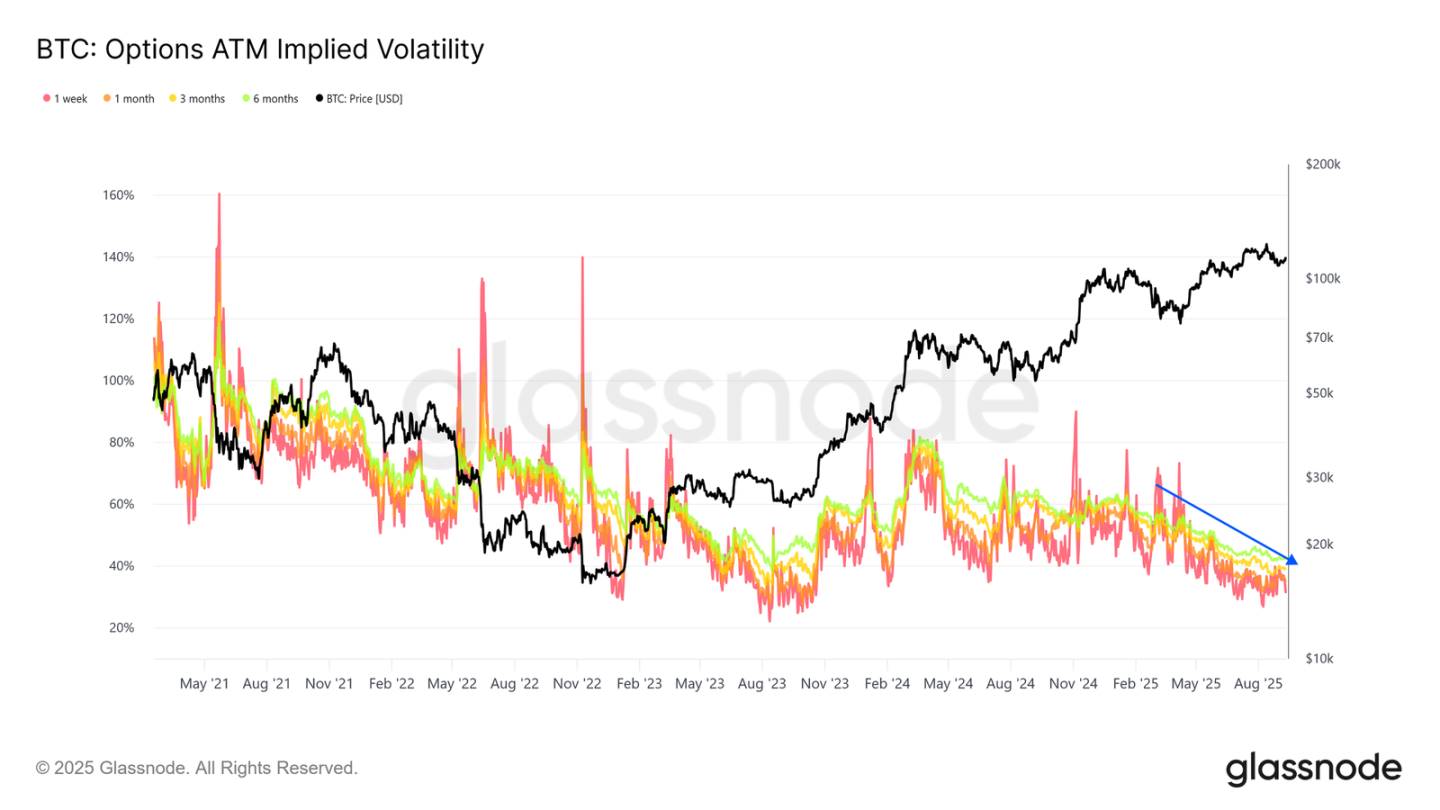
Implied volatility continues to decline, a sign of a more mature and liquid market. Volatility selling—a common traditional finance strategy—is exerting steady downward pressure on implied volatility levels, leading to more stable price action compared to past cycles.
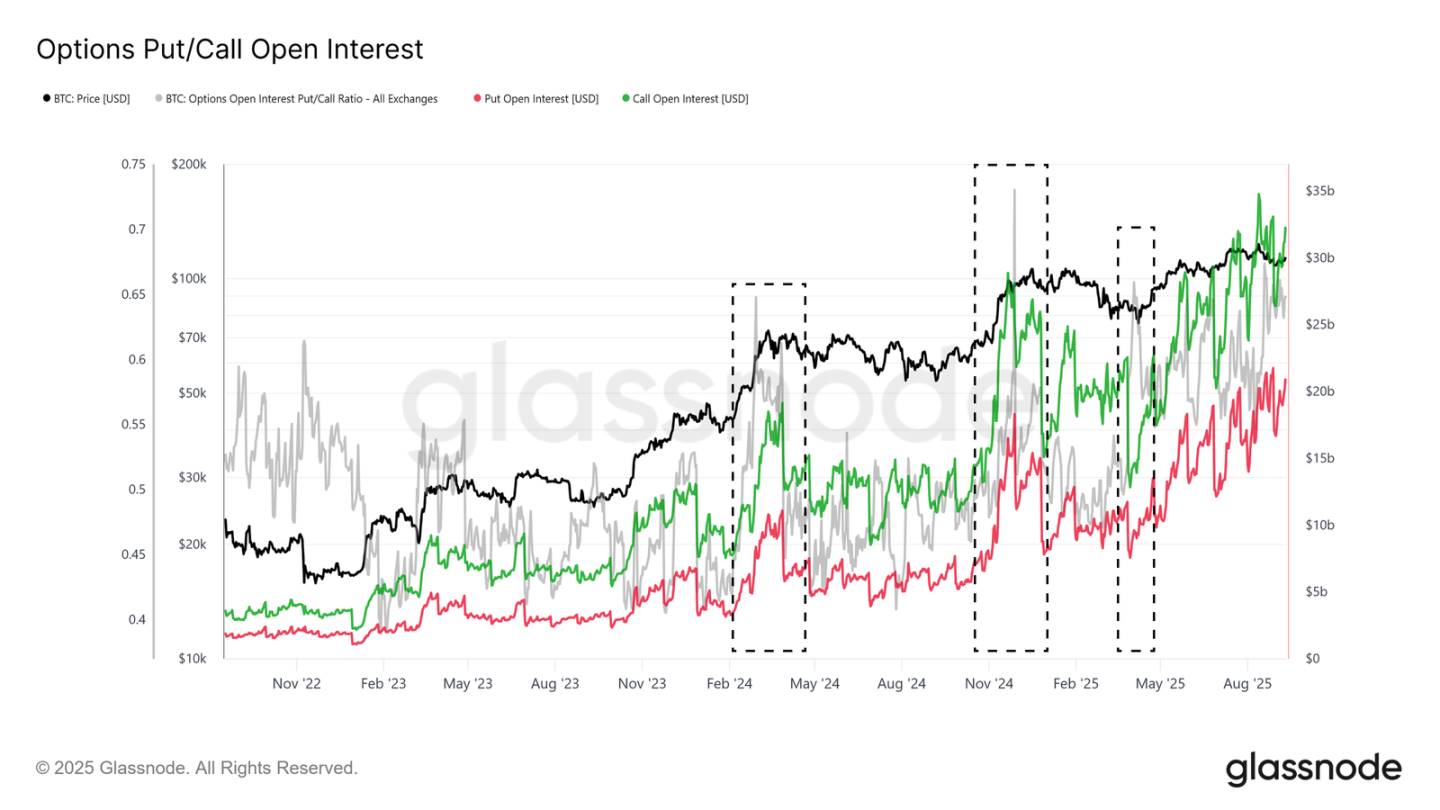
Open interest composition shows a clear dominance of call options over puts, especially during topping phases, highlighting a structurally bullish bias even as downside risks are managed. Overall, these dynamics suggest a healthier, more risk-aware market structure that could suppress both upcoming euphoric and bearish extremes.
Conclusion
The Bitcoin market is currently characterized by a delicate balance between seller pressure and weakening inflows. Profit-taking by experienced short-term holders, combined with loss realization by recent high-cost buyers, has capped upside momentum, making the $110,000–$116,000 range the primary battleground.
On-chain liquidity remains constructive but is trending lower, while ETF flows—once the cornerstone of this rally cycle—have lost strength. As a result, derivatives markets have grown more important, with futures and options activity helping absorb selling pressure and influence price direction. Both futures basis and options positioning reflect a more balanced structure than in past overheated phases, suggesting the market is advancing on firmer footing.
Looking ahead, reclaiming and holding above $114,000 is critical to restoring confidence and attracting fresh inflows. Failure to do so may place short-term holders under renewed pressure, with $108,000 and ultimately $93,000 serving as key downside levels. In short, Bitcoin stands at a crossroads—derivative support is maintaining market structure, but broader demand must strengthen to fuel the next sustained rally.
Join TechFlow official community to stay tuned
Telegram:https://t.me/TechFlowDaily
X (Twitter):https://x.com/TechFlowPost
X (Twitter) EN:https://x.com/BlockFlow_News


