A1 Research: With nearly 70% market share, what did Ethena get right?
TechFlow Selected TechFlow Selected
A1 Research: With nearly 70% market share, what did Ethena get right?
As DeFi matures and evolves into specialized infrastructure layers, Ethena's development trajectory may no longer be an anomaly, but rather a preview of how sustainable, institution-focused protocols could operate.
Author: A1 Research
Translation: TechFlow
This data-driven report provides an in-depth analysis of @ethena_labs' recent growth performance while successfully preserving over 70% of its capital.
Due to Ethena's rapid expansion over the past week, some of the data in this report is not up-to-date. Below are the changes since this article was written:
-
TVL: Increased from $5.88 billion to $7.55 billion (+28.4%)
-
Market Position: Rose from 17th to 15th among all DeFi protocols
-
Sector Dominance: Market share increased from 68.1% to 70.6%
The Paradox of DeFi Loyalty
In a domain known for fleeting hype, rapid turnover, and profit-driven capital, one protocol defies convention. While most DeFi platforms lose users at the first sign of volatility, Ethena has quietly built a fortress—retaining 76% of its total value locked (TVL), capturing 68.1% of the entire sector, and exhibiting the lowest volatility among all major DeFi protocols.
This article reveals the science of capital retention—exploring how Ethena evolved from an experimental stablecoin protocol into DeFi’s first true infrastructure-grade financial primitive, whose resilience, dominance, and sustainability resemble TradFi systems more than yield farming schemes.
Introducing Ethena: Infrastructure-Grade Digital Currency
Ethena is a synthetic dollar protocol built on Ethereum that uses an innovative “delta-neutral” basis trading strategy. By combining long positions in BTC/ETH spot with short positions in BTC/ETH perpetual futures, it creates a decentralized collateral-backed dollar-pegged solution, offering users “internet money” in the form of $USDe.
Revenue Mechanism:
-
Earning 15% annualized basis arbitrage by shorting perpetual futures (primary income source)
-
3% yield from long ETH staking collateral
-
4% fixed income from deploying stablecoins into liquidity pools
As of July 2025, Ethena allocates assets across derivative base trades, staked ETH, and liquid stable assets, with specific allocations varying based on market conditions and governance decisions.
Key Takeaways
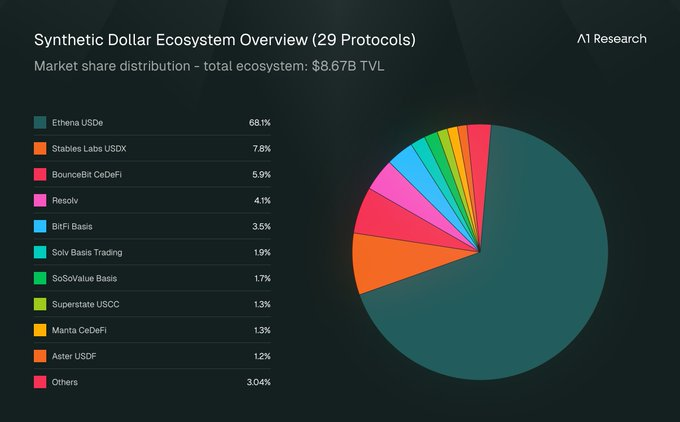
As the foundational infrastructure layer supporting yield-bearing synthetic dollars, Ethena holds 68.1% market share across an ecosystem spanning 12 chains and 29 protocols. With a TVL of $8.71 billion, strong capital stickiness, and high trust, it has become a core pillar in this space.
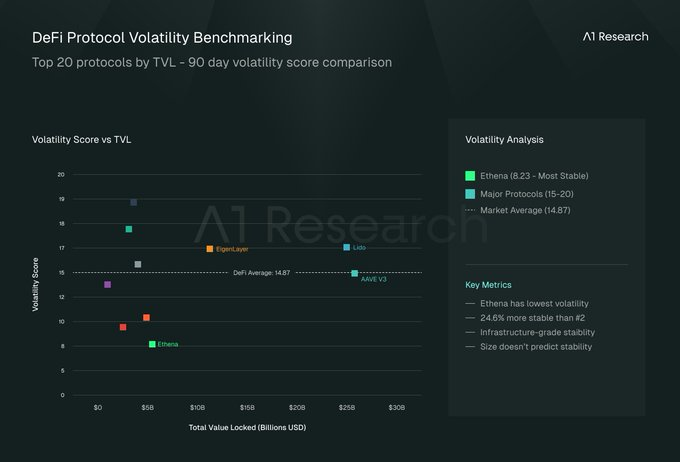
Ethena demonstrates exceptional operational maturity, with a volatility score (based on 90-day daily TVL percentage changes) of just 8.23—far below the typical 15–25 range for DeFi protocols. Meanwhile, the protocol maintains consistent growth, significantly outperforming peer benchmarks and serving as a model of stable growth within the industry.
A1’s core argument: Ethena exemplifies successful category creation, demonstrating stress-tested resilience and outstanding operational maturity. Through focused financial innovation and superior risk management, it proves how infrastructure protocols can achieve sustainable market leadership.
Pioneering a New Category: Ethena and the Architecture of Synthetic Digital Dollars
Ethena did not merely enter a market—it defined one. Most DeFi sectors mature slowly, with market share divided among 3–5 established players.
Ethena’s dominance indicates it set the trend rather than followed it, becoming the standard others now reference.
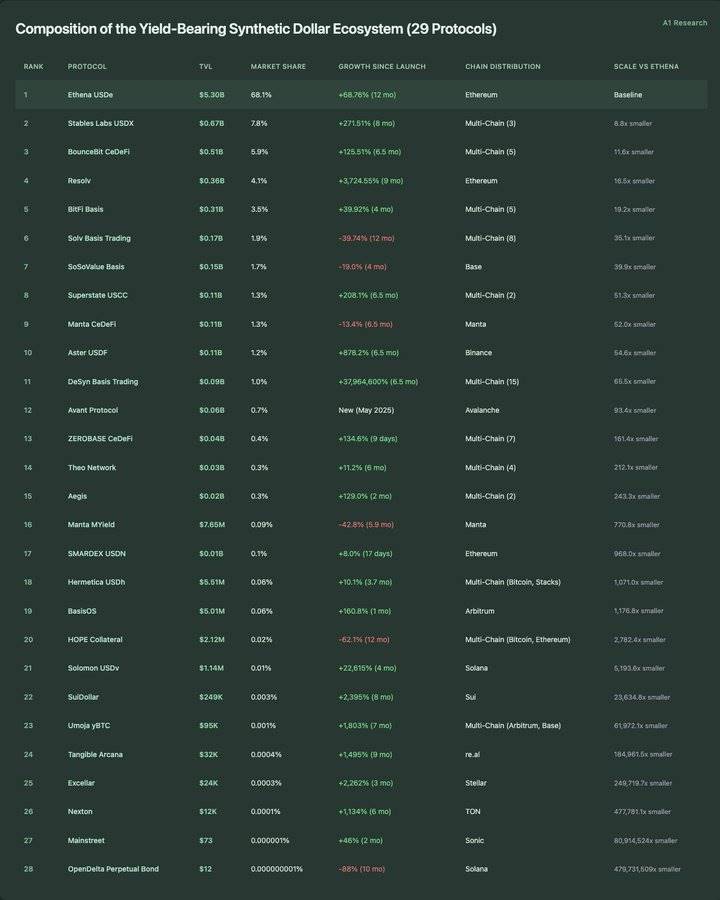
Composition of the Yield-Bearing Synthetic Dollar Ecosystem (29 protocols):
The Blueprint for DeFi Category Innovation
Ethena Catalyzes a New Ecosystem
Ethena’s launch triggered a wave of protocol innovation around synthetic, yield-generating dollars, spawning a $8.67 billion stable-value ecosystem comprising 29 protocols across 12 blockchains. Data from the past 12 months show this wasn’t gradual market evolution, but a leap enabled by infrastructure-grade performance.
Maintaining Infrastructure-Grade Performance Across Market Cycles
Ethena achieves a remarkable 68.85% year-on-year growth rate while maintaining 68.1% market dominance—an infrastructure-grade feat rare in DeFi. The protocol has passed through five distinct phases, confirming its status as a defining infrastructure player in the DeFi landscape.
Exceptional Recovery: From its October 2024 low, Ethena rebounded +132.7%, reflecting the institutional confidence pattern typical of infrastructure assets. While most DeFi protocols struggle to maintain momentum during bear markets, Ethena’s V-shaped recovery mirrors traditional infrastructure assets.
Volatility Management: A volatility score of 8.23 places Ethena firmly within infrastructure-grade stability, far below typical DeFi protocols. Maintaining such high stability amid 68.85% annual growth indicates a perfect balance between growth and reliability—hallmarks of an infrastructure leader.
Practical Application of Power Law
The ecosystem distribution follows an extreme power law: 1 protocol valued above $5 billion (Ethena), 1 between $500 million and $1 billion, 3 between $300 million and $500 million, and 24 below $300 million. Even more striking is micro-concentration: 13 protocols have TVL below $10 million, and 6 remain below $1 million despite operating for months.
Scale Gap: The largest competitor (USDX, $670 million) is 8.8 times smaller than Ethena, while the smallest tracked protocol (OpenDelta, $12) is 479,731,509 times smaller. This unprecedented scale distribution suggests the sector has rapidly matured into an infrastructure-dominated architecture rather than fragmented competition.
Multi-Chain Paradox: Liquidity Depth > Chain Ecosystem Breadth
Of the 28 tracked synthetic dollar protocols, 15 operate cross-chain across 12 blockchain ecosystems, indicating strong demand for multi-network presence. Yet Ethena maintains a single-chain deployment on Ethereum and captures the majority of the sector’s TVL.
Multi-Chain Efficiency Paradox: @DesynLab’s Basis Trading operates on 15 blockchains but has only $89 million TVL (65.5x smaller than Ethena). USDX runs on 3 chains with $670 million TVL (8.8x smaller than Ethena). This challenges the common assumption that “multi-chain expansion drives scale.”
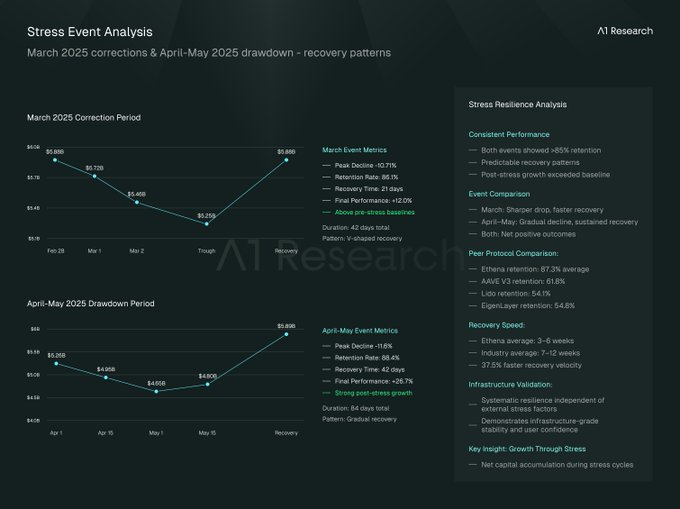
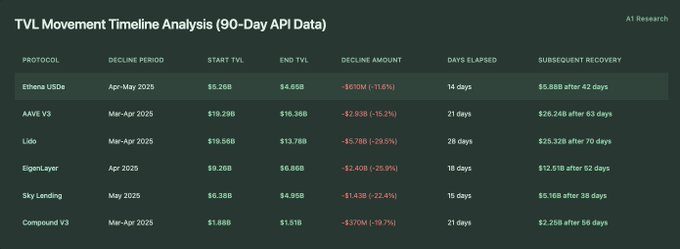
Protocol Resilience in Practice: Ethena Under Pressure
When the tide goes out, infrastructure strength becomes visible. During two major market corrections in 2025 (March, and April–May), most DeFi protocols suffered severe capital outflows. Yet Ethena demonstrated rare resilience—not only retaining capital but recovering and growing. In contrast, lending leaders (like @aave), staking giants (like @LidoFinance), and restaking pioneers (like @eigenlayer) saw significant TVL declines, making Ethena’s performance stand out.
-
Average Volatility Score (Top 20 Protocols): 14.87
-
Ethena’s Percentile Rank: 1st (Most Stable)
Detailed Stress Response Metrics
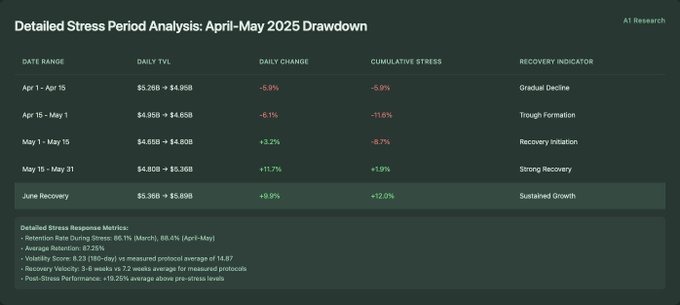
Retention Rate During Stress: 86.1% (March), 88.4% (April–May)
Average Retention Rate: 87.25%
Volatility Score: 8.23 (180-day), compared to average of 14.87 across measured protocols
Recovery Speed: 3–6 weeks, versus average of 7.2 weeks across other protocols
Post-Stress Performance: 19.25% higher than pre-stress levels on average
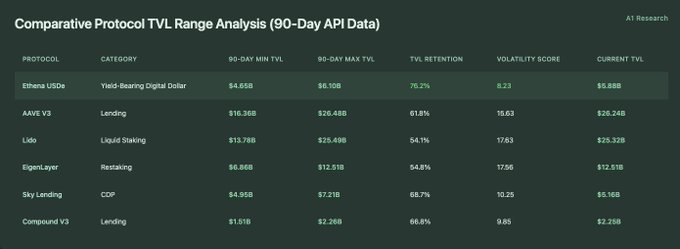
Comparison of Protocol TVL Range Analysis (90-day API Data):
TVL Change Timeline Analysis (90-day API Data):
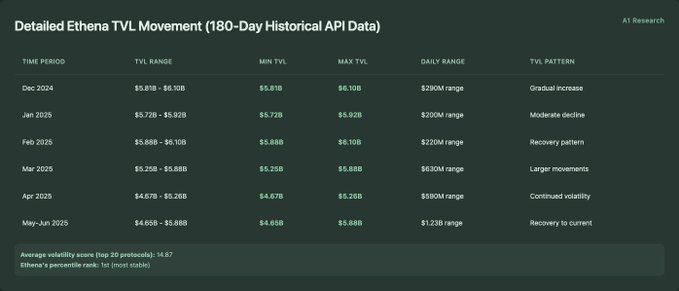
Detailed Ethena TVL Dynamics (180-day Historical API Data):
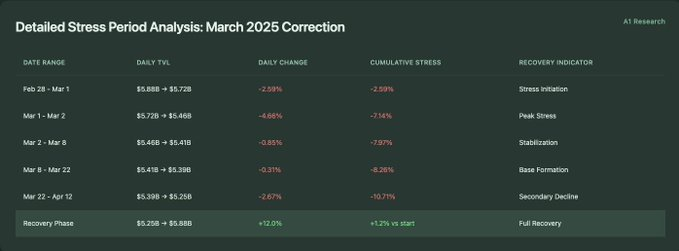
Detailed Stress Period Analysis (Daily TVL Changes):
March 2025 Market Correction:
April–May 2025 Market Pullback:
How Ethena Outperformed the Broader DeFi Sector During Crises
When markets turn turbulent, most protocols react. A few reveal their design. Ethena’s performance during recent market stress events was particularly strong, with data showing superior relative retention and recovery resilience.
Cross-Protocol Performance: Capital Stays Where Trust Is Highest
Ethena’s 76.2% TVL retention rate surpasses all measured mainstream DeFi protocols, including AAVE V3 (61.8%), Lido (54.1%), EigenLayer (54.8%), and Sky Lending (68.7%). This means Ethena’s retention during stress tests exceeds peer protocols by 14–22 percentage points.
Volatility: The Steadiest Hand in the Market
With a volatility score of 8.23, Ethena is the most stable among all 20 tested DeFi protocols. Ranging from 8.23 (Ethena) to 19.67 (SparkLend), Ethena is 24.6% more stable than the second-place Sky Lending (10.25).
Recovery Speed: Ethena Leads the Rebound
Comparative recovery timeline analysis shows Ethena averages 3–6 weeks to recover across measured events, while other protocols take 7–12 weeks (AAVE V3: 8–9 weeks, Lido: 10–12 weeks, EigenLayer: 7–8 weeks). This means Ethena recovers 37.5% faster on average within the test sample.
Interpreting Ethena’s Stress Response: Dual Performance of Stability and Growth
Beyond outperforming peers, Ethena demonstrated notable internal consistency across two major stress events:
Sustained Resilience: Despite differing stress characteristics, Ethena maintained over 85% retention in both periods (March: 86.1%, April–May: 88.4%), indicating systemic protocol resilience rather than event-specific market conditions.
Predictable Recovery: Regardless of initial drop severity, both recovery phases followed a similar 3–6 week schedule, suggesting predictable recovery mechanisms unaffected by external stress factors.
Growth Under Pressure: Both recovery phases resulted in TVL levels significantly exceeding pre-stress baselines (March event +12.0%, April–May event +26.7%), indicating net capital accumulation during stress cycles.
Derivatives Market Integration: Assessing Ethena’s Future Potential
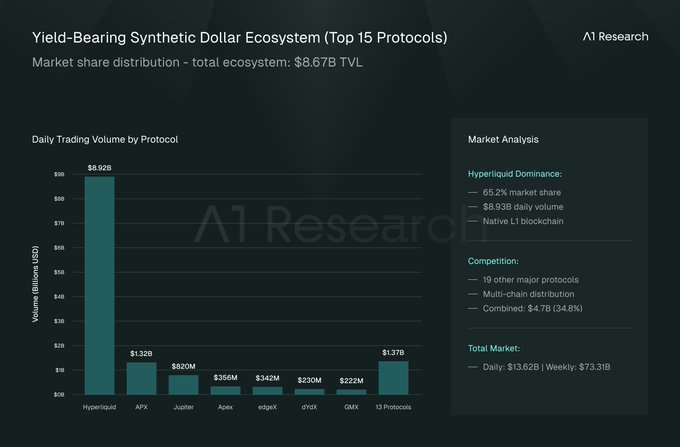
Ethena’s role has long transcended that of a mere stablecoin; its unique model makes it an ideal foundational collateral asset for decentralized derivatives platforms. The derivatives market already exceeds $13.6 billion in daily volume, and traders urgently need low-volatility, yield-generating collateral for margin and liquidity pool requirements—precisely the niche Ethena fills.
Derivatives Market Volume Analysis (Top 20 Protocols):
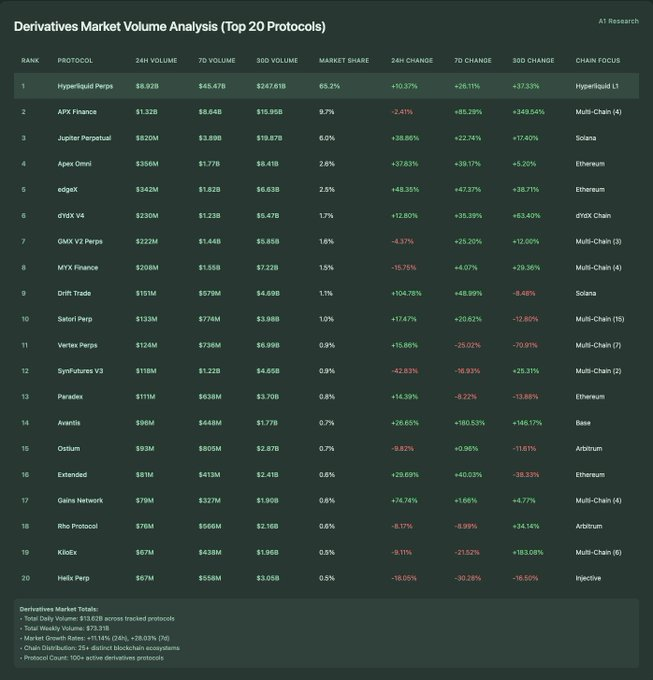
Total Derivatives Market:
-
Daily Total Volume: $13.62 billion across tracked protocols
-
Weekly Total Volume: $73.31 billion
-
Market Growth Rate: +11.14% (24h), +28.03% (7d)
-
Chain Ecosystem Distribution: 25+ different blockchain ecosystems
-
Number of Protocols: 100+ active derivative protocols
Analysis of Chain Ecosystem Distribution in Derivatives Markets

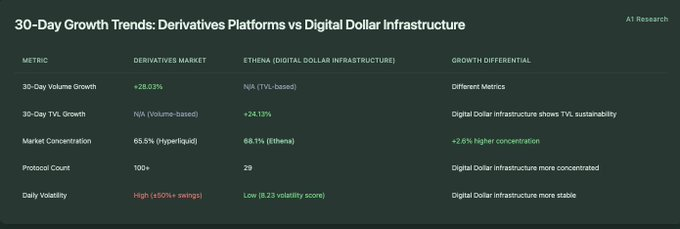
30-Day Growth Trends: Derivatives Platforms vs. Digital Dollar Infrastructure
The Quiet Fit Between Derivatives and DeFi Collateral Infrastructure
The crypto derivatives market is massive, fast-growing, and expanding rapidly. Beneath its volatility lies a quieter, more stable foundation—one increasingly defined by protocols like Ethena. These two layers—speed and stability—are beginning to show deep structural interdependence.
Scale Determines Success: High Growth Requires High-Quality Collateral
The decentralized derivatives market has a daily volume of $13.62 billion, while Ethena’s TVL stands at $5.88 billion—a ratio of 2.3x. Mathematically, even a 5% capture of derivatives volume ($681 million) would mean a 11.6% increase in Ethena’s current position. In short, small amounts of fast-moving money require large quantities of stable collateral.
Parallel Market Centralization Trend Analysis
Hyperliquid controls 65.5% of decentralized derivatives volume, while Ethena holds 68.1% of TVL in the yield-bearing digital dollar ecosystem. The concentration levels in both markets are similar (65–68%), suggesting parallel market structure patterns based on volume and TVL in DeFi sectors.
Different Speeds, Different Roles
The derivatives market grows at 28.03% weekly, while Ethena grows at 24.13% monthly. Normalized by frequency, the derivatives sector grows four times faster than Ethena, highlighting its faster market velocity, while synthetic dollar TVL growth follows a more stable trajectory.
Derivatives protocols exhibit high trading velocity and significant daily fluctuations (volatility commonly ±50% across protocols), whereas Ethena shows TVL stability (volatility score of 8.23). This 7x difference suggests complementary market functions—high-frequency trading and stable collateral supply.
Same Design, Different Outcome: Single-Chain Advantage
Hyperliquid focuses primarily on a single chain (65.5% of volume on Hyperliquid Layer1), yet other blockchains show distributed activity: Ethereum (5 protocols, $1.02 billion), Arbitrum (8 protocols, $2.26 billion). Multi-chain derivatives volume reaches $4.76 billion (34.8% market share) across 20+ protocols.
In both derivatives and synthetic dollar ecosystems, leading protocols’ single-chain dominance suggests that concentrating liquidity often outperforms multi-chain distribution when building foundational market infrastructure.
Competitive Positioning: Ethena vs. Infrastructure Giants
As DeFi expands, competition intensifies across most verticals. Notably, Ethena is the only synthetic dollar protocol ranked in DeFi’s top 50, reflecting not only its current market leadership but also its emerging structural defensibility.
DeFi Infrastructure Top 50 Competitive Analysis
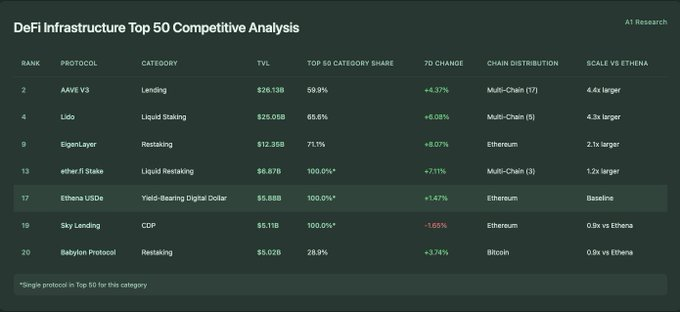
*Sole protocol in this category within the top 50
Lending Sector Competitive Analysis (Top 15)
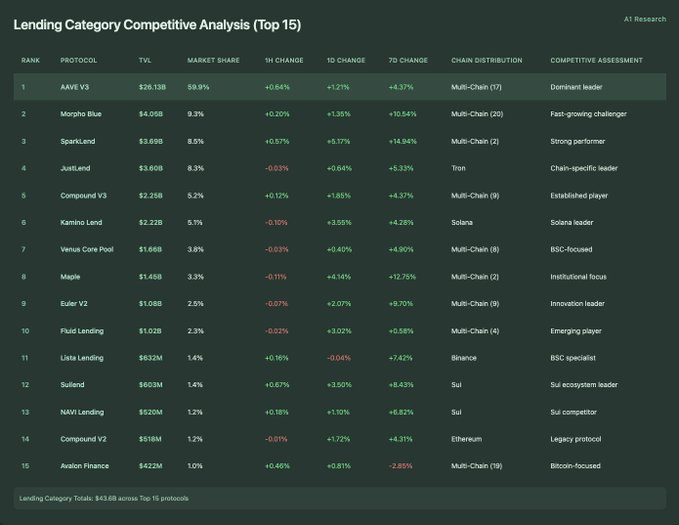
Total Lending Market: $43.6 billion across top 15 protocols
Complete Liquid Staking Sector Competitive Analysis (Top 10)
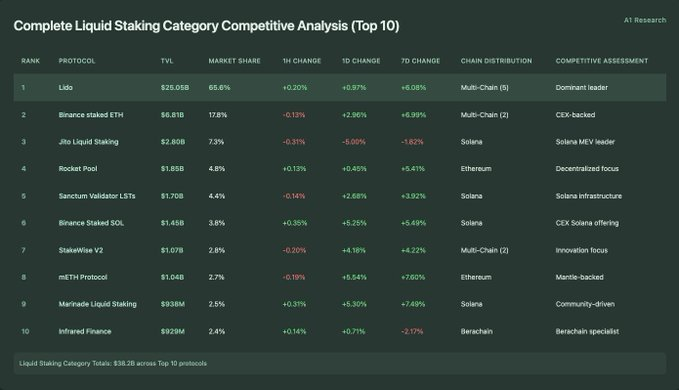
Liquid Staking Market Total: $38.2 billion across top 10 protocols
Competitive Scale Difference Analysis
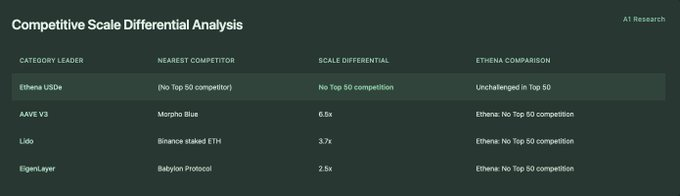
When One Protocol Dominates an Entire Sector: Ethena’s Structural Advantage
In most DeFi domains, protocols compete for incremental share within established categories. But in rare cases, one protocol emerges early, sets standards, and maintains dominance as the industry matures. Ethena is one such case.
Top-Tier Synthetic Dollars: A Unique Presence
Across top 50 DeFi categories, market concentration ranges from 58.0% (Uniswap V3 in DEX) to 100.0% for a single protocol representing the entire category. In synthetic dollars, Ethena accounts for 100% of the top 50, underscoring the lack of comparable competitors at this scale.
System-Level Ranking Context
Ethena ranks 17th overall among DeFi protocols (excluding centralized exchanges), placing it in the top 3% of all tracked protocols. Currently, it ranks 17th in total engaged value, between Bitget (16th, $6.02 billion) and BitMEX (18th, $5.54 billion).
Competitive Structure: Centralized vs. Decentralized
Ethena is the only synthetic dollar protocol in DeFi’s top 50, contrasting sharply with other sectors:
-
Lending: 7 protocols
-
Liquid Staking: 5 protocols
-
Restaking: 2 protocols
-
Decentralized Exchanges: 2 protocols
This asymmetry reflects deeper structural dynamics: synthetic dollar protocols tend to centralize around a single dominant infrastructure, while other verticals show greater fragmentation.
Growth Profile: Stability Over Acceleration
Recent weekly growth rates among top 50 category leaders:
-
EigenLayer: +8.07%
-
ether.fi: +7.11%
-
Lido: +6.08%
-
AAVE V3: +4.37%
-
Babylon: +3.74%
-
Ethena: +1.47%
Ethena’s lower short-term growth reflects a more mature and stable adoption curve, consistent with infrastructure behavior rather than early-stage protocol dynamics.
Utility Over Extraction: Ethena’s Infrastructure-First Economic Model
Since launch, Ethena has generated over $400 million in cumulative protocol revenue, ranking among the highest-earning protocols in DeFi. But unlike many protocols, Ethena does not retain these earnings to grow its treasury. Instead, nearly 100% of protocol revenue is distributed back to USDe holders as yield.
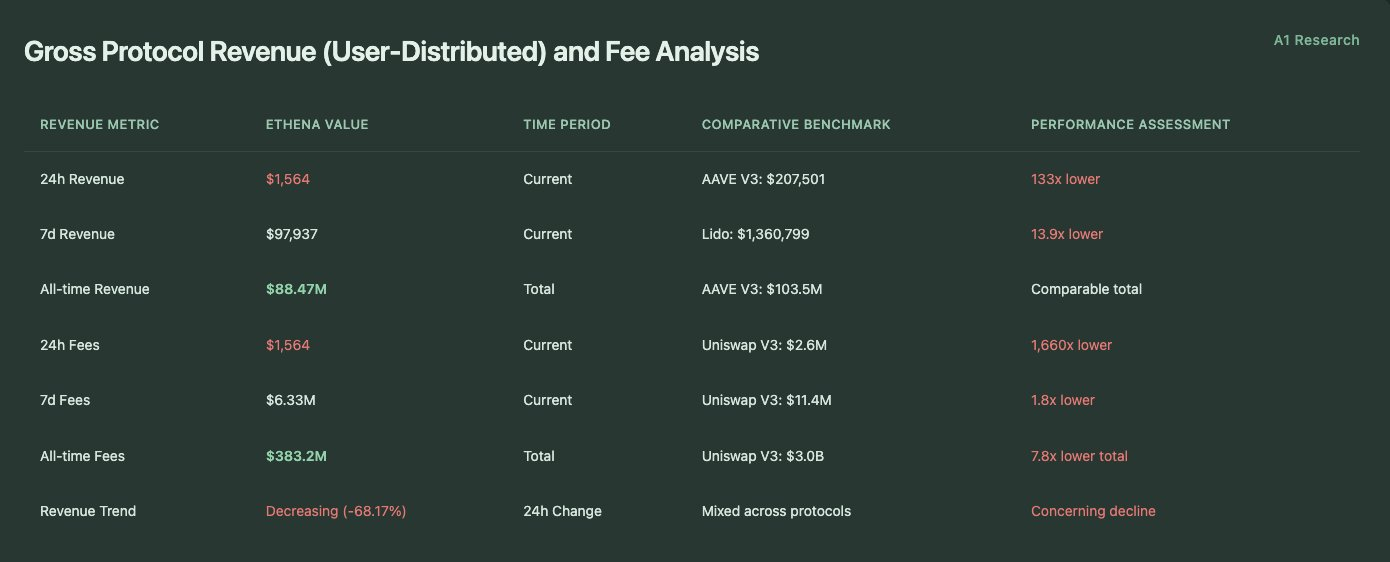
Total Protocol Revenue (User Distribution) and Fee Analysis
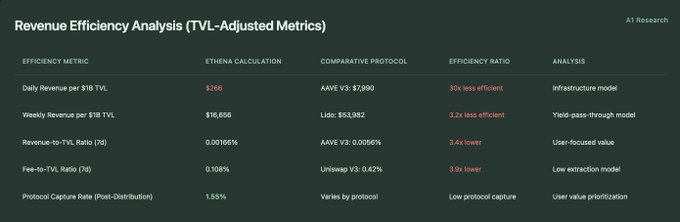
Revenue Efficiency Analysis (TVL-Adjusted Metrics)
Economic Model Classification Analysis
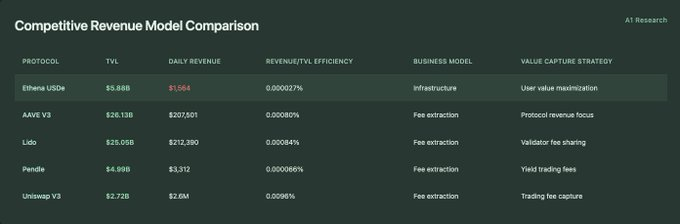
Competitive Revenue Model Comparison
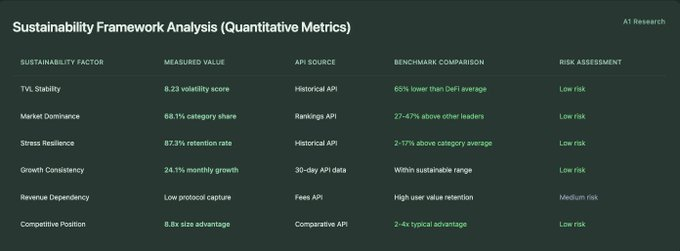
Sustainability Framework Analysis (Quantitative Metrics)
Rethinking Protocol Value: Ethena’s Infrastructure-Dominated Economic Model
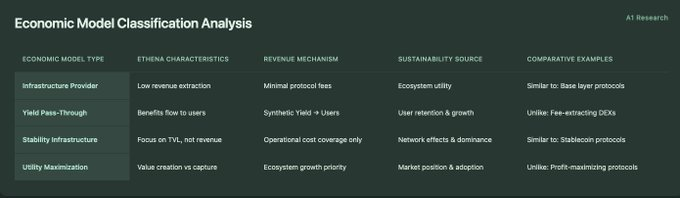
While many DeFi protocols revolve around transaction-based revenue extraction, Ethena operates on a fundamentally different premise: infrastructure utility over protocol profitability. Its economic model prioritizes user value creation and market functionality over short-term profits.
Infrastructure and Revenue: Deliberately Low Profitability
Ethena operates as infrastructure, not a profit-seeking protocol. With $5.88 billion TVL and $1,564 daily revenue, its revenue efficiency is just 0.000027%. This contrasts sharply with fee-centric protocols like Uniswap V3 (0.0096% efficiency) or AAVE V3 (0.00080% efficiency). This model signals clear priorities: maximizing user utility, not protocol revenue.
Yield Pass-Through: A Core Design Feature
Ethena’s low revenue retention rate (1.55%) indicates that system-generated yields flow primarily to USDe holders, not captured by the protocol treasury. This structure aligns closely with stablecoin infrastructure models, where economic value is passed to users rather than accumulated by the protocol.
Sustainability Rooted in Market Role
Unlike protocols relying on fee generation for sustainability, Ethena’s durability appears rooted in its ecosystem role and infrastructure value. Key performance indicators support this:
-
68.1% market share
-
8.23 volatility score
-
87.3% stress retention rate
These metrics suggest the protocol’s competitive advantage stems from market positioning, not fee flows.
The Illusion of Efficiency: How Yield Distribution Becomes a User Retention Engine
At first glance, measured by revenue per $1 billion TVL, Ethena’s “yield efficiency” appears 3–30 times lower than mainstream DeFi protocols. But this is a false signal of weakness. Ethena’s low protocol capture isn’t due to poor revenue generation—the protocol has cumulatively earned over $400 million. Instead, its yield-pass-through design channels almost all revenue directly to USDe holders.
This architecture prioritizes user alignment over protocol profit, sacrificing short-term gains for long-term capital stickiness and system integration. The result is strong defensibility: high user trust, low churn, and robust TVL resilience.
Revenue Headwinds and the Cost of Market Dominance
Despite its clear positioning, inherent risks remain. A -68.17% daily revenue fluctuation highlights income source volatility, which could challenge sustainability if operating costs begin to exceed revenue. Since income is primarily driven by perpetual contract funding rates, a shift to bearish mechanics could compress funding spreads and further reduce protocol-level yields.
However, Ethena’s role as an infrastructure layer carries deeply embedded utility, suggesting it may remain viable without heavy reliance on high income as long as ecosystem value continues to expand.
Conclusion: Infrastructure, Purpose, and Long-Term Vision
Ethena currently embodies a coherent and deliberate design philosophy across multiple metrics (category creation, stress resilience, ecosystem integration, structural positioning, and economic model)—not just as a product, but as DeFi infrastructure.
Rather than maximizing protocol-layer revenue, Ethena prioritizes capital stability, user value retention, and ecosystem coordination. This enables it to build trust and scale—not through aggressive mining or rapid multi-chain expansion, but by establishing itself as a core building block in its market niche.
Infrastructure Blueprint
Ethena successfully demonstrates the blueprint for DeFi category creation:
-
Early achievement of infrastructure-scale and reliability—68.1% market share, 8.23 volatility score
-
Maintaining dominance across full market cycles—76.2% TVL retention during major stress events
-
Becoming the defining operational standard for an entire subsector, rather than competing within it
Key Performance Validation
Category Creation Success: Ethena triggered the emergence of an ecosystem from 1 → 29 protocols, maintaining 68.1% dominance despite 28 new entrants achieving over 1,000% growth.
Institutional Pattern: V-shaped recovery (+132.7% from October lows), infrastructure-grade stability, and sustained market leadership mirror traditional infrastructure assets, not typical DeFi volatility patterns.
Network Effects: Single-chain Ethereum deployment outperforms multi-chain competitors, indicating liquidity concentration trumps geographical distribution for infrastructure protocols.
Broader Implications of the Model
Ethena’s trajectory offers a useful reference point for how infrastructure protocols in DeFi can succeed:
-
Not by dominating every metric, but by selecting key ones critical to its function
-
Not through broad competition, but by becoming indispensable in a narrow, strategically important vertical
-
Not through extraction, but through utility maximization and user value alignment
As DeFi matures and segments into specialized infrastructure layers, Ethena’s path may no longer be an anomaly, but a preview of how sustainable, institutionally-oriented protocols will operate.
The protocol’s success suggests certain verticals—especially those serving as financial infrastructure—may naturally trend toward winner-take-all outcomes, with lasting implications for the evolving market structure of DeFi.
This article is for informational purposes only and does not constitute financial, investment, legal, or tax advice. The views expressed are those of A1 Research at the time of publication and are subject to change without notice. Nothing in this article should be interpreted as a recommendation to buy, sell, or hold any asset. A1 Research does not guarantee the accuracy or completeness of the information contained herein. Please conduct your own due diligence and consult a licensed financial advisor before making any investment decisions. This article is not financial advice.
Join TechFlow official community to stay tuned
Telegram:https://t.me/TechFlowDaily
X (Twitter):https://x.com/TechFlowPost
X (Twitter) EN:https://x.com/BlockFlow_News