

Crypto Derivatives Market Report H1 2025: Opportunities and Challenges Amid BTC's New High and Market Divergence
TechFlow Selected TechFlow Selected
Crypto Derivatives Market Report H1 2025: Opportunities and Challenges Amid BTC's New High and Market Divergence
In the first half of 2025, amid turbulent global macroeconomic conditions and escalating geopolitical conflicts, the cryptocurrency derivatives market continued its strong momentum.
Author: CoinGlass
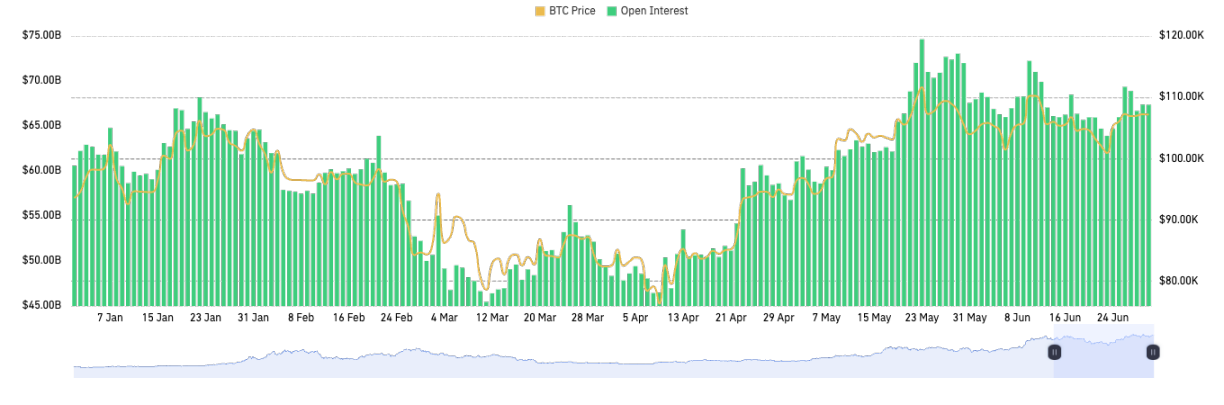
In the first half of 2025, the global macro environment remained turbulent. The Federal Reserve repeatedly paused rate cuts, reflecting a shift in its monetary policy toward a "wait-and-see tug-of-war" phase. Meanwhile, escalating tariff measures under the Trump administration and intensifying geopolitical conflicts further fractured global risk appetite structures. At the same time, the cryptocurrency derivatives market sustained the strong momentum seen at the end of 2024, reaching new all-time highs in overall scale. After BTC broke its historical high of $111K at the beginning of the year and entered a consolidation phase, global BTC derivatives open interest (OI) surged significantly, rising from approximately $60 billion in January to over $70 billion at its peak between January and June. As of June, although BTC prices stabilized around $100K, the derivatives market experienced multiple rounds of long and short liquidations, releasing leverage risks and maintaining a relatively healthy market structure.
This report projects that in Q3 and Q4, driven by macro factors (such as changes in U.S. interest rate policy) and institutional capital inflows, the derivatives market will continue expanding in size, with volatility likely remaining contained. Risk indicators must be continuously monitored, while maintaining cautiously optimistic expectations for further BTC price increases.
Market Overview
Market Summary
In the first two quarters of 2025, BTC prices underwent significant fluctuations. In January, BTC reached a high of $110K before falling to around $75K in April—a decline of about 30%. However, buoyed by improving market sentiment and sustained institutional investor interest, BTC climbed again in May, peaking at $112K. By June, prices stabilized around $107K. During this period, BTC's market dominance strengthened consistently throughout the first half of 2025. According to TradingView data, BTC’s market share reached 60% at the end of Q1—the highest level since 2021—and continued into Q2, surpassing 65%, indicating growing investor preference for BTC.
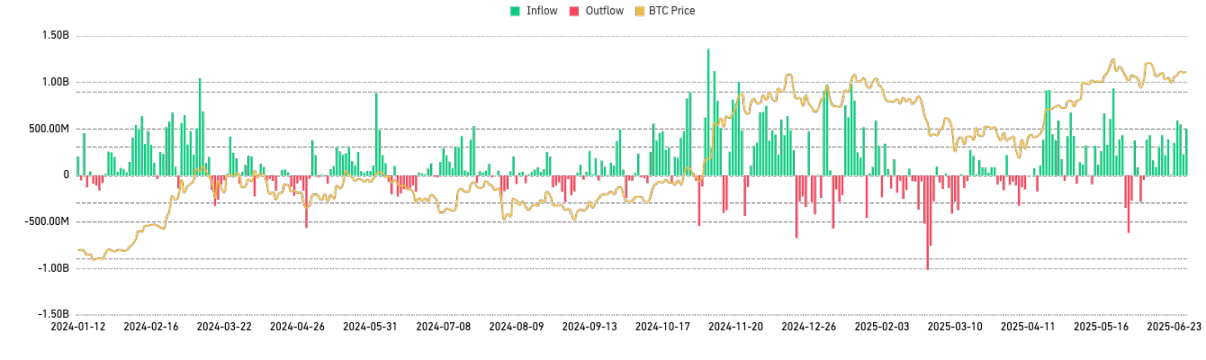
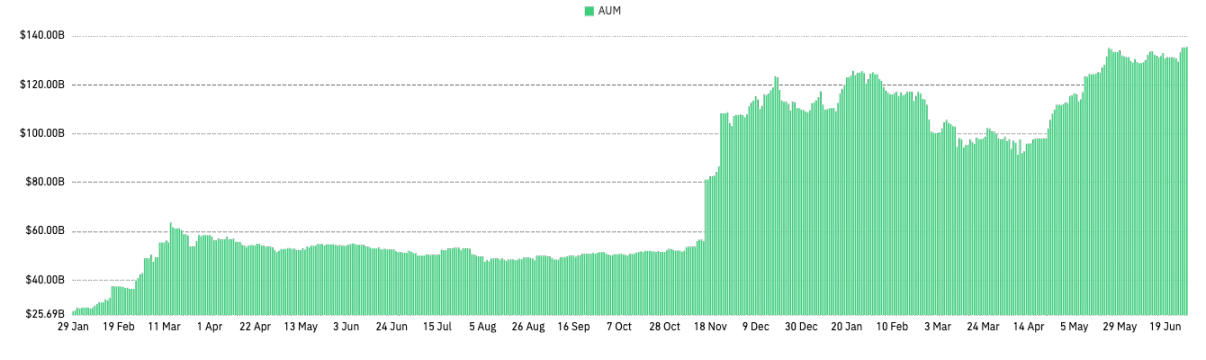
At the same time, institutional interest in BTC continued to grow, with BTC spot ETFs showing persistent net inflows. Total assets under management (AUM) for these ETFs have exceeded $130 billion. Additionally, certain global macroeconomic factors—such as a declining U.S. dollar index and diminishing trust in traditional financial systems—have enhanced BTC’s appeal as a store of value.
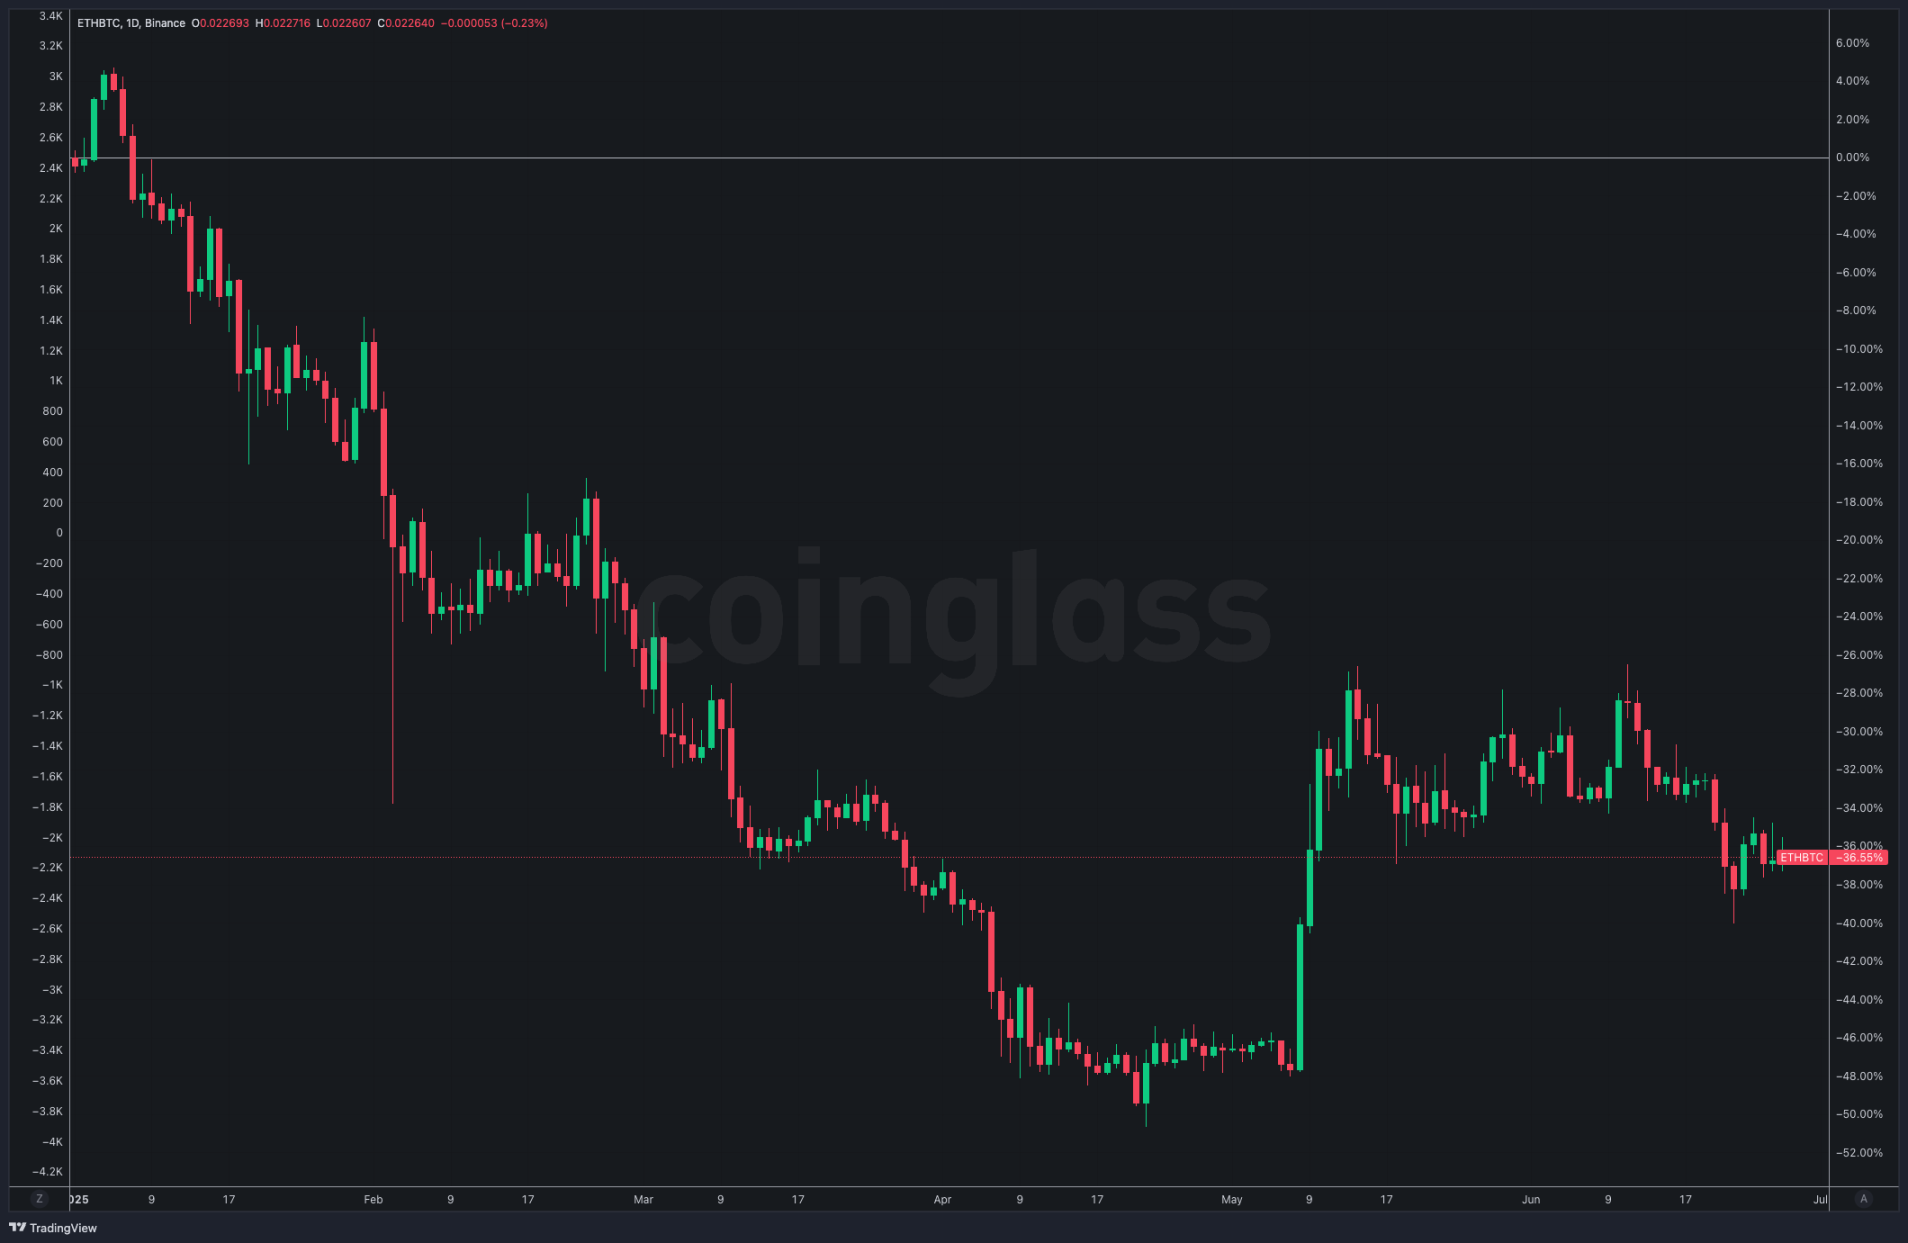
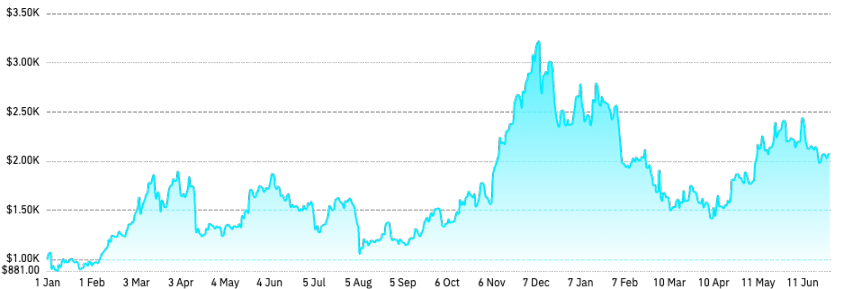
ETH’s performance in the first half of 2025 was disappointing. Despite briefly touching highs near $3,700 at the start of the year, ETH quickly retreated. By April, it had fallen below $1,400—an over 60% drop. The rebound in May was limited; even after positive technical developments such as the Pectra upgrade, ETH only recovered to around $2,700, failing to reclaim early-year highs. As of June 1, ETH prices stabilized around $2,500—nearly 30% below its年初 peak—showing no signs of strong, sustained recovery.
The divergence between ETH and BTC became particularly evident. While BTC rebounded amid rising market dominance, ETH failed to follow suit and instead showed clear weakness. This is reflected in the sharp decline of the ETH/BTC ratio, which fell from 0.036 at the beginning of the year to a low of approximately 0.017—a drop exceeding 50%. This divergence reveals a notable erosion of market confidence in ETH. Looking ahead to Q3 and Q4 of 2025, market risk appetite may recover following the approval of staking mechanisms for ETH spot ETFs, potentially improving overall sentiment.
Altcoin market performance was even weaker. Data from CoinGlass shows that despite brief rallies at the beginning of the year, major altcoins like Solana soon entered prolonged corrections. SOL dropped from a high of ~$295 to a low of ~$113 in April—a decline exceeding 60%. Most other altcoins (e.g., Avalanche, Polkadot, ADA) saw similar or even steeper declines, with some falling more than 90% from their peaks. This reflects heightened risk aversion toward high-risk assets.
In the current market environment, BTC’s status as a safe-haven asset has been clearly reinforced, transitioning from a “speculative asset” to an “institutional allocation / macro asset.” In contrast, ETH and altcoins remain primarily associated with “crypto-native capital, retail speculation, and DeFi activity,” positioning them more like tech stocks. Due to reduced funding appetite, increased competitive pressures, and macro-regulatory headwinds, ETH and altcoin markets have continued to underperform. Except for a few blockchains (like Solana) with ongoing ecosystem expansion, the broader altcoin market lacks visible technological innovation or large-scale new use cases to attract sustained investor attention. In the short term, constrained macro liquidity means that without strong new ecological or technical catalysts, ETH and altcoin markets are unlikely to reverse their weak trajectory. Investor sentiment toward altcoins remains cautious and conservative.
BTC/ETH Derivatives Positioning and Leverage Trends
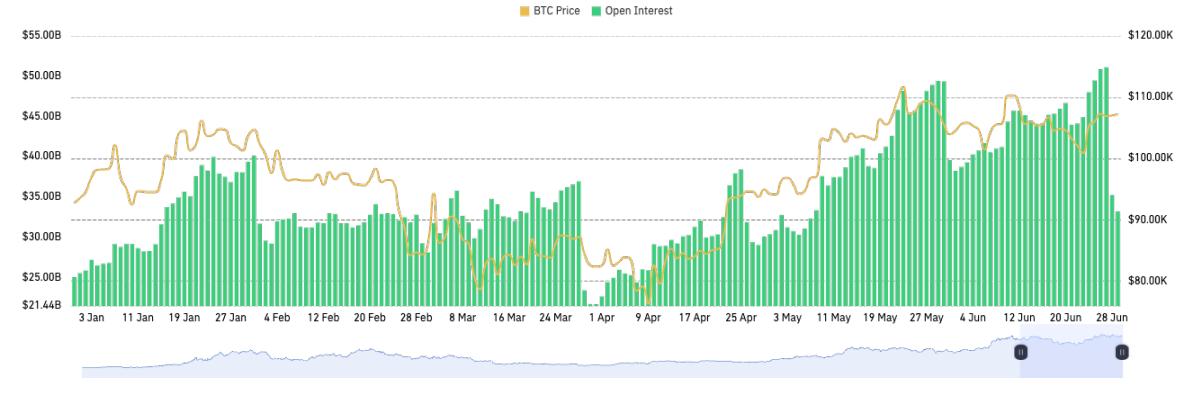
BTC open interest hit a new record high in the first half of 2025, driven by massive inflows into spot ETFs and strong demand for futures contracts. BTC futures OI surpassed $70 billion in May.
Notably, regulated exchanges like CME rapidly gained market share. As of June 1, CoinGlass data showed CME’s BTC futures open interest reached 158,300 BTC (approximately $16.5 billion), ranking first among all exchanges—surpassing Binance’s 118,700 BTC (about $12.3 billion). This reflects institutional participation through regulated channels, with CME and ETFs becoming key sources of incremental capital. While Binance remains the largest crypto exchange by open interest, its market share has been diluted.
For ETH, total open interest also reached a record high during the first half of 2025, briefly exceeding $30 billion in May. As of June 1, CoinGlass data indicated Binance held the largest ETH futures open interest at 2.354 million ETH (~$6 billion).
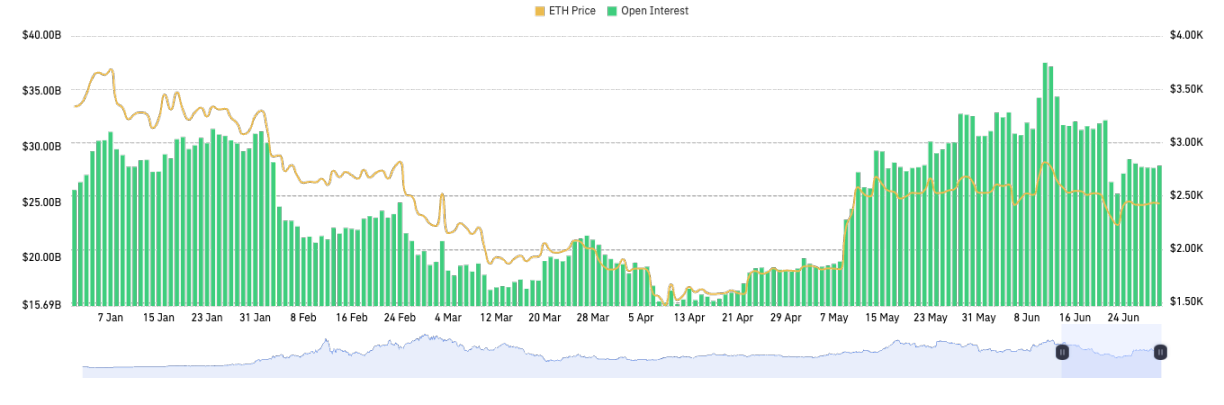
Overall, leverage usage across exchanges trended toward rationality in the first half. Although total market open interest rose, repeated sharp price swings cleared out excessive leveraged positions. Average leverage levels did not spiral out of control. Particularly after volatile movements in February and April, exchange margin reserves remained robust. While leverage metrics occasionally spiked, there was no sustained upward trend.
CoinGlass Derivatives Index (CGDI) Analysis
The CoinGlass Derivatives Index (CGDI) is a benchmark measuring price performance in the global crypto derivatives market. Currently, over 80% of trading volume in the crypto market comes from derivative contracts, while mainstream spot indices fail to reflect core pricing mechanisms effectively. CGDI dynamically tracks prices of the top 100 perpetual contracts by open interest and weights them by OI, creating a highly representative real-time indicator of derivatives market trends.
CGDI diverged from BTC price action in the first half. Early in the year, BTC rallied strongly on institutional buying, holding near all-time highs. However, CGDI began declining from February onward—driven by weak performance in other major contract assets. Since CGDI is weighted by OI across leading contracts, BTC’s outperformance contrasted with lackluster gains in ETH and altcoin futures, dragging down the composite index. In short, capital concentrated heavily into BTC during H1, supported by long-term institutional accumulation and spot ETF effects, increasing BTC’s market share. Meanwhile, cooling speculative enthusiasm and capital outflows in the altcoin sector pulled CGDI lower despite BTC holding firm. This divergence highlights shifts in investor risk appetite: ETF tailwinds and safe-haven demand drew funds into high-market-cap assets like BTC, while regulatory uncertainty and profit-taking pressured secondary and altcoin markets.
CoinGlass Derivatives Risk Index (CDRI) Analysis
The CoinGlass Derivatives Risk Index (CDRI) measures the intensity of risk in the crypto derivatives market, quantifying current leverage usage, trading sentiment, and systemic liquidation risk. CDRI emphasizes forward-looking risk warnings, issuing alerts when market structure deteriorates—even if prices are still rising. It analyzes multiple dimensions including open interest, funding rates, leverage ratios, long/short ratios, contract volatility, and liquidation volumes to build a real-time risk profile of the crypto derivatives market. CDRI is a standardized 0–100 scoring model: higher values indicate markets approaching overheated or fragile conditions prone to systemic liquidations.
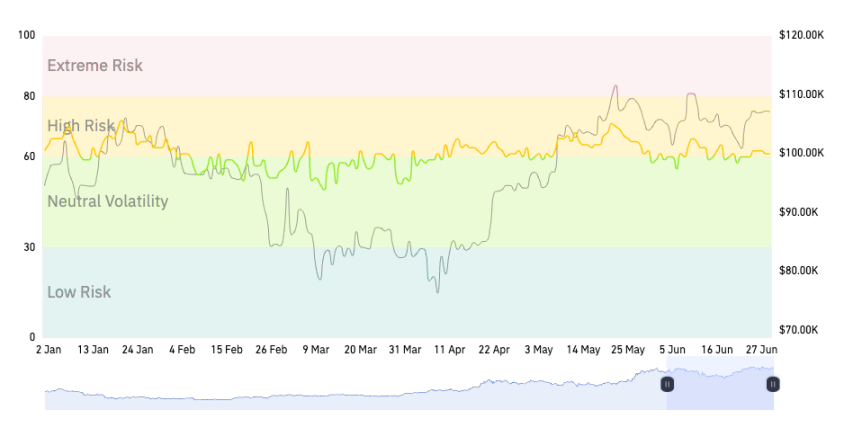
In the first half of 2025, CDRI remained moderately elevated but generally within a neutral range. As of June 1, CDRI stood at 58—within the “moderate risk / neutral volatility” zone—indicating no clear signs of overheating or panic, with short-term risks manageable.
Crypto Derivatives Data Analysis
Perpetual Contract Funding Rate Analysis
Funding rate movements directly reflect leverage usage in the market. Positive funding rates typically signal growing long positions and bullish sentiment, while negative rates suggest rising short-side pressure and caution. Fluctuations in funding rates remind investors to monitor leverage risk, especially during rapid shifts in market sentiment.
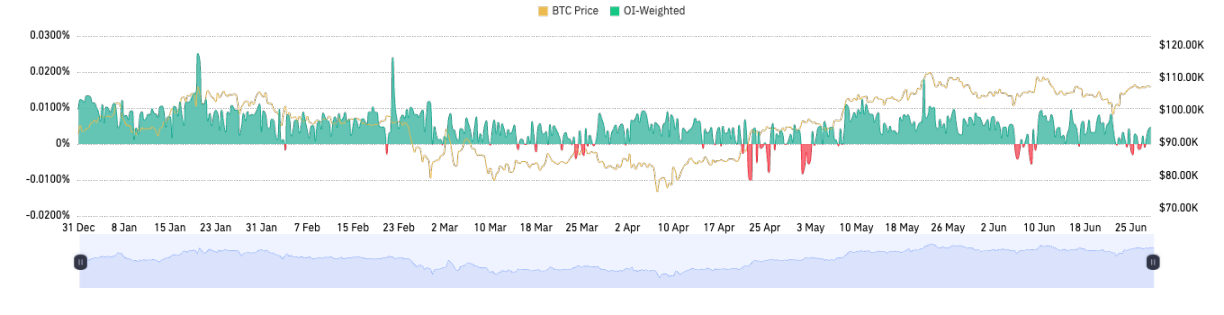
In the first half of 2025, the crypto perpetual contract market was generally dominated by longs, with funding rates mostly positive. Major crypto assets maintained funding rates above the 0.01% threshold, indicating widespread bullish sentiment. During this period, optimistic outlooks drove increased long positioning. However, as longs became crowded and profit-taking pressures mounted, BTC pulled back from its peak in late January, and funding rates normalized accordingly.
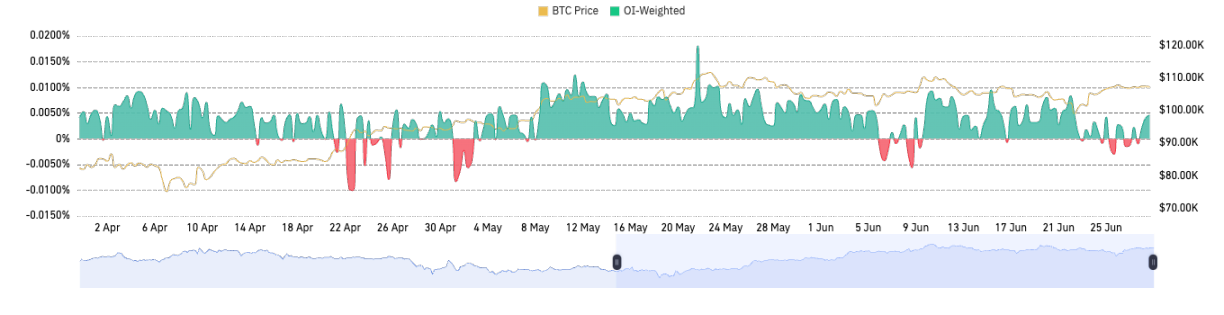
In Q2, market sentiment returned to rationality. From April to June, funding rates mostly stayed below 0.01% (annualized ~11%), turning negative at times—signaling fading speculation and more balanced long/short positioning. According to CoinGlass data, the number of instances where funding rates turned negative was very limited, suggesting concentrated bearish episodes were rare. In early February, Trump’s tariff announcement triggered a sharp sell-off, causing BTC perpetual funding rates to briefly turn negative—marking a local extreme in bearish sentiment. In mid-April, when BTC rapidly dipped to ~$75K, funding rates again briefly turned negative, reflecting panic-driven short clustering. In mid-June, geopolitical shocks caused funding rates to dip into negative territory for the third time. Outside these extremes, funding rates remained positive throughout most of H1, underscoring a structurally bullish bias. The first half of 2025 continued the 2024 trend: negative funding rates were exceptional events, each coinciding with dramatic market reversals. Thus, switches between positive and negative rates can serve as signals of sentiment inflection points—the few such flips in H1 precisely marked turning points in price action.
Options Market Data Analysis
In the first half of 2025, the BTC options market saw significant growth in scale and depth, setting new records for activity. As of June 1, 2025, the crypto options market remained highly concentrated among a few major exchanges—Deribit, OKX, and Binance—with Deribit retaining over 60% market share and maintaining absolute leadership as the primary liquidity hub for BTC/ETH options. Especially among high-net-worth individuals and institutions, Deribit is widely adopted due to its rich product suite, superior liquidity, and mature risk management. Meanwhile, Binance and OKX slightly expanded their options market shares. As Binance and OKX continue refining their options offerings, market concentration may gradually disperse, though Deribit’s lead is unlikely to be challenged in 2025. On-chain DeFi options protocols (e.g., Lyra, Premia) saw modest market share gains but remain small in absolute terms.
According to CoinGlass statistics, global BTC options open interest peaked at approximately $49.3 billion on May 30, 2025. Against a backdrop of stabilizing spot markets and declining volatility, rising options holdings clearly indicate growing demand for cross-period positioning and hedging. Regarding implied volatility (IV), H1 showed a pattern of initial decline followed by stabilization. With spot markets entering a high-level consolidation phase, options IV dropped notably from previous years. In May, BTC’s 30-day implied volatility fell to multi-year lows, signaling limited expected near-term price swings. This stands in stark contrast to the massive open interest: huge options positions coexist with historically low volatility, suggesting investors expect narrow-range trading or are adopting seller strategies to collect premiums. However, ultra-low volatility itself poses risks—if a black swan event occurs, it could trigger a sharp IV spike and position squeeze. During June’s geopolitical crisis, we observed a modest IV jump and a Put/Call ratio rise to ~1.28, indicating heightened short-term hedging demand. Overall, average IV in H1 remained moderate, avoiding the explosive spikes seen in 2021.
Key takeaways from the options market: sustained growth in holdings and improved market depth; strong investor interest in expensive call options, offset by put-based hedges; low implied volatility favoring seller strategies. Looking ahead, if the spot market breaks out of its range, IV could surge rapidly, triggering a repricing cycle in the options market.
Perpetual Contract Liquidation Data Analysis
Across the first half of 2025, long liquidations were extremely prominent. Particularly during sharp market drops, accumulated long exposure was forcibly unwound en masse. On February 3, 2025, according to CoinGlass data, approximately $2.23 billion in positions were liquidated within 24 hours, with $1.88 billion belonging to longs—over 729,000 positions wiped out in this single-day crash. This was the largest single-day liquidation event in Q1–Q2 2025, triggered by Trump’s surprise announcement of sweeping trade tariffs, sparking market-wide panic selling.
On February 25, a confluence of macro headwinds—including confirmation of tariff implementation, Walmart’s earnings warning, and hawkish Fed minutes—pushed an already fragile market into freefall. Cryptocurrencies suffered cascading sell-offs, with BTC breaking below the critical psychological level of $90,000—the lowest since November the prior year. That day, total forced liquidations amounted to ~$1.57 billion, with a similar structure to early February: predominantly longs. As prices kept falling, highly leveraged long positions built up at elevated levels were wiped out. For example, Bybit alone saw ~$666 million in liquidations, nearly 90% of which were longs. Beyond BTC and ETH, altcoins suffered harder falls—Solana, for instance, halved from its mid-January peak by end-February, down over 50%, with related perpetual contract liquidations exceeding $150 million. In early March, BTC briefly dipped to ~$82,000, with major cryptos hitting multi-month lows.
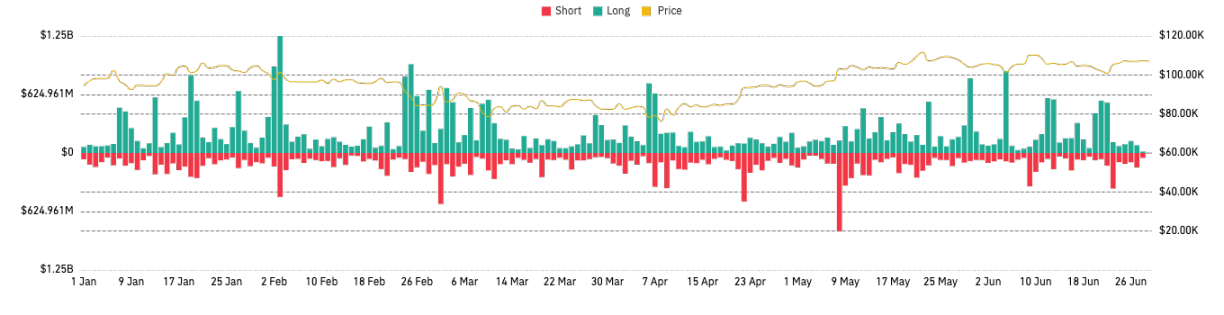
After the market hit its annual low on April 7, most leveraged long positions had been purged, setting favorable conditions for a recovery. Historically, after massive long liquidations, markets tend to stabilize due to reduced leverage risk, enabling bottom formation—a phase of "deleveraging-led recovery." On April 23, 2025, the crypto market experienced the largest short squeeze of the year, marking one of the most significant turning points so far. On April 22, BTC surged nearly 7% to $93K in a short span, forcing over $600 million in short positions to be liquidated—88% of that day’s total, vastly exceeding long losses. Major exchanges reported short liquidation shares exceeding 75%. In one-directional fast-rising markets, short squeezes dramatically amplify upward momentum, creating "stampede-like" short covering. Yet globally, short liquidation volumes in H1 were typically smaller than long liquidations: the largest short squeeze day (~$500–600 million) was clearly less than the February long liquidation day (~$1.88 billion). This reflects the prevailing uptrend context—longs were more willing to leverage and thus carried greater risk exposure. However, excessive optimism and high leverage made longs vulnerable to chain reactions once key support levels broke, leading to "death spiral"-style deleveraging events.
In February 2025, Bybit once again pushed full liquidation data to the public via API—a landmark event in the crypto derivatives space. This move came amid growing industry criticism over insufficient exchange transparency, particularly regarding incomplete disclosure of liquidation data, which has long led to information asymmetry and impaired traders’ ability to assess and manage risk. In response, Bybit proactively enhanced the breadth and depth of its data disclosures, demonstrating its commitment to strengthening platform credibility and competitiveness. By promoting comprehensive, real-time access to liquidation data, Bybit contributed meaningfully to the transparency and standardization of the crypto derivatives market. Real-time dissemination of full liquidation data helps market participants and analysts better evaluate risks, especially during volatile periods, reducing misjudgments and trading losses caused by asymmetric information. This initiative sets a strong precedent for data transparency across the industry and positively advances the healthy development of crypto derivatives markets.
Derivatives Exchange Development Analysis
Derivatives Trading Volume Analysis
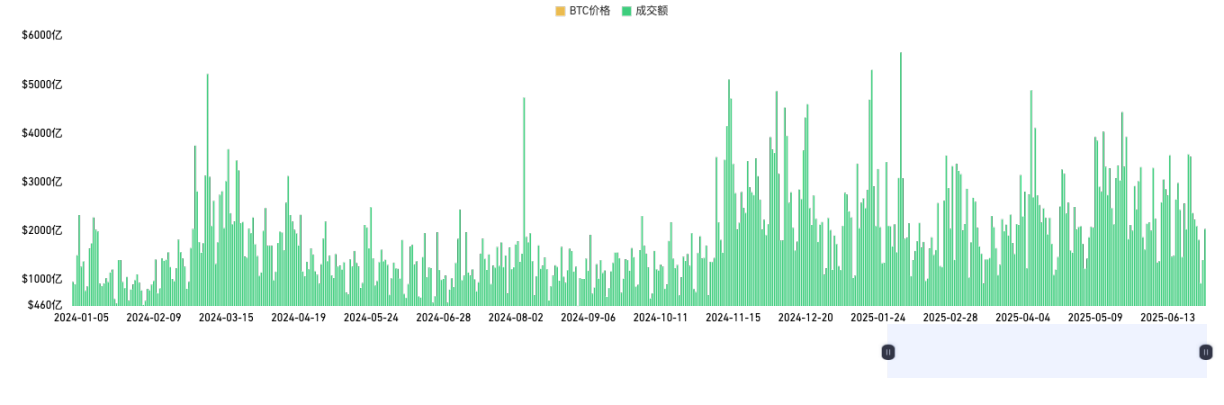
Data in 2025 shows that total crypto derivatives trading volume grew moderately compared to 2024, though with significantly increased volatility. Influenced by global macroeconomic conditions, the launch of BTC spot ETFs, and Federal Reserve policies, market activity rose markedly in 2025—especially during volatile phases, when derivatives trading volumes repeatedly set new highs. At the same time, market structure further consolidated among top-tier exchanges, with Binance, OKX, Bybit, Bitget, and Gate capturing dominant shares. Binance, as the leader, solidified its monopoly, with trading volume far exceeding other crypto derivatives platforms. Though OKX and Bybit remain competitive, the gap with Binance widened. Notably, since 2024, participation from compliant institutions (e.g., CME) has increased, accelerating the institutionalization of the derivatives market. Steady growth in trading volume reflects rising demand for risk management and leveraged instruments, but also warrants vigilance against liquidity risks in high-volatility environments and potential regulatory shifts. Overall, trading volume is highly concentrated among top platforms, with market leaders expanding their shares—intensifying the Matthew effect. Trust and liquidity are closely linked, making premium platforms the preferred destination for institutional capital and trading activity.
Binance
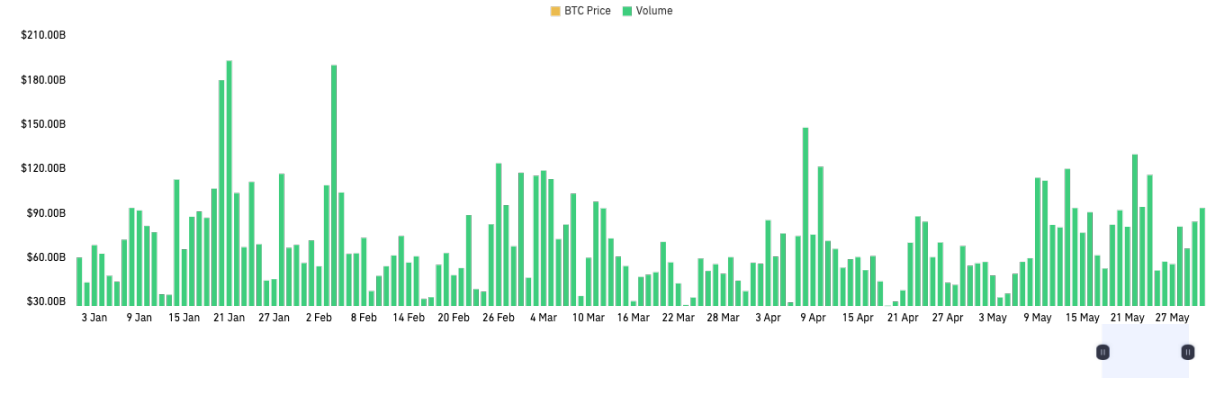
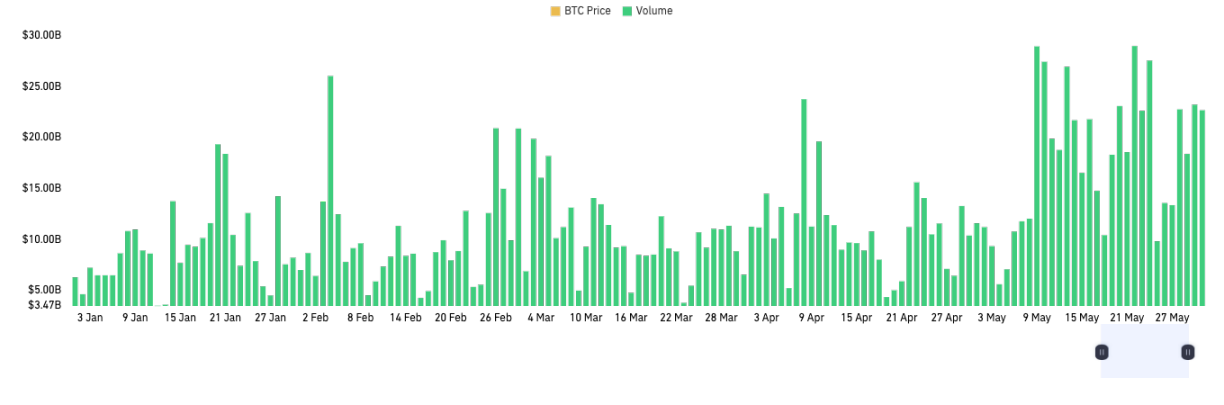
Throughout the first half of 2025, Binance maintained exceptionally high daily trading volumes, frequently approaching $2 trillion in single-day turnover. Across the entire period, Binance’s volume remained consistently high, with frequent extreme peaks—reflecting strong market appeal and deep liquidity across various market conditions (including sharp moves and stable ranges). Notably, during periods of intense volatility (e.g., rapid surges or pullbacks), Binance’s volume expanded visibly, indicating that large players and major users prefer the most liquid platform for hedging and strategic trades during turbulent times.
Binance leads daily volume by a wide margin, with a pronounced head-and-shoulders effect. Compared to peers like OKX and Bybit, Binance’s volume advantage is clear and growing. For much of the time, Binance’s single-platform volume rivals or exceeds the combined totals of other major platforms. With such high volume, Binance holds global pricing power in BTC and major derivatives contracts, giving it outsized influence over market direction and volatility.
OKX
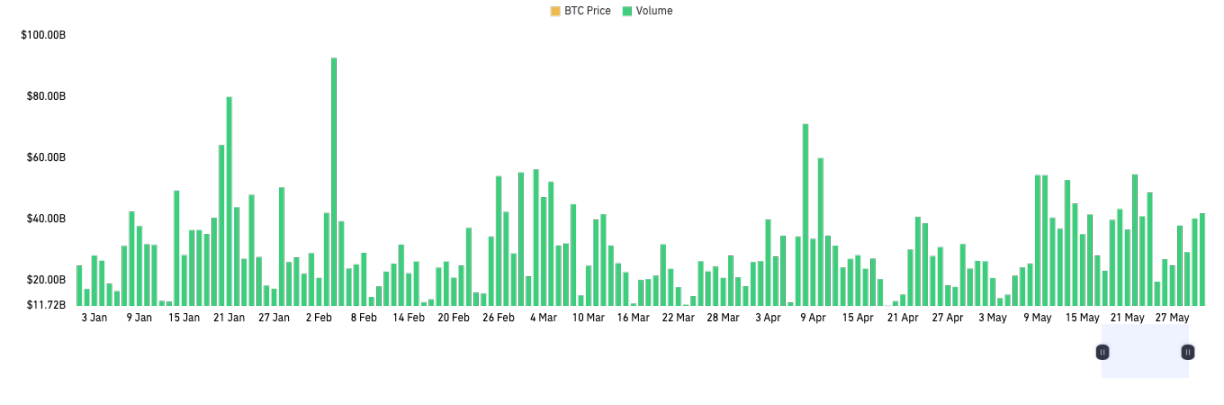
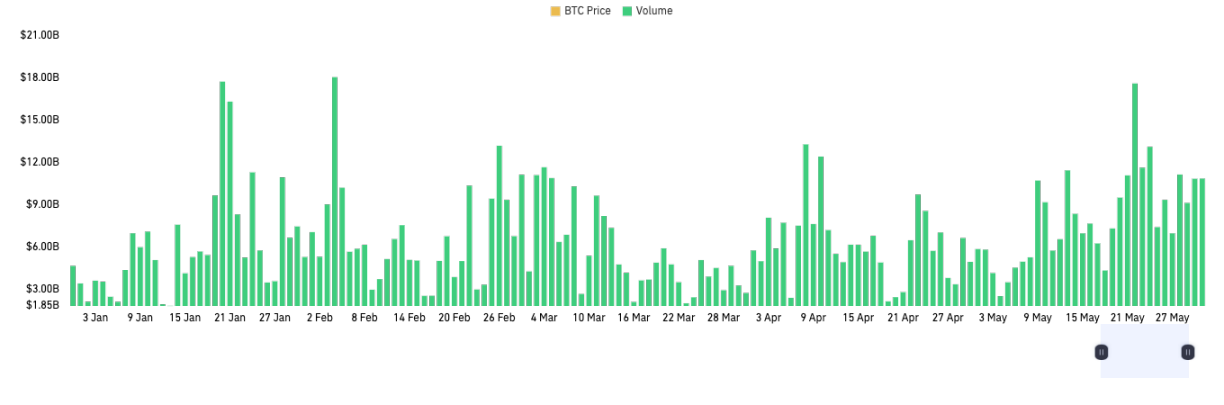
In the first half of 2025, OKX maintained strong derivatives contract trading volume, averaging around $300 billion per day, fluctuating mostly between $200–400 billion—but still significantly behind Binance. OKX’s volume showed notable volatility, with several sharp spikes during turbulent market phases, indicating strong responsiveness and market appeal. For most of the time, OKX’s volume stayed within a relatively stable range, though it generally lagged behind Binance and some fast-growing emerging platforms. This suggests OKX maintains a solid user base and liquidity in the derivatives market, but high-growth momentum is gradually weakening.
In 2025, OKX’s strategic focus shifted noticeably from traditional centralized exchanges (CEX) toward Web3 and wallet ecosystems. The explosive growth of OKX Wallet fueled its DeFi, on-chain asset management, NFT, and DApp integration ecosystems, attracting many new users and migrating on-chain assets. However, this also slowed growth in CEX derivatives volume, as active users and capital moved to on-chain or multi-chain environments. While OKX’s CEX derivatives volume remains among the industry leaders, its growth logic and liquidity landscape are undergoing profound changes. OKX maintained steady derivatives volume in H1 2025, but growth momentum lags behind top platforms. Whether it can achieve a breakthrough via Web3 businesses like OKX Wallet will be a key determinant of its future market positioning.
Bybit
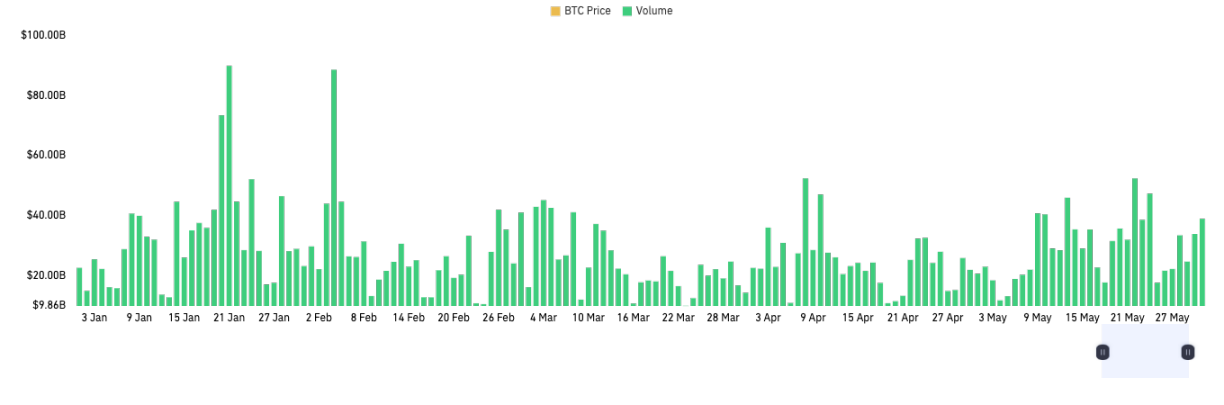
In the first half of 2025, Bybit demonstrated consistent trading activity in the perpetual contract market. Volume distribution was dense, with no prolonged dry spells—indicating active users and sustained liquidity. Daily average volume ranged from $170–350 billion. Bybit ranked third globally in perpetual contracts, behind Binance and OKX, with market share holding steady at around 10–15%. Its peak volumes matched those of OKX at times, highlighting its strong competitiveness in the crypto derivatives space. Though still significantly behind Binance, Bybit enjoys late-mover advantages in retail trading experience, Web3 community influence, and emerging market expansion. With higher penetration in Europe, North America, and Southeast Asia, and stronger brand recognition, Bybit is well-positioned to gradually capture market share from mid-tier platforms and narrow the gap with second-place OKX.
Bitget
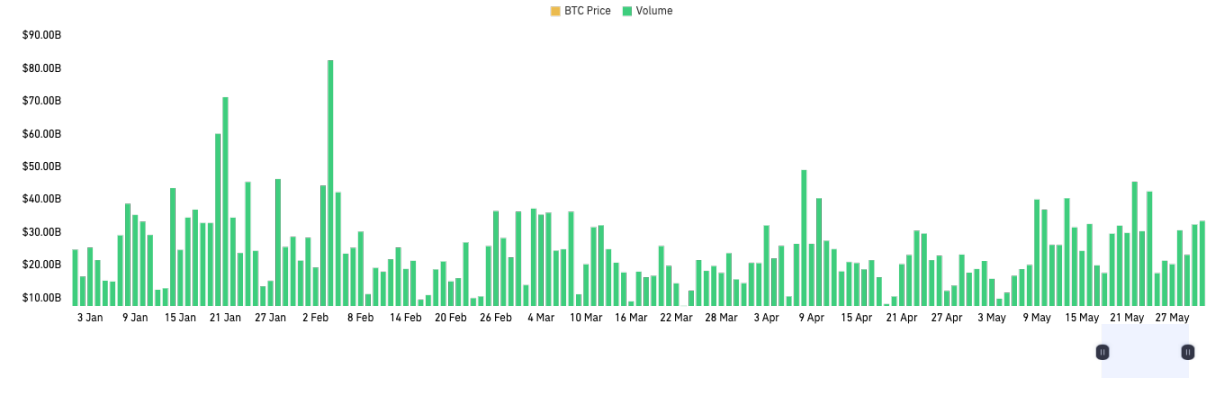
In the first half of 2025, Bitget exhibited significant growth momentum in the global crypto derivatives market, particularly in perpetual contracts. According to CoinGlass data, Bitget’s average daily perpetual volume steadily rose to the $15–30 billion range, with peaks nearing $90 billion—demonstrating strong market performance. Through a broad range of perpetual contract offerings, Bitget met diverse trading needs and attracted many younger users, especially in emerging markets like Southeast Asia and Latin America, leveraging localized marketing and brand partnerships to boost visibility and user reach. Additionally, Bitget advanced technologically, optimizing its trading system and enhancing user experience, further solidifying its market position. Though still trailing Binance and OKX, Bitget has emerged as one of the most promising contenders to join the top tier.
Gate
In the first half of 2025, Gate’s derivatives segment showed clear growth momentum, with average daily volume rising steadily to $10–30 billion and peak volumes approaching $60 billion—indicating sustained high-level trading activity within the industry. From the perspective of volume growth and market share expansion, Gate has gradually established differentiated strengths in the competitive global digital asset derivatives landscape, enhancing its influence in emerging markets and among retail investors.
The platform continues to expand its coverage of contract varieties and optimize its diversified derivatives suite—including perpetuals, options, and leveraged products—to meet the needs of users with varying risk appetites and investment goals. While still distant from leaders like Binance and OKX, Gate has become one of the most dynamic and influential emerging derivatives platforms through steady growth and competitive differentiation, drawing increasing industry attention.
Hyperliquid
Hyperliquid is one of the standout emerging decentralized derivatives exchanges (DEX) from 2023 to 2025. As of the first half of 2025, Hyperliquid’s average daily trading volume has consistently exceeded $3 billion, with peak volumes surpassing $17 billion. Leveraging proprietary chain-native matching technology, Hyperliquid achieves ultra-low latency and high liquidity without relying on oracles, significantly improving trade depth and price efficiency.
Hyperliquid ranks first in month-over-month and quarter-over-quarter volume growth within the DEX sector. Core metrics—including active users, TVL (total value locked), and protocol revenue—have substantially outpaced traditional DEXs. Over the past year, Hyperliquid achieved explosive growth—from less than $100 million in average daily volume to $3–5 billion—unprecedented in speed and scale for the DEX space. It now commands over 80% of the DeFi perpetual contract market share.
Exchange Market Depth Analysis
Market depth measures the cumulative volume and distribution of buy/sell orders at different price levels in an exchange’s order book, directly reflecting liquidity and trading capacity. For crypto exchanges, deep market depth reduces price impact and slippage for large trades, improving trading experience and cost efficiency. This is especially crucial for attracting high-frequency traders and institutional market makers who require stable pricing during large, frequent transactions. Adequate market depth also supports stable operation of derivative products like futures and options, helping maintain tight bid-ask spreads and enhancing overall price discovery and hedging effectiveness.
According to CoinGlass data, Binance maintains an absolute lead in BTC market depth among global crypto spot exchanges. Median order book depth across the market ranges from $20–25 million per side, but Binance dominates with approximately $8 million per side—around 32% market share—far ahead of Bitget (~$4.6 million) and OKX (~$3.7 million). More importantly, only Binance achieves over $1 million in depth on both sides beyond the $1 million order threshold, while all other major exchanges remain below $500,000. Binance’s overwhelming lead in BTC market depth underscores its status as the world’s largest crypto exchange in terms of liquidity, while others like OKX and Bybit still have room to catch up.
Conclusion
In the first half of 2025, the crypto derivatives market demonstrated remarkable resilience and structural divergence amid global macro instability and rising geopolitical risks. On one hand, BTC—driven by continuous inflows into spot ETFs and a wave of institutional adoption—not only broke its all-time high but also stabilized in a high consolidation range, pushing derivatives market scale and open interest to record highs. Structurally, the rising share of compliant venues like CME and the reinforcing ETF effect strengthened BTC’s identity as an “institutional allocation asset,” driving deep shifts in market risk appetite. On the other hand, ETH and major altcoins struggled under technical, ecosystemic, and funding pressures, delivering weak performance. The ETH/BTC ratio declined sharply, altcoin investor sentiment turned cautious, and the sector lacked new technological breakthroughs or scalable applications.
From a trading perspective, the derivatives leverage structure remained broadly healthy, with continued expansion in futures and options markets. Leverage risks were effectively released through multiple volatile episodes. Options market open interest and liquidity reached all-time highs, while implied volatility stayed low, indicating balanced long/short forces. Active options markets reflect coexisting bullish and hedging demands. Amid the paradox of high positions and low volatility, the risk of sudden “black swan” events remains a concern. Large-scale long and short liquidations in 2025 not only relieved leverage pressure but also laid the groundwork for subsequent price recovery and stabilization. At the platform level, Binance retained its global edge in liquidity and price discovery. OKX, Bybit, Bitget, and others strengthened competitiveness in niche segments, while decentralized exchanges like Hyperliquid displayed explosive growth, unleashing waves of innovation in the DeFi space.
Looking ahead to the second half of 2025, key market variables will remain macro policy, ETF flows, and shifts in risk appetite. Substantive changes in Fed rate policy or the approval of staking mechanisms for ETH spot ETFs could act as catalysts for renewed risk appetite. Overall, BTC’s characteristics as a “macro asset” are becoming increasingly pronounced. The institutionalization and compliance trends in the derivatives market are accelerating, benefiting leading platforms and innovative protocols. At the same time, regulatory policies, unexpected risks, and liquidity shifts remain unresolved structural challenges. Investors should continuously monitor leverage and liquidity indicators, dynamically adjust risk exposure, and actively seek balance between asset allocation and risk hedging across cycles and waves of innovation.
Join TechFlow official community to stay tuned
Telegram:https://t.me/TechFlowDaily
X (Twitter):https://x.com/TechFlowPost
X (Twitter) EN:https://x.com/BlockFlow_News


