Approaching a historic low, the "breadth" of US stocks is collapsing
TechFlow Selected TechFlow Selected
Approaching a historic low, the "breadth" of US stocks is collapsing
The S&P 500 index hits a new high, but market breadth is collapsing, with only 22 individual stocks at all-time highs—far below levels seen in previous bull markets.
 Navigating Web3 tides with focused insights
By Long Yue, Wall Street Insights
As the S&P 500 hits a record high of 6,000 points, market breadth is nearing its worst level in history.
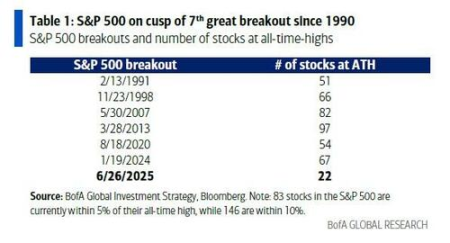
The latest report from Bank of America shows that despite consecutive new highs in the S&P 500 index, participation in this breakout has been extremely narrow—only 22 S&P 500 components have reached all-time highs.
This number is far below those seen during other major breakouts in history: 51 stocks hit new highs in February 1991, 66 in November 1998, 82 in May 2007, and as many as 97 in March 2013. In January 2024, the figure was 67, and in August 2020 it was 54—all significantly higher than today's 22.
Bank of America analyst Michael Hartnett noted this is the lowest level of stock participation during a major breakout since 1990, making it the seventh such event with the fewest advancing stocks.
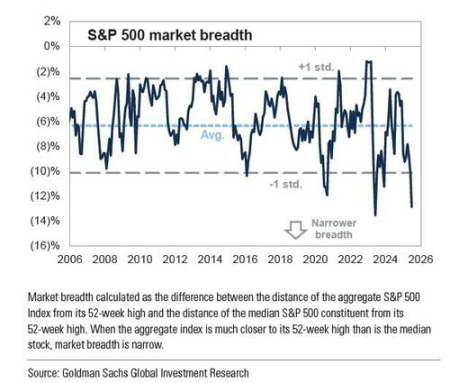
Goldman Sachs' trading team recently highlighted this unprecedented deterioration in market breadth. David Kostin, the firm’s U.S. equity strategy chief, stated in a recent report: "The S&P 500 rally has exhibited an extremely narrow character, ranking among the most concentrated advances seen over the past several decades."
He warned that market breadth for the S&P 500 is on the verge of hitting an all-time low. Data shows traditional market breadth indicators—which measure divergence between the index and its components—are approaching record lows.
Extreme Concentration Driven by Tech Stocks
Tech stocks are once again the primary driver of U.S. equity gains, continuing a trend from the past year and underscoring the highly concentrated nature of this bull market.
Recent research by Goldman Sachs strategist Peter Oppenheimer reveals that the top ten companies now account for 38% of the S&P 500’s market capitalization and 30% of its profits—both record highs.
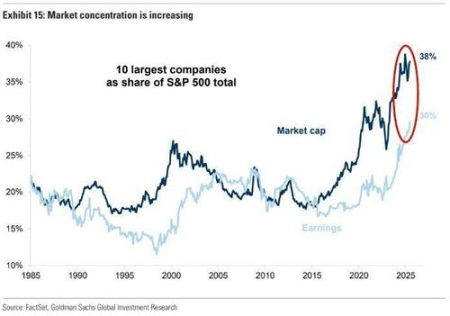
This extreme concentration reflects excessive market reliance on a small number of tech giants, particularly the so-called “Mag7” (the seven major tech stocks), which have played a decisive role in driving index performance.
The performance of the Russell 2000 Index further underscores the extent of market divergence. The index remains approximately 11% below its all-time high, sharply contrasting with the strong performance of large-cap stocks.
U.S. Equity Gains May Slow Ahead
Despite strong technical momentum, Goldman Sachs maintains a relatively cautious outlook for the next 12 months. Kostin expects the S&P 500 to rise 5% over the coming year, reaching 6,500 points. Given the index has already gained nearly 5% over the past two weeks, this forecast appears notably conservative.
Notably, July is historically one of the strongest months for the S&P 500, having never posted negative returns over the past decade, with an average return of 1.67%. Goldman Sachs’ trading team anticipates the market may peak around July 17, followed by a pullback—but acknowledges that potential "risk events" in July could bring this turning point forward.
Join TechFlow official community to stay tuned
Telegram:https://t.me/TechFlowDaily
X (Twitter):https://x.com/TechFlowPost
X (Twitter) EN:https://x.com/BlockFlow_News