What are traders thinking when shorting Bitcoin near new highs?
TechFlow Selected TechFlow Selected
What are traders thinking when shorting Bitcoin near new highs?
Bitcoin is moving away from its early speculative logic and entering a new, more mature, stable, and capital-driven cycle.
Author: BlockBeats BlockBeats
Driven by regulatory breakthroughs, structural capital inflows, and recovering market confidence, Bitcoin is once again approaching its all-time high. As the GENIUS Stablecoin Bill advances to the final Senate vote, a pathway for hundreds of billions in capital to flow into the crypto market is about to open. Simultaneously, the U.S. SEC has launched a new round of cryptocurrency rulemaking, signaling unprecedented policy support.
Meanwhile, on-chain data shows Bitcoin's non-liquid supply has reached a new high, with holdings steadily shifting from short-term speculators to long-term holders. Spot ETFs continue to attract inflows while funding rates remain low, indicating this rally is not overheated but driven by institutional buying and tightening market structure.
Bitcoin is moving beyond its early speculative phase into a more mature, stable, and capital-driven cycle. With market sentiment still restrained and volatility yet to expand, traders and institutions hold divergent views on whether new highs are imminent. BlockBeats has compiled key perspectives for readers.
Trader Analysis
Positioning Not at New High, Price Breaks First = Healthy Rally?
@CryptoPainter_X
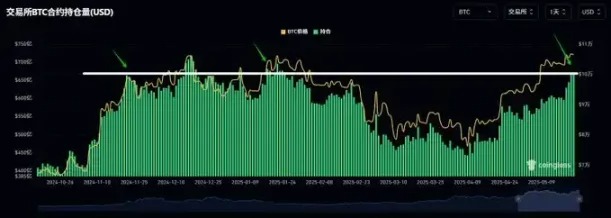
BTC's total network position is finally nearing its historical peak!
We're still $2.9 billion away from the previous record of $69.568 billion in holdings when price hit its prior high.
The current price is only $2,000 short of breaking that high. Even if futures alone drove the move, it may not be enough to increase holdings by $2.9 billion—meaning it’s difficult to see divergence between price and position size here.
If price pulls back and then holdings resume rising—even surpassing the previous peak—that could create a bearish divergence. Such large-scale bearish divergences occurred at the top in late 2021.
So the logic now is simple: if price breaks new highs before positions do, it means the market hasn’t become overly FOMO-driven—very healthy!
Conversely, if positions break new highs before price does, it signals excessive speculation, making a "position liquidation" scenario more likely.
"Rising to Absorb Selling": Active Buying Overcomes Resistance
@biupa
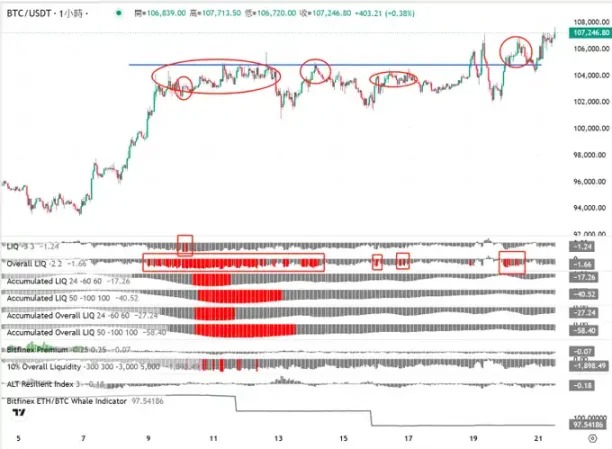
According to CoinKarma indicator, Bitcoin's "rising to absorb selling" trend continues
Yesterday during my Tencent Meeting livestream, I suggested late May would see another breakout attempt toward previous highs. One reason was anticipation of pre-consensus conference momentum; the other was the improving LIQ metric on CoinKarma. LIQ measures the imbalance between buy and sell orders. A "red" reading means significantly more spot sell orders above than buy orders below (open orders), typically seen as a "dangerous" signal.
After the first breakout above $100,000 (May 9–14), both Bitcoin and the overall market showed red readings—what we'd usually call a "danger signal." Yet we still expected a main uptrend, based on BTCUSDLONGS and ETHBTCLONGS indicators. Continuing observation shows occasional "sporadic red" signals since, but their frequency has declined even as Bitcoin remains above $102,000.
The most recent red appeared around $106,000. Despite higher prices, the red warnings have sharply decreased. Why? This is what I call the "rising to absorb selling" pattern—an important sign of bullish strength.
Normally, red LIQ levels are resolved through price drops. When there are too many sell orders at a level like $105,000, Bitcoin moves downward where resistance is lower. As price falls back to $99,000, overhead sell orders diminish and bid-side volume increases, restoring balance and halting the decline—LIQ returns to normal.
But in a "rising to absorb selling" scenario, consistent active buying continuously attacks these sell walls, gradually reducing and eventually fully absorbing sell orders at critical levels like $105,000. Thus, as price rises, the LIQ condition actually improves.
Observing that red only briefly reappeared at $106,000 two days ago, and quickly improved upon retracing to $105,000, I felt highly confident going long. This helped me hold onto long positions in PEPE, MOODENG, and others, generating profits.
Looking ahead, based on seasonality and event-driven analysis, I believe upward momentum could persist until at least the 26th. After that date, caution will be warranted. (Regardless of whether this is the main uptrend, let's stay factual.)
Additionally, altcoins won't likely see significant catch-up rallies until Bitcoin firmly holds above $110,000—until then, only short-term longs make sense.
Limited Futures Outflow, Major Players Still In—Cautiously Bullish
@roger73005305
Regarding the broader market: U.S. stocks opened with S&P 500 down 1%, but Bitcoin didn’t follow lower.
Futures accumulation previously peaked between $6.6B–$7B. The largest outflow so far is $1.7B—not substantial. Net accumulation remains at $5.65B. I believe major players haven't exited yet, so I still lean bullish.
Many say BTC whales drew many "doors" yesterday, but there's really only one true door—the one marked by my arrow. For meaningful structures, don't focus on 15-minute or 1-hour charts; look at 4-hour or daily timeframes instead.
Before a real breakout, whales often fake a breakdown to trigger long stop-losses and short squeezes, then reveal their true intent: upward movement. Also, we've consistently said whale bottom-level positions haven't been sold—so odds favor further upside.
Therefore, the primary trend is up. I won't short; I keep seeking opportunities to go long quality coins.
Key levels holding—can't turn bearish before historical highs
@Cato_CryptoM
Last night's assessment appears premature. Initially, Bitcoin moved in sync with U.S. equities, but from 11 PM onward, it entered an independent uptrend—overturning two of my earlier views:
1. Short-term topping signals—both hourly and daily levels—are invalidated
2. The impact of the stablecoin bill is still unfolding; the market hadn’t fully priced it in yet
Conclusions:
1. Price broke and held above $106,450—the second highest point in 2025. This breakout confirms effective transfer of holdings at this level, suggesting further upside. Thus, short-term bearish views aren't justified.
2. The stablecoin legislation isn't confirmed bullish until Trump signs it into law. Once enacted, watch for "buy the rumor, sell the news" dynamics.
3. The next key resistance zone is the all-time high—a psychological threshold and major area of potential handover.
Of course, you might ask: are my shorts still on? Yes—they are. I’ll consider adding on the first opportunity near the all-time high.
Stalled Concentration: Directional Uncertainty, Volatility Ahead
@Murphychen888
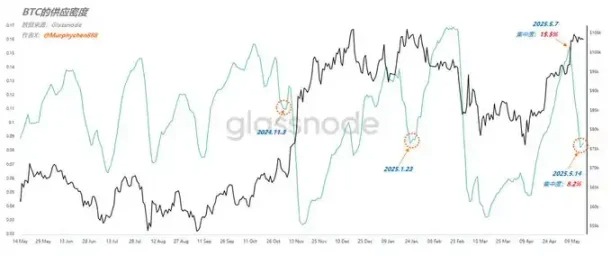
From May 7 to May 14, BTC's holder concentration dropped sharply from a peak of 15.5% to just 8.2% within seven days. This indicates price has moved well beyond its previous concentration zone. If the concentration curve keeps declining, further price gains are likely.
However, after May 14, the curve suddenly stalled around 8.2% and shows slight signs of turning upward again. At 8.2%, concentration is neither particularly high nor low.
If price falls back into the concentrated zone, the concentration ratio would rise rapidly, potentially triggering greater volatility. As shown in the chart on Jan 23, 2025, a pullback caused concentration to initially drop from highs, then reverse upward mid-way—followed by amplified price swings.
Alternatively, if price continues rising, the concentration curve may pause briefly before resuming its downward trend—as seen on Nov 3, 2024.
In short, the fact that concentration hasn't smoothly declined but instead paused mid-way reintroduces directional uncertainty. This indicator doesn't clearly suggest bull or bear bias—it simply signals the market may soon choose direction.
Still, when concentration rises to a certain level, betting on increased volatility becomes an attractive strategy.
Institutional Insights
CryptoQuant: No Signs of Market Overheating
Whenever prices surge strongly, causing a large number of previously underwater coins to flip into profit, the 30-day simple moving average (SMA) of the UTXO Realized Profit/Loss ratio tends to climb above 200. The higher this metric spikes, the closer the market may be to an "overheated" or "supply release" phase.
Currently, the metric stands at 99—showing no sign of overheating. Only if this SMA sustains above 200 will it signal a clear shift into euphoric market sentiment. In other words, Bitcoin could still reach new highs, but the "easy fuel" driving profit ratios upward has largely been exhausted. Further gains in this metric will require stronger price momentum or heightened volatility.
As I mentioned yesterday, the third "compression phase" of this cycle is precisely the springboard needed to push this indicator past 200 and into overheated territory.
Matrixport: Spot Demand Drives Rally, Long-Term Capital Replaces Speculation
Bitcoin is repeating a historic pattern: price nears new highs while open interest climbs to a record $34 billion. Yet funding rates remain close to zero—indicating this rally is driven by spot demand, not leveraged futures.
Low funding rates imply limited speculative froth and a reduced risk of sharp corrections triggered by leverage unwinding. As a result, volatility remains subdued this cycle, with little chance of dramatic swings in the near term.
Bitcoin's market structure is evolving—long-term capital is gradually replacing short-term speculation as the dominant force.
10x Research: Long-Term Holders Keep Accumulating—Cycle Isn't Over
On-chain analysis reveals that throughout 2025, Bitcoin's "OG" wallets—early investors, miners, and legacy exchanges—have been systematically distributing supply. This isn't panic selling, but a deliberate, paced rotation of assets flowing steadily into the hands of high-net-worth individuals, hedge funds, and corporate treasuries like MicroStrategy. Meanwhile, exchange reserves remain low and market volatility is suppressed. This is not a retail-fueled spike like in 2017 or 2021.
This cycle is slow, strategic, and institutionally led. As long as large players can keep absorbing selling pressure, Bitcoin still has room to rise. History shows the real danger isn't when long-term holders start selling—but when they stop. That’s when demand weakens and absorption fails, forcing early investors back into passive holding. We saw this signal clearly in March 2024 and again in January 2025—both times prompting us to turn bearish promptly.
Now, long-term holder balances continue to rise—confirming the cycle is not over. We accurately predicted Bitcoin’s breakout above $84,500, followed by moves to $95,000 and $106,000. Our next target is $122,000—based on our macro-cycle and behavioral capital flow models, which have successfully identified major turning points in the past.
QCP: New Highs Could Trigger Further FOMO
Japan's 30-year government bond (JGB) yield has broken above 3%, crossing a historic threshold. Japan’s ballooning debt has long been a latent concern, and it’s now nearing a breaking point. If this bond selloff persists and fiscal worries intensify, markets may reassess Japanese risk, potentially driving short-term yen appreciation. Japan's market tremors are already spilling into global markets. U.S. 30-year Treasury yields have reclaimed 5%, drawing investor attention to America’s own debt trajectory.
Meanwhile, Bitcoin attempted to breach $108,000 today but failed to sustain momentum. Current price action is closely tied to continued accumulation by Strategy and Metaplanet—still the primary sources of demand. However, growing concerns suggest they may represent the last wave of "marginal buyers." If their buying slows, it could prompt other investors to take profits, reversing the current uptrend.
Despite persistent macro headwinds—including surging bond yields, escalating tariffs, and potential stagflation risks in the U.S. during Q3 and Q4 of 2024—Bitcoin has shown remarkable resilience over the past month. That said, a decisive break above all-time highs could ignite fresh FOMO, pulling sidelined capital into the market and pushing prices even higher.
Join TechFlow official community to stay tuned
Telegram:https://t.me/TechFlowDaily
X (Twitter):https://x.com/TechFlowPost
X (Twitter) EN:https://x.com/BlockFlow_News