Is the bull market still alive? These indicators can help you determine whether now is the time to buy the dip
TechFlow Selected TechFlow Selected
Is the bull market still alive? These indicators can help you determine whether now is the time to buy the dip
Is it a good time to dollar-cost average into BTC again?
By TechFlow
Bitcoin has dropped from a high near $110,000 to below $80,000 at its lowest. Naturally, there are more cries than laughter in the market during this period. Amid widespread talk of "topping out" and "the bull run is over," Trump's erratic statements have repeatedly slammed the door shut on sentiment, pushing the market into an even more desperate mood.
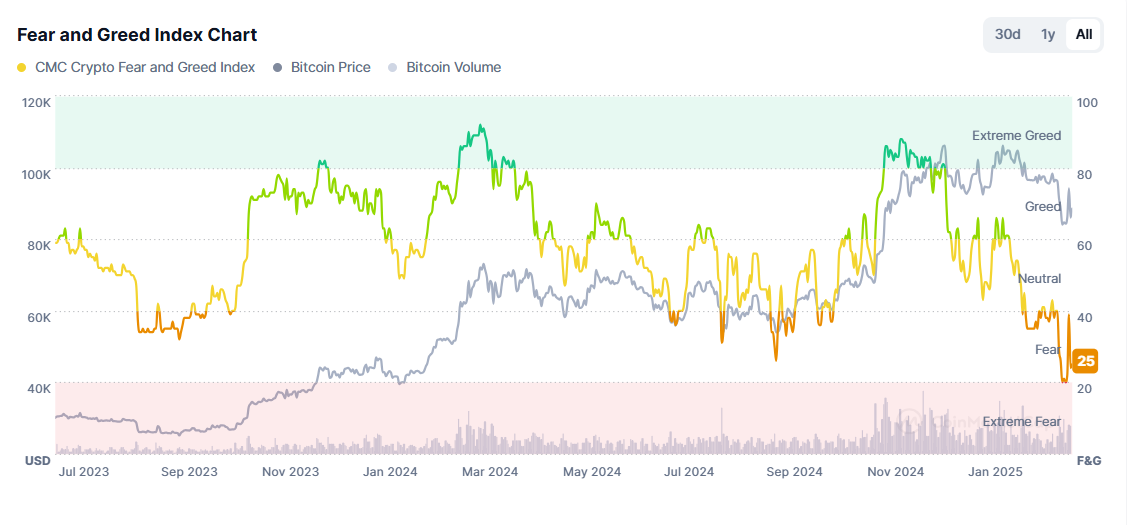
While Bitcoin’s current price—close to $90,000 per coin—remains relatively high in absolute terms, according to CMC data, the market fear & greed index has dropped to 25, entering the “fear” zone. Market sentiment has hit one of its lowest points in recent years.
Market Veterans: Don't Panic, the Bull Is Still Alive
The market may be panicking, but seasoned traders are actively posting optimistic analyses, urging calm and advising against panic-selling precious holdings.
Arthur Hayes, in his latest article "KISS of Death", notes that Trump’s political strategies act like a double-edged sword for the crypto market. His highly dramatic decision-making tends to be amplified many times over within the crypto space, stirring emotions while also leading markets toward misjudgment. However, considering Trump’s past business behavior, these stimulative actions—though potentially disruptive in the short term—tend to benefit asset classes (including Bitcoin) over the long run. Staying calm and buying the dip remains a high-probability strategy right now.
Lao Mao, in his article "I’ll Drink This Shot, You Do What You Want!", also argues that compared to previous cycles’ “mania” phases, this bull market has been unusually conservative, with Bitcoin’s gains far from spectacular. Moreover, the full impact of upcoming global monetary easing and the Trump administration’s proposed “crypto reserves” policy has yet to materialize. Key macro-cycle indicators also suggest that a bear market is not imminent, meaning we’re still well within a healthy bull phase.
Yes, beyond the noisy chaos, there are numerous objective metrics investors can rely on. In moments of panic, these indicators might just help you escape emotional whirlpools and see the true state of the market clearly.
Market Indicators: Bitcoin Has Not Peaked Yet
The good news is, according to CoinGlass’s compiled "Bull Market Peak Warning Checklist", all 30 related data points indicate the market hasn’t peaked—and some even strongly suggest holding or accumulating assets at this stage.

Let’s examine some widely used metrics:
-
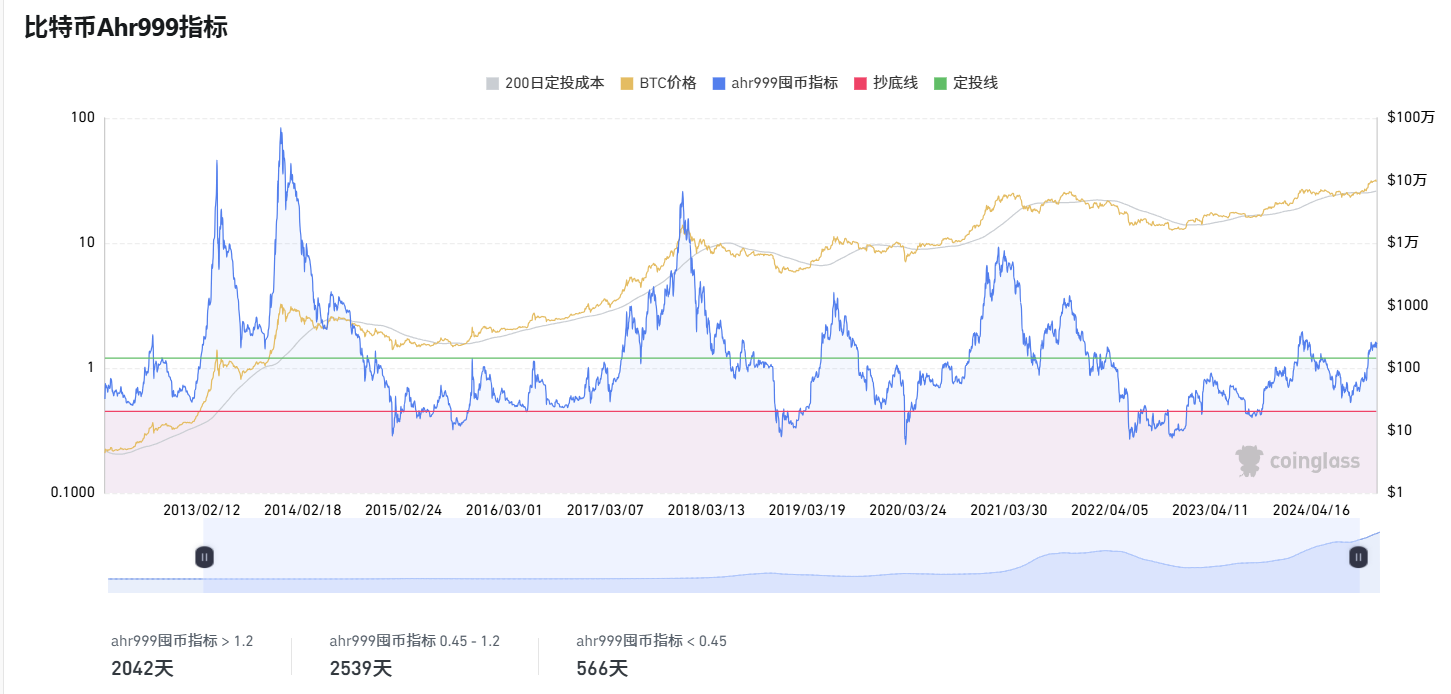
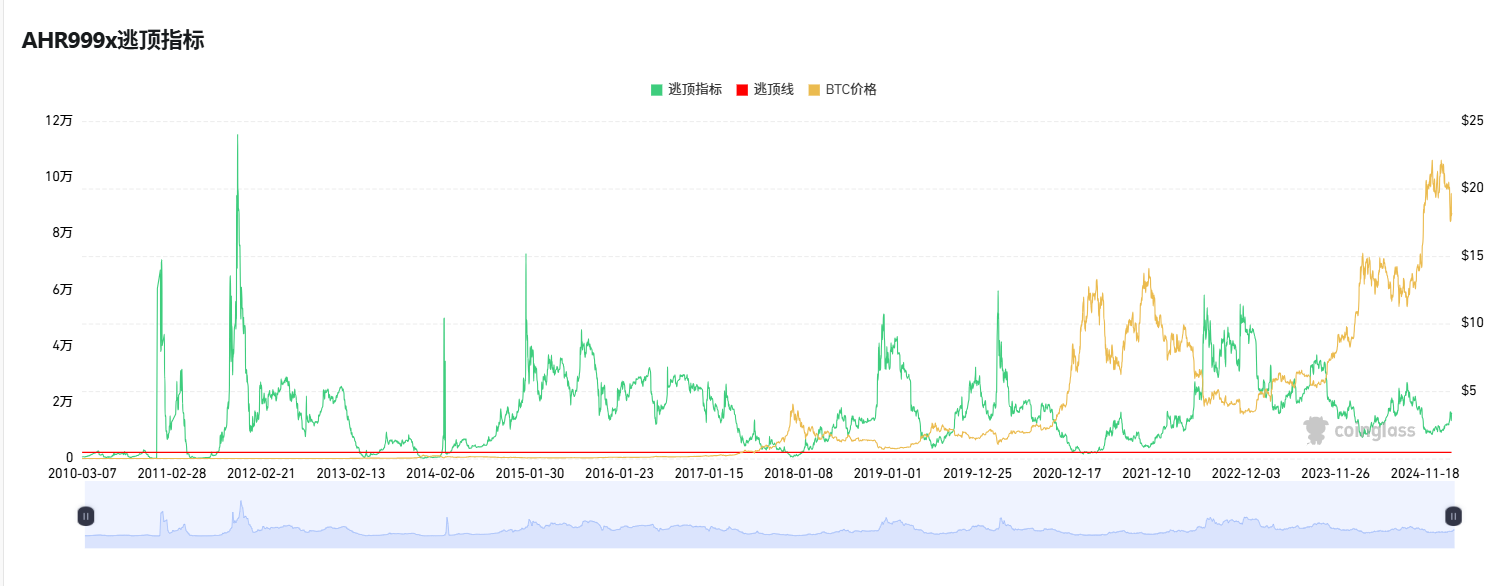
Bitcoin AHR999 Indicator
Created by Weibo user ahr999, also known as the “God 9” indicator, it guides Bitcoin dollar-cost averaging (DCA) investment.
Formula: (Current Price² / 200-day Cost Basis / Fitted Predicted Price), used to guide DCA timing.
Threshold: < 0.45 = buy zone; 0.45–1.2 = DCA zone; 1.2–5 = hold and ride; ≥ 4 = likely nearing top.
Current Value: 0.92
Assessment: Currently in the DCA range (0.45–1.2), indicating the market is neither at a bottom nor a top. There's still upside potential—consistent with early-to-mid bull market conditions.
-
AHR999x Top-Catching Indicator
-
Definition: An inverse transformation of AHR999, calculated as 3/AHR999.
-
Threshold: ≤ 0.45 may signal a top.
-
Current Value: 3.28
-
Assessment: Far above threshold, suggesting the top has not been reached. The indicator confirms the bull market continues.
-
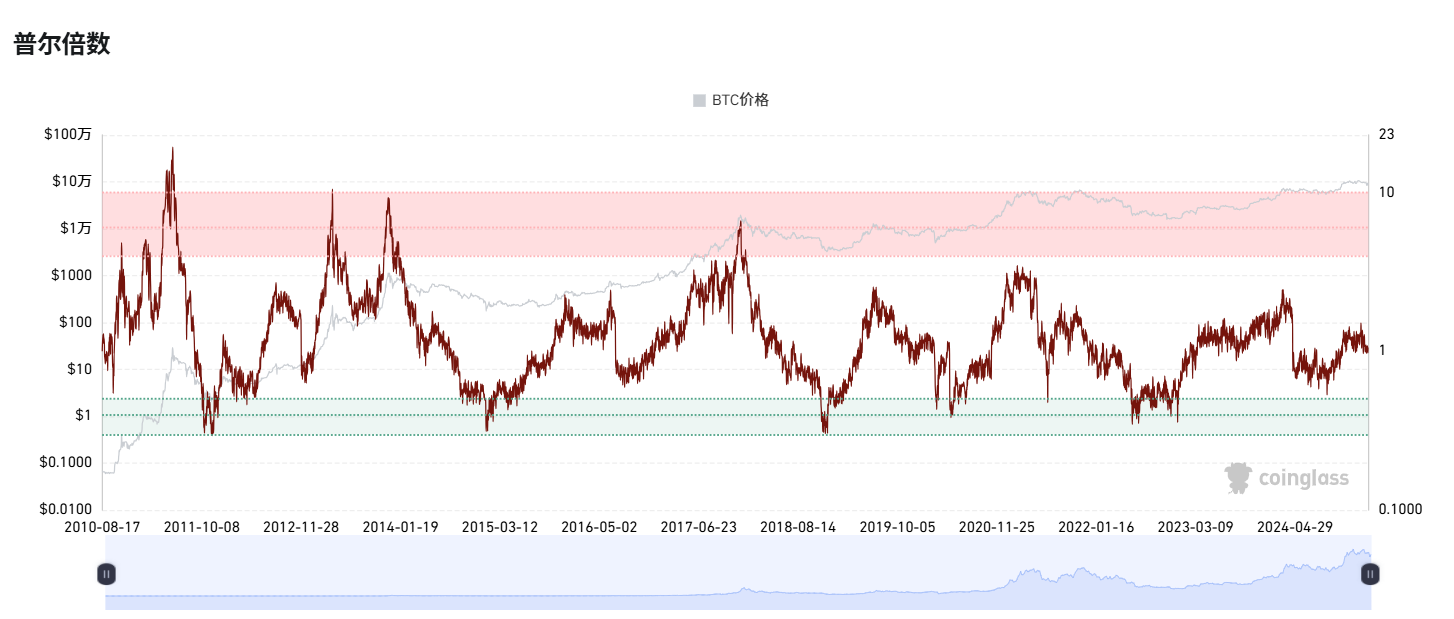
Pi Cycle Indicator
Historically, the Pi Cycle Top Indicator has accurately pinpointed market cycle peaks within three days.
It uses the 111-day moving average (111DMA) and twice the 350-day moving average (350DMA × 2, where the multiplier applies to price, not days).
-
Threshold: Current price ≥ $149,567 may indicate a top.
-
Current Value: $89,913
-
Assessment: Well below threshold, suggesting the bull market peak is still far off and prices remain in an upward phase.

-
Puell Multiple
-
Definition: Ratio of daily miner revenue to its 365-day moving average, reflecting selling pressure from miners. Calculated as (Daily Miner Revenue / 365-day MA of Miner Revenue).
-
Threshold: ≥ 2.2 may signal a top.
-
Current Value: 1.05
-
Assessment: Below threshold, indicating low miner sell pressure. Bull market signal remains intact.
-
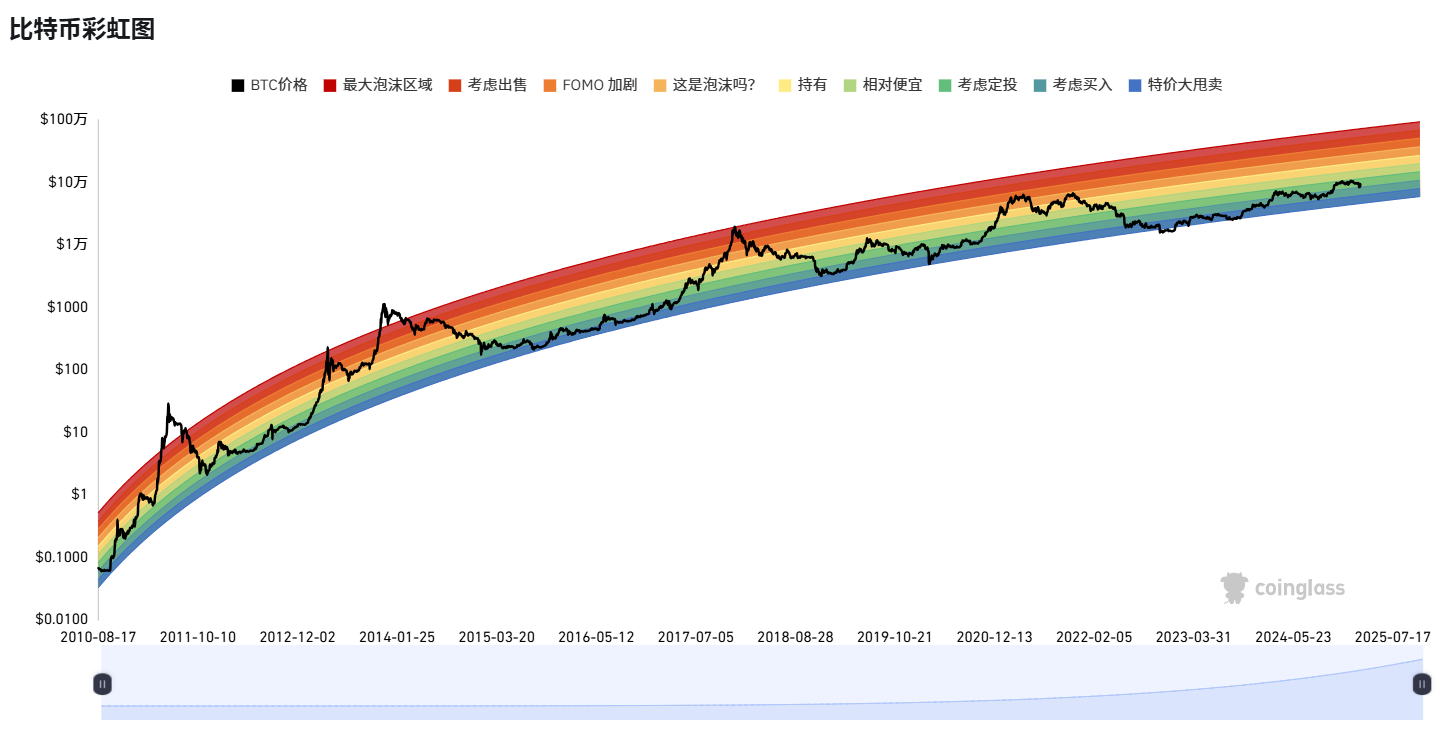
Rainbow Chart
-
Definition: Log-regression-based Bitcoin price bands, divided into levels 1–9, with level 9 representing extreme overvaluation.
-
Threshold: ≥ 5 may signal a top.
-
Current Value: 3
-
Assessment: Mid-to-lower range, suggesting the market isn’t overheated and remains within a reasonable bull market range.
-
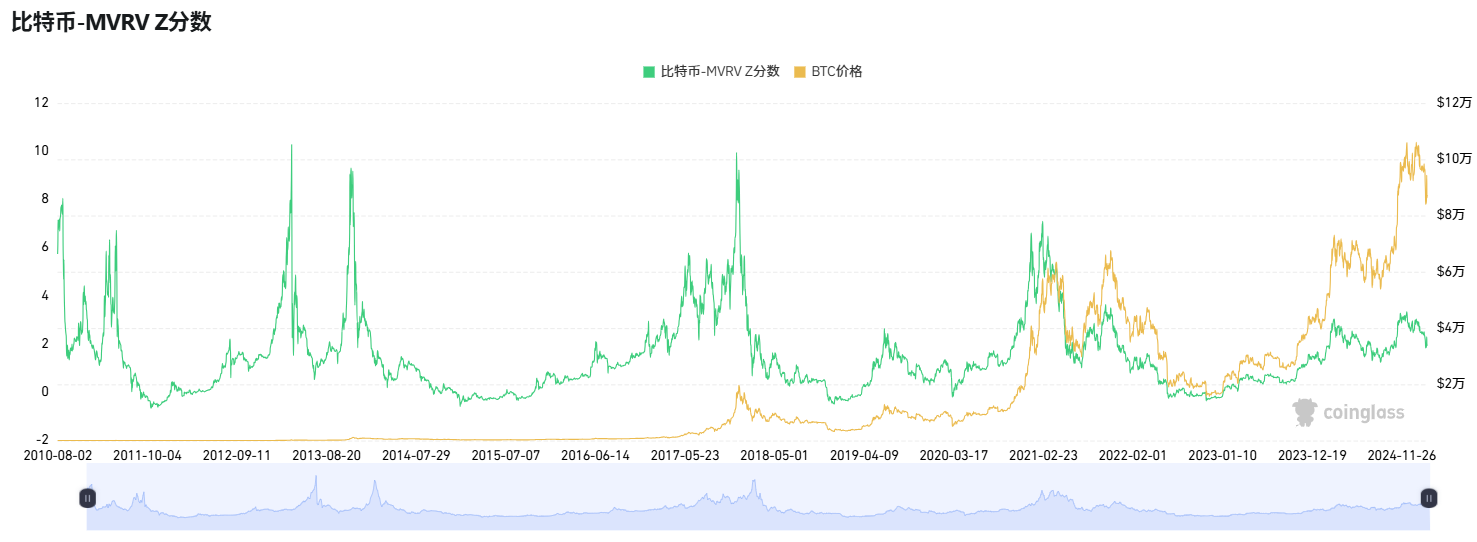
Bitcoin MVRV Z-Score
-
Definition: Standardized score of the MVRV ratio, measuring market valuation.
-
Threshold: ≥ 5 indicates overvaluation, possibly a top.
-
Current Value: 1.98
-
Assessment: Below threshold, market not overheated. Indicator supports ongoing bull market.
-
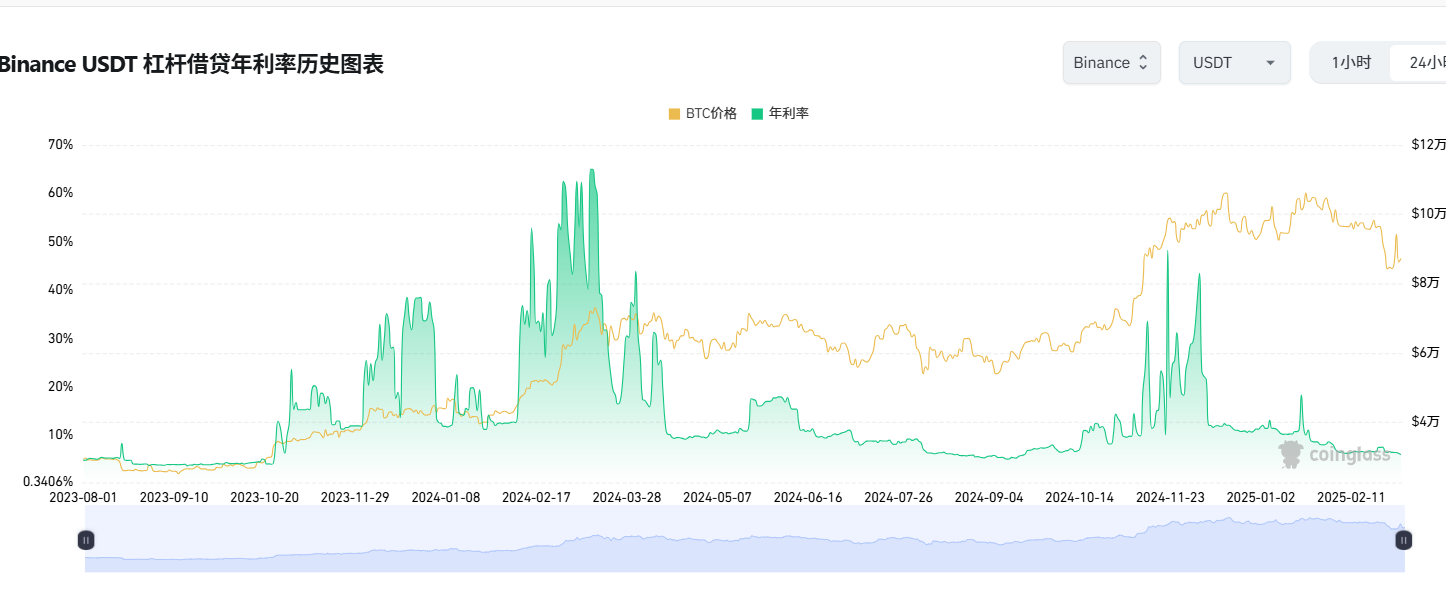
USDT Yield in Flexible Savings Products
-
Definition: Annualized yield from USDT savings products, reflecting market funding costs.
-
Threshold: ≥ 29% suggests tight liquidity, possibly signaling a top.
-
Current Value: 6.1%
-
Assessment: Far below threshold, indicating loose liquidity and supportive conditions for the bull market.
-
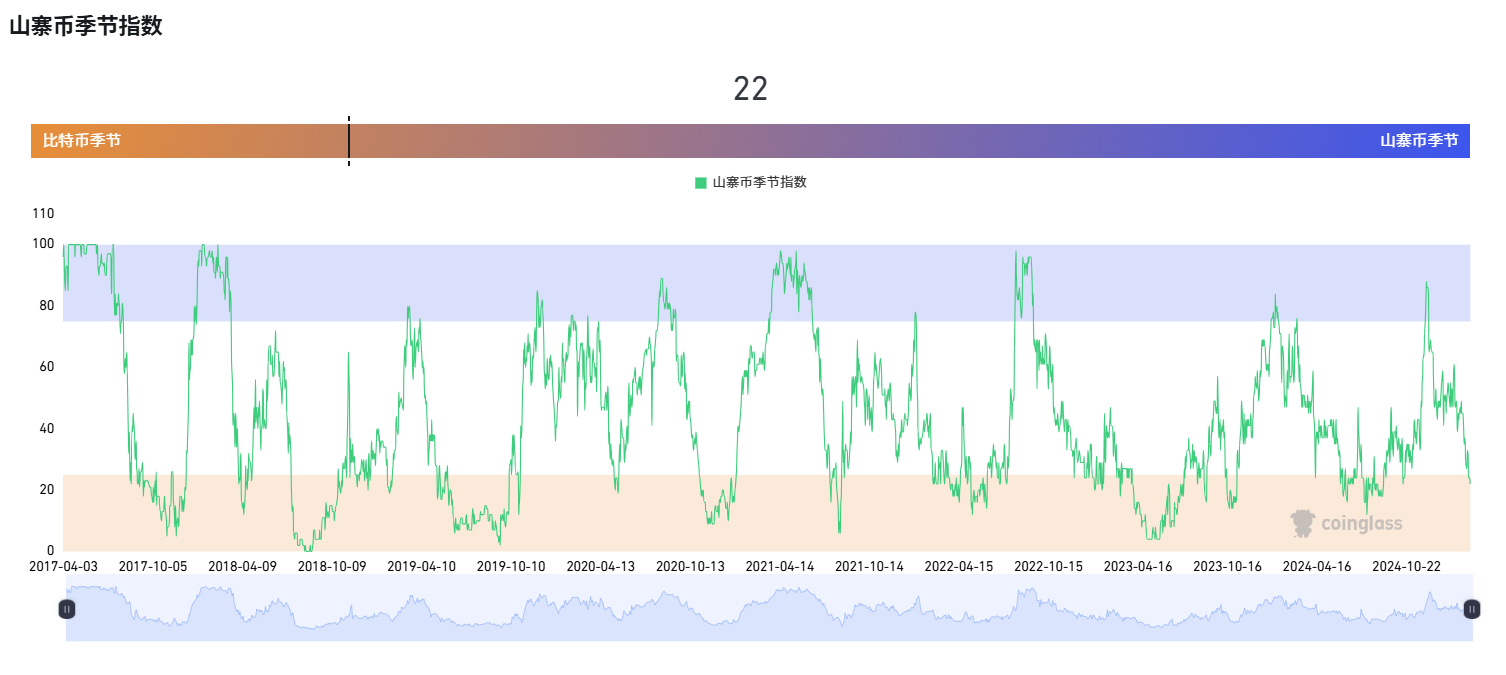
Altcoin Season Index
-
Definition: One of the most referenced indices for gauging bull/bear markets, comparing Bitcoin’s performance against major altcoins. If most altcoins outperform BTC, it signals an “altseason.” Although this bull cycle differs from prior ones and a traditional altseason may not reoccur, this historically reliable metric remains broadly trusted.
-
Threshold: ≥ 75 indicates altseason, often seen in late bull stages.
-
Current Value: 18.00
-
Assessment: Well below threshold, showing Bitcoin dominance. Suggests early-to-mid bull phase.
-
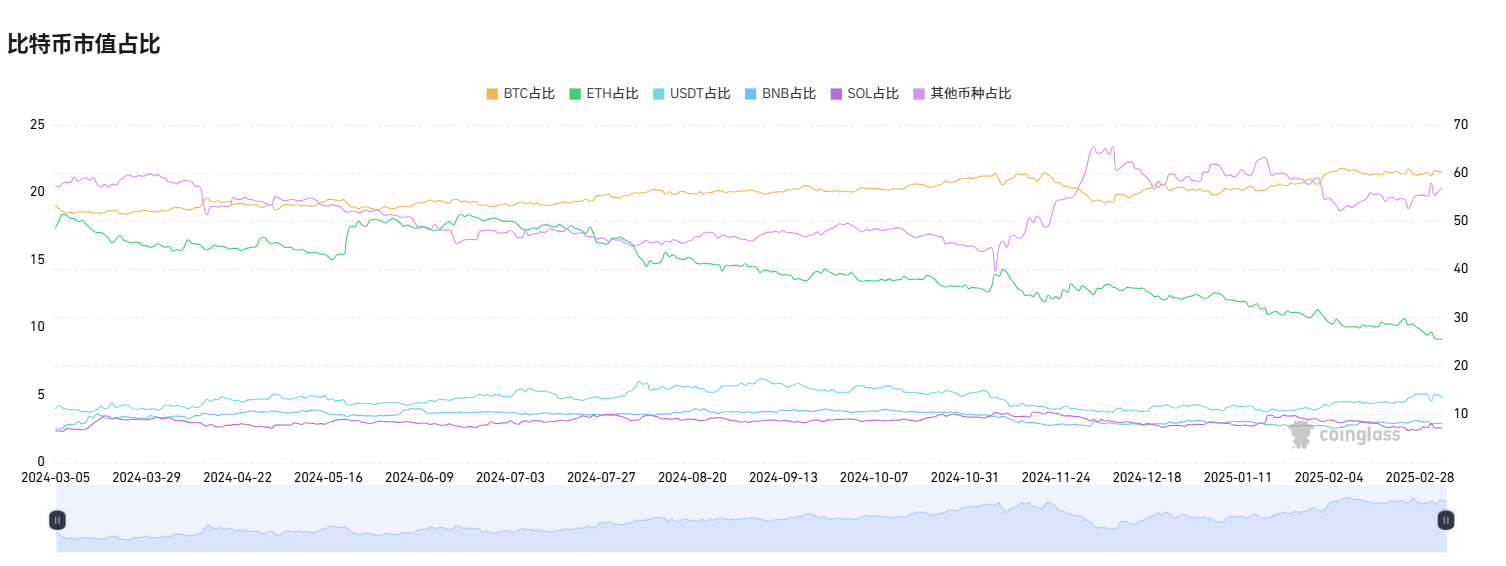
Bitcoin Market Dominance
-
Definition: Bitcoin’s share of total crypto market cap, which has remained between 50%–60% over the past year.
-
Threshold: ≥ 65% may signal a strong BTC top.
-
Current Value: 60.21%
-
Assessment: Approaching but not exceeding threshold—BTC dominant but not peaking.
-
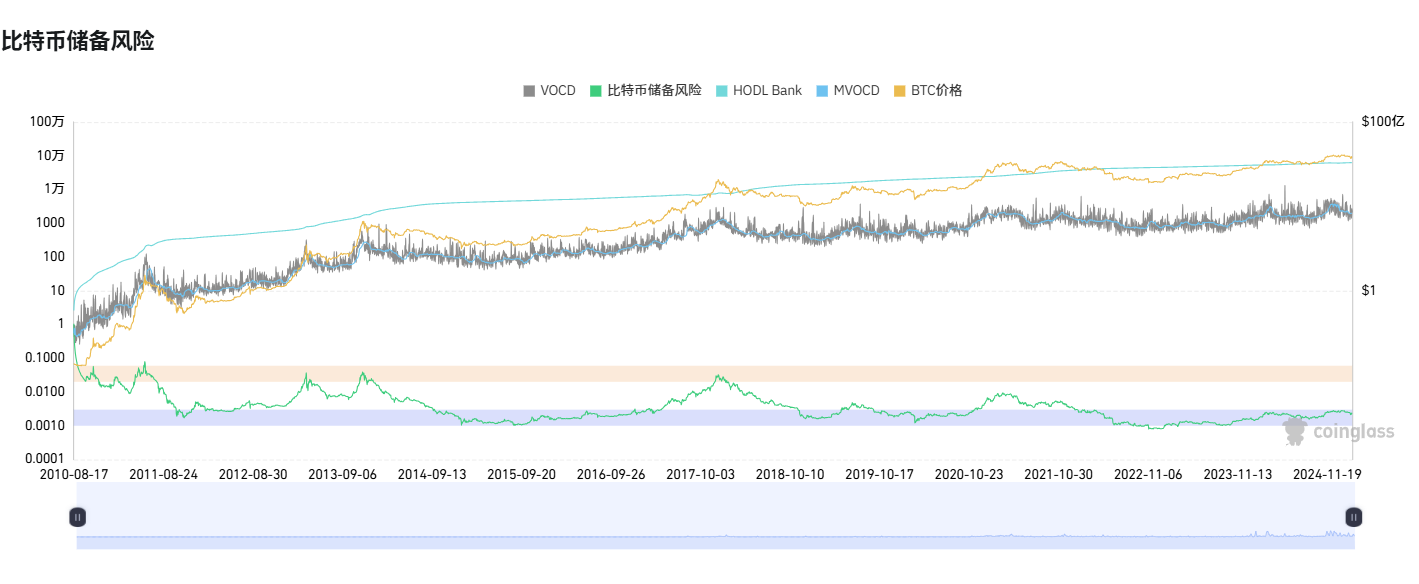
Bitcoin Reserve Risk
-
Definition: Measures holder confidence versus opportunity cost.
-
Threshold: ≥ 0.005 may indicate a top.
-
Current Value: 0.0023
-
Assessment: Below threshold, indicating high holder confidence. Signal confirms ongoing bull market.
-
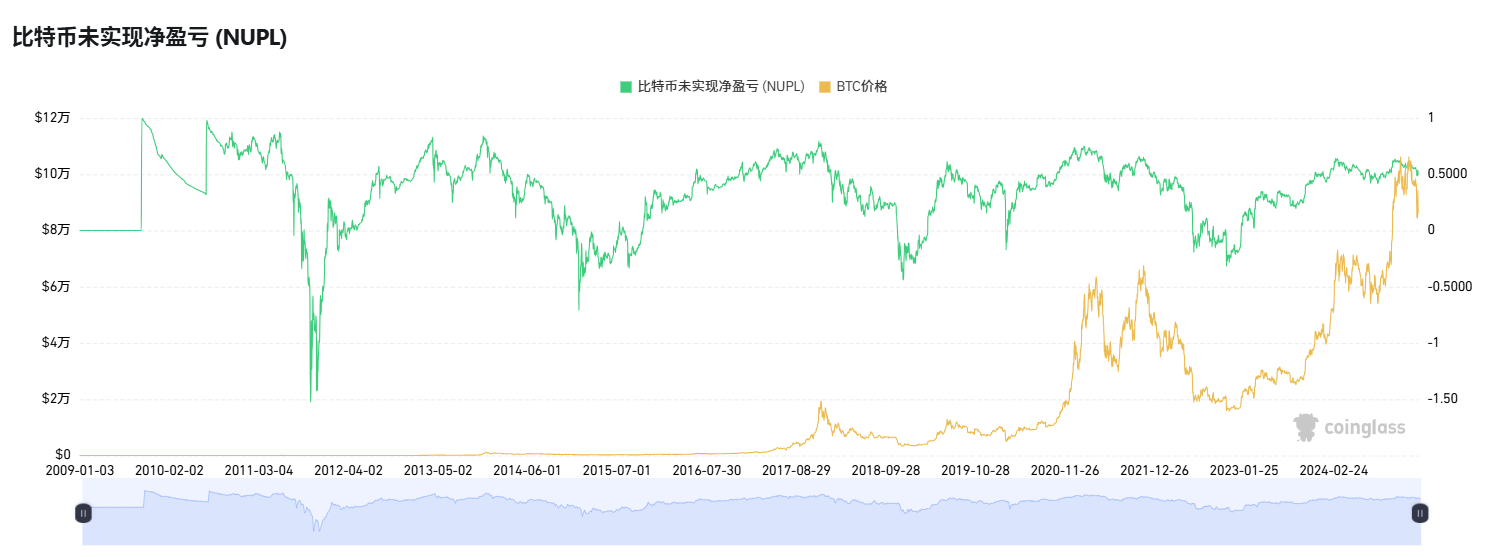
Bitcoin Net Unrealized Profit/Loss (NUPL)
-
Definition: Percentage of unrealized profit or loss across all Bitcoin holdings.
-
Threshold: ≥ 70% may signal a top.
-
Current Value: 50.27%
-
Assessment: Below threshold—over half of holders are in profit, but not excessively so. Market remains in upward phase of bull cycle.
-
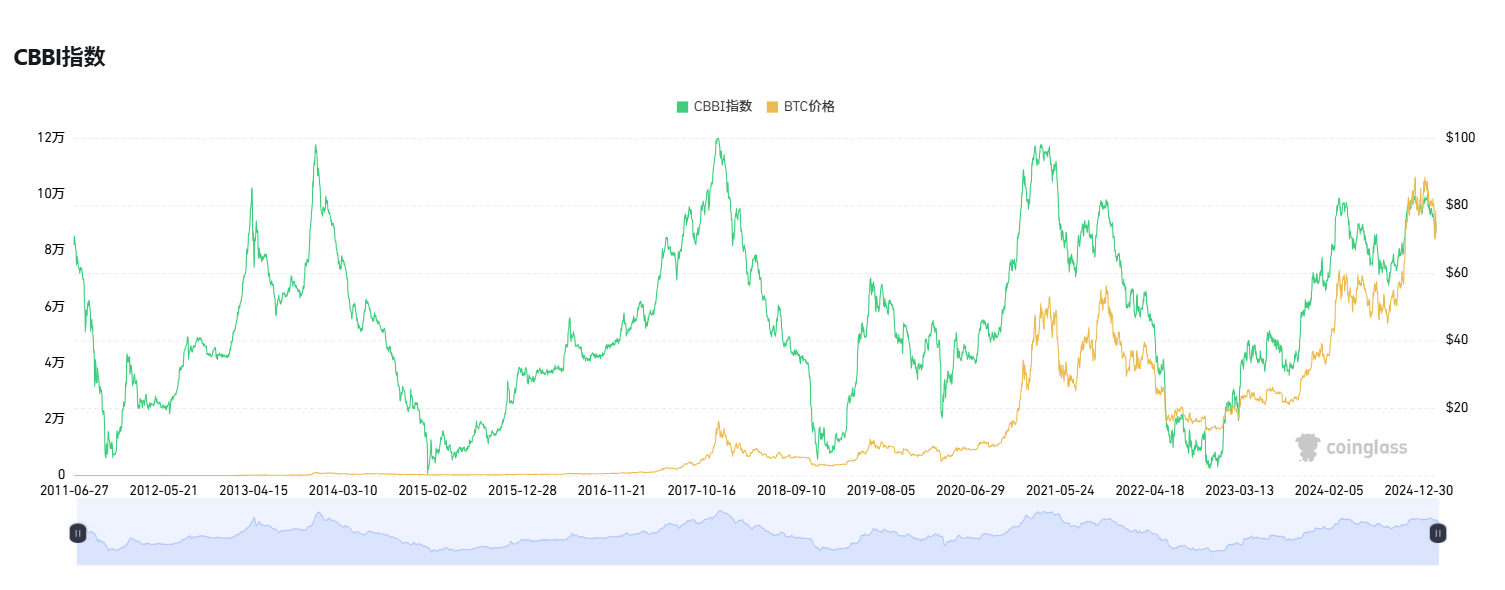
CBBI Index (Crypto Bubble Index)
-
Definition: A composite Bitcoin market cycle indicator combining Mayer Multiple, stock-to-flow ratio, 200-week MA, Pi Cycle Top Indicator, Golden Ratio Multiplier, 2-year MA Multiplier, general valuation metrics, and logarithmic growth curve. Helps investors more accurately identify the current phase of the Bitcoin market cycle.
-
Threshold: ≥ 90 may indicate a top.
-
Current Value: 73
-
Assessment: Approaching but not reaching threshold—shows rising heat but not overheating. Bull market continues.
-
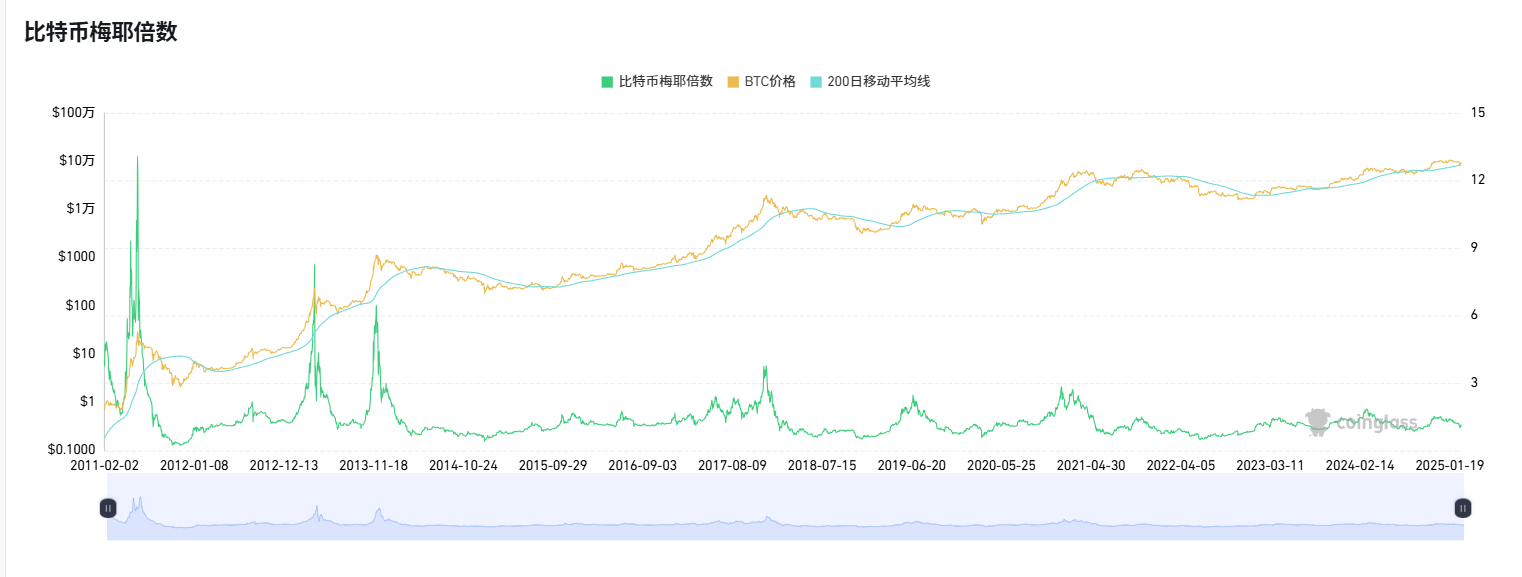
Bitcoin Mayer Multiple
-
Definition: A technical indicator created by Trace Mayer that evaluates market conditions by comparing current price to the 200-day moving average. Its unique strength lies in quickly reflecting market valuation levels, making it a key tool for identifying Bitcoin’s bull/bear cycles. Mayer Multiple = Current Price / 200-Day MA.
-
Threshold: ≥ 2.2 may signal a top.
-
Current Value: 1.05
-
Assessment: Far below threshold, not overheated. Indicator confirms ongoing bull market.
Bonus: One-chart overview of bull market top indicators:
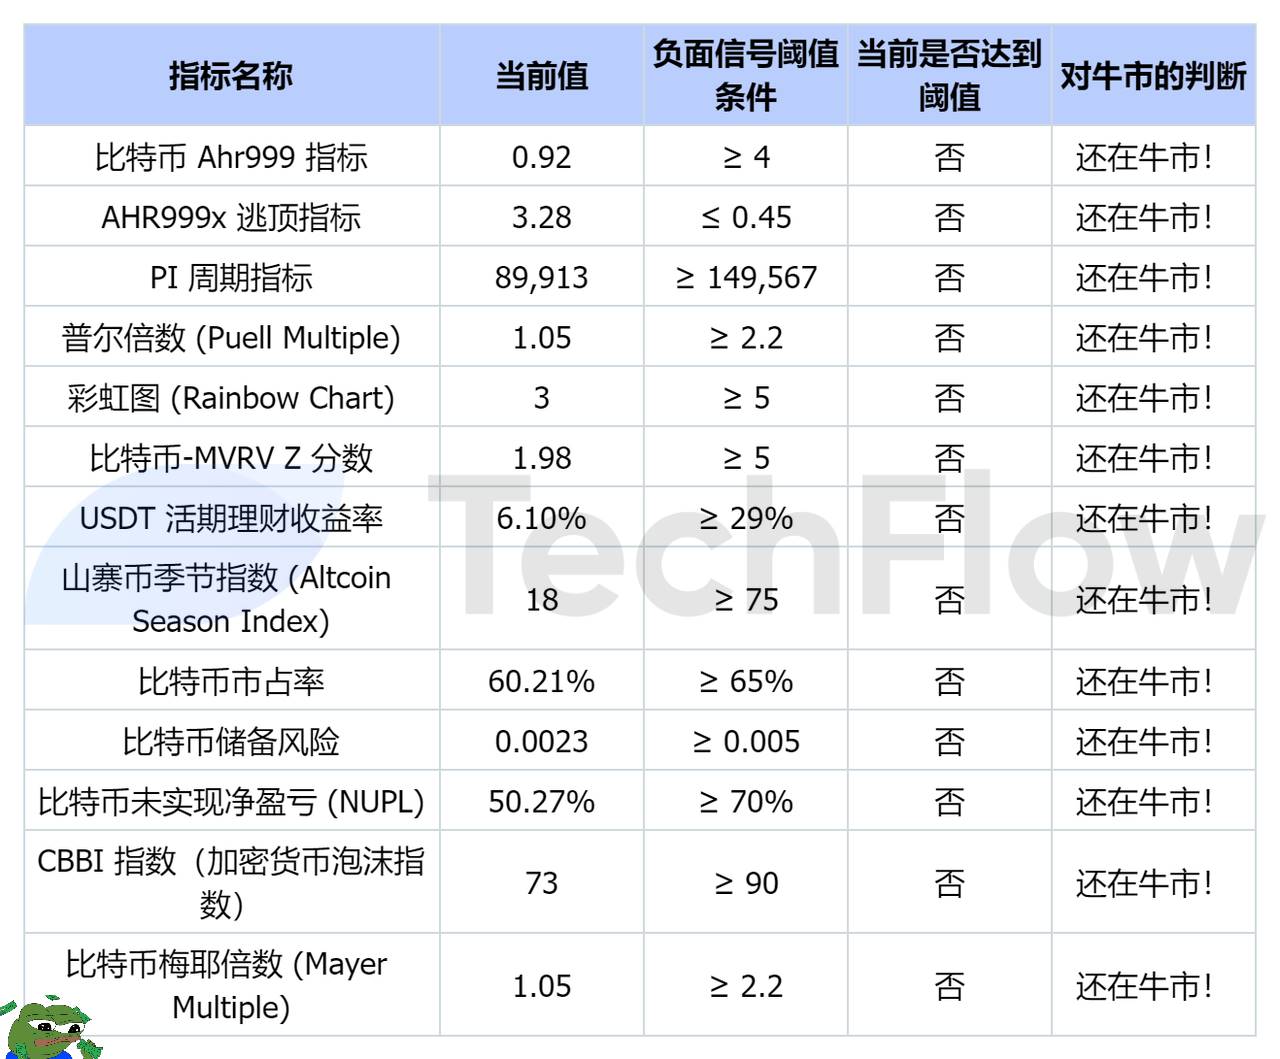
Signals Point to Bull, But Execution Requires Caution
Taken together, the indicators confirm Bitcoin remains in a bull market phase. A single metric might lack reliability, but when multiple indicators converge on “bull market still alive,” it offers some much-needed reassurance amid volatile sentiment.
In practice, the most sensible approach may be gradually dollar-cost averaging into Bitcoin based on indicators and market sentiment. After all, given the past year’s dynamics, this bull cycle is no longer a simple rising tide lifting all boats. Players aren’t passing the baton smoothly, narratives remain concentrated among a few leaders, and the pattern of “popular coins not falling with Bitcoin, obscure coins not rising with Bitcoin” has become increasingly common. Black swan events have also occurred with surprising frequency over short periods. As such, relying solely on indicators or others’ advice may no longer be “foolproof.”
Staying attuned to market rhythms and adapting flexibly to daily changes is the survival skill for this unusual bull market.
Join TechFlow official community to stay tuned
Telegram:https://t.me/TechFlowDaily
X (Twitter):https://x.com/TechFlowPost
X (Twitter) EN:https://x.com/BlockFlow_News