

Sifting Gold from Sand: Finding Long-Term Investment Opportunities That Weather Bull and Bear Markets (I)
TechFlow Selected TechFlow Selected
Sifting Gold from Sand: Finding Long-Term Investment Opportunities That Weather Bull and Bear Markets (I)
Even in a "copycat bear market," betting on projects with strong fundamentals can generate alpha returns that outperform BTC and ETH.
Introduction: Even in a Bear Market for Altcoins, Fundamental Investing Still Works
Undoubtedly, this bull market cycle has been the weakest ever for altcoins.
Unlike previous major bull markets—where active price performance across various altcoins typically caused BTC’s market dominance to drop sharply—since the market bottomed in November 2022, BTC’s dominance has steadily risen from around 38%, now firmly above 61%. This is especially striking given the rapid expansion of altcoin offerings during this cycle, underscoring just how weak altcoin prices have been.
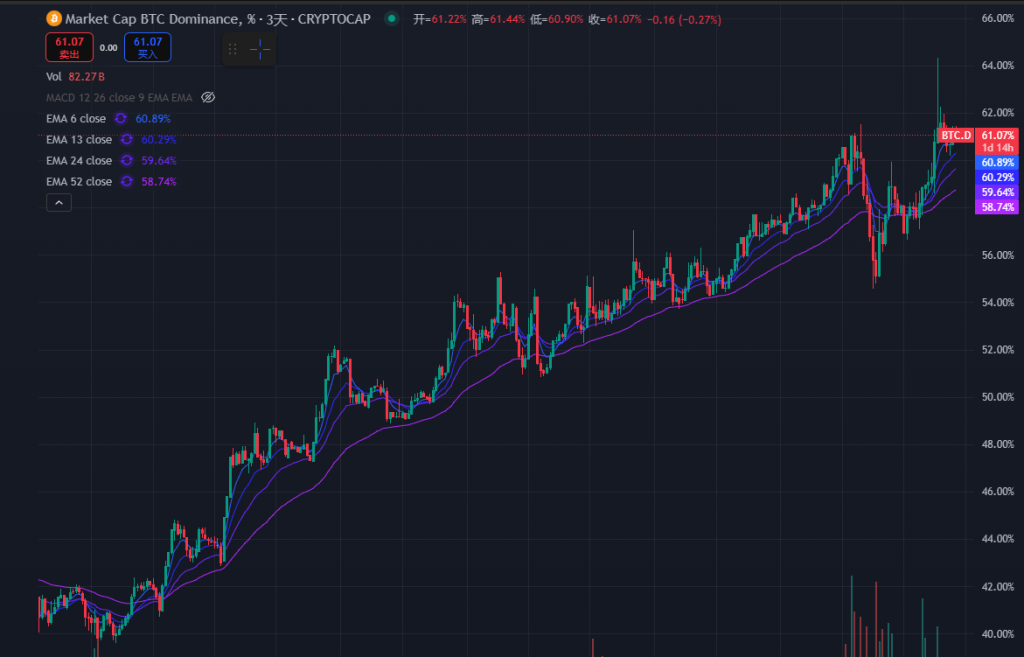
BTC Dominance Chart, Source: Tradingview
The current market phase largely validates the analysis Mint Ventures laid out in our March 2024 article “Preparing for the Primary Bull Wave: My Cyclical Strategy for This Bull Market”. In that piece, we argued:
-
Among the four key catalysts driving this bull market, three are present and one is missing:
-
BTC Halving (expectations of supply-demand adjustment), √
-
Monetary policy easing or expectations thereof, √
-
Regulatory easing, √
-
Innovative new asset or business models, ×
-
Therefore, investors should temper their expectations for last cycle’s altcoins—including smart contract platforms (L1/L2), gaming, DePIN, NFTs, and DeFi—and our recommended strategy for this bull market was:
-
Increase allocation ratios to BTC and ETH (with stronger conviction on BTC as a long-term holding)
-
Limit exposure to altcoins in DeFi, GameFi, DePIN, and NFTs
-
Focus on new sectors and projects to capture alpha, including: Memes, AI, and the BTC ecosystem
Since publication, the validity of these strategies has been largely confirmed (except for underperformance in the BTC ecosystem).
However, it's worth noting that despite most altcoin projects showing lackluster price performance, a few have clearly outperformed both BTC and ETH over the past year. The most notable examples are Aave and Raydium—two projects highlighted in Mint Ventures’ July 2024 report “Altcoins Keep Falling: It’s Time to Re-focus on DeFi”, published when altcoin sentiment was at its lowest.
Starting from early July last year, Aave achieved a peak gain of over 215% against BTC and 354% against ETH. Even after significant pullbacks, Aave still shows a 77% gain versus BTC and 251% versus ETH.
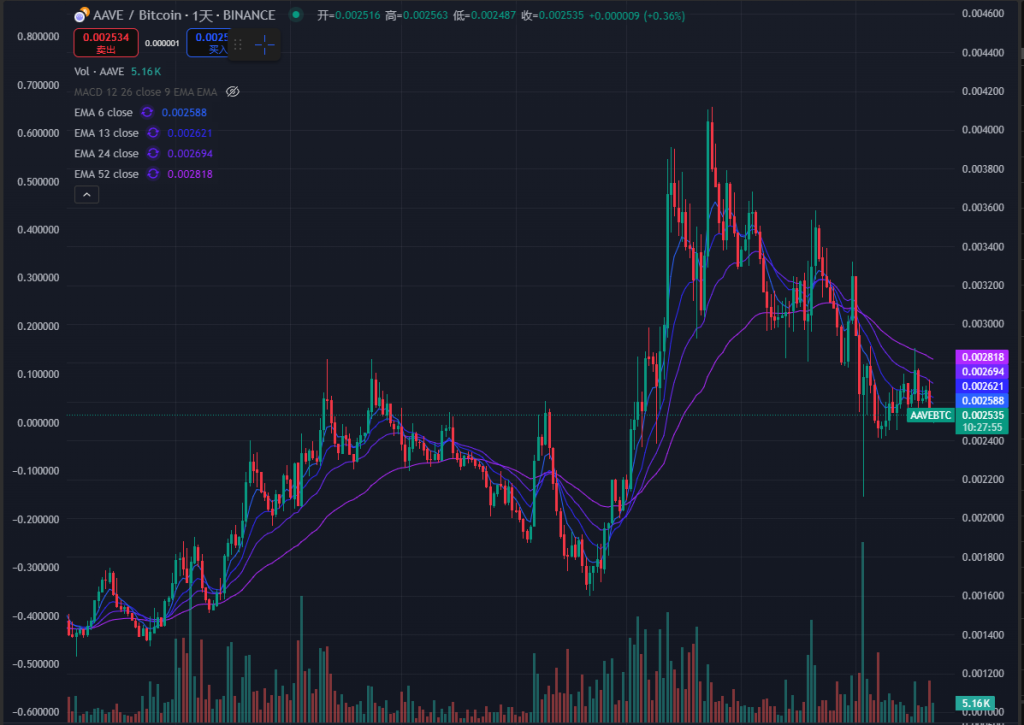
Aave/BTC Exchange Rate, Source: Tradingview
Similarly, starting from early July last year, Raydium achieved a peak gain of over 200% against BTC and 324% against ETH. Despite Solana’s overall downturn and negative impacts from Pump.fun launching its own DEX, Raydium still maintains positive returns against BTC and significantly outperforms ETH.

Ray/BTC Exchange Rate, Source: Tradingview
Given that BTC and ETH (especially BTC) have vastly outperformed most altcoins this cycle, Aave and Raydium stand out even more within the altcoin universe.
This outperformance stems from superior fundamentals compared to most other altcoin projects. Their core business metrics hit record highs during this cycle, they possess unique moats, and maintain stable or rapidly expanding market share.
Even in an “altcoin bear market,” betting on fundamentally strong projects can yield alpha exceeding BTC and ETH—this is precisely the goal of our research efforts.
In this report, Mint Ventures identifies high-quality crypto projects with solid fundamentals from among thousands of listed tokens, tracking their recent business performance and market share, analyzing competitive advantages, assessing risks and challenges, and offering valuation references.
Important disclaimers:
-
Projects mentioned in this article may have strengths and appeal in certain aspects, but also face various issues and challenges. Different readers may reach entirely different conclusions about the same project after reading this report.
-
Projects not covered here do NOT imply poor fundamentals or lack of our endorsement. We welcome reader recommendations and rationale.
-
This article reflects the authors' views as of publication and may change over time. Opinions are highly subjective and may contain factual, data, or logical errors. All views expressed herein are NOT investment advice. We welcome feedback and further discussion from peers and readers.
We will analyze each project through dimensions such as business status, competitive landscape, key challenges and risks, and valuation. Below is the main body of the report.
I. Lending Sector: Aave, Morpho, Kamino, MakerDAO
DeFi remains the best product-market fit (PMF) sector in the crypto economy, and lending is one of its most important sub-sectors—featuring mature user demand and stable revenue. This space hosts numerous high-quality legacy and emerging projects, each with distinct strengths and weaknesses.
For lending protocols, the most critical metrics are loan volume (Active Loans) and protocol revenue, along with evaluating expenditure—specifically token incentives.
1.1 Aave: The King of Lending
Aave is one of the few projects to survive three crypto cycles while maintaining stable growth. It raised funds via ICO back in 2017 (then called Lend, operating a peer-to-peer model) and surpassed Compound—the former lending leader—in the last cycle, remaining the top lending protocol by volume. Aave currently operates across most major EVM L1s and L2s.
Business Status
Aave’s primary business model involves operating a pool-based lending platform, earning interest spreads and liquidation penalties from collateralized loans. Additionally, Aave’s stablecoin GHO—now in its second year—generates direct interest income for the protocol.
Loan Volume (Active Loans)
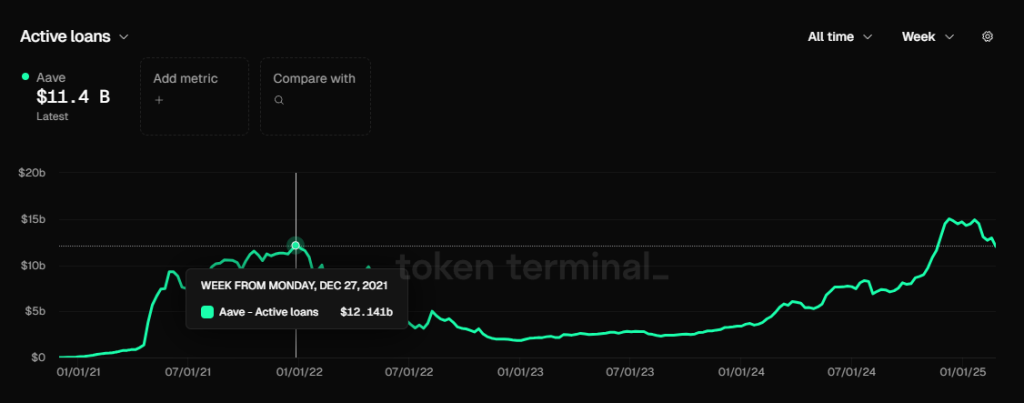
Aave Loan Volume, Data Source: Token Terminal
Aave’s loan volume has exceeded its previous peak of $12.14 billion (November 2021) since last November. Its all-time high reached $15.02 billion in late January 2025. Recently, as market activity cooled, loan volume has pulled back to approximately $11.4 billion.
Protocol Revenue
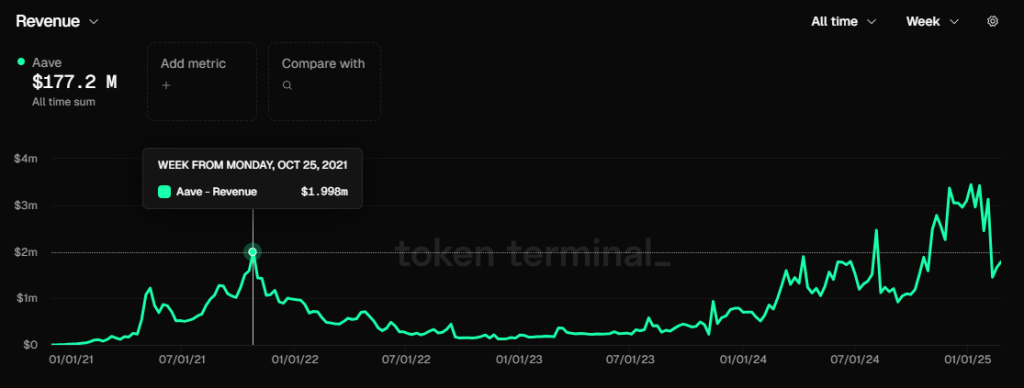
Aave Protocol Revenue, Data Source: Token Terminal
Similar to loan volume, Aave’s protocol revenue has consistently surpassed its October 2021 high since November 2023. Over the past three months, weekly protocol revenue mostly remained above $3 million (excluding GHO interest income). However, due to declining market enthusiasm and lower interest rates, recent weekly revenue has fallen to the $2+ million range.
Token Incentives
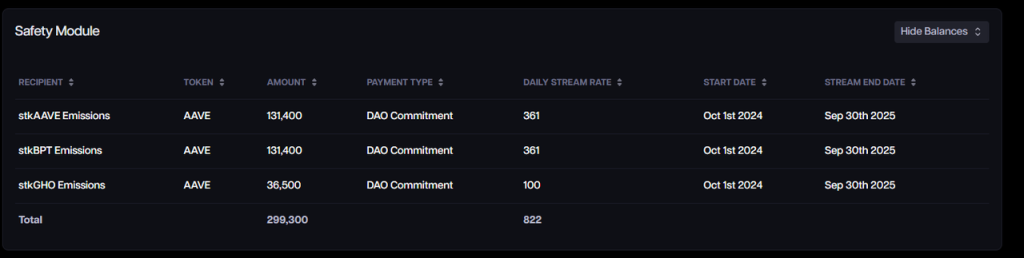
Aave Token Incentive Spending, Data Source: Aave Analytics
Aave continues to spend substantial amounts on token incentives—currently distributing 822 AAVE tokens daily. At a price of $245 per AAVE, this equates to roughly $200,000 per day. This relatively high incentive value is partly due to the significant price appreciation of AAVE over the past six months.
However, unlike most protocols that directly incentivize user deposit/borrow behaviors, Aave uses its token incentives primarily to fund safety modules (deposit insurance). Therefore, Aave’s core lending activity is driven by organic demand rather than artificial stimulus.
That said, in our view, the scale of Aave’s safety module incentives remains excessive and could be reduced by at least half. With the upcoming launch of Aave’s new economic model—particularly the new Umbrella safety module—AAVE tokens will no longer be used for these incentives.
For more details on Aave’s updated economics, see Mint Ventures’ previous article: “Buybacks, Dividends, and Safety Module Upgrade: Deep Dive into Aave’s New Economic Model.”
Competitive Landscape
From a loan volume perspective (EVM chains), Aave has maintained a stable market share, holding the #1 position since June 2021. In late 2023, its share briefly dipped below 50%, but since 2024 it has regained momentum and now stabilizes around 65%.
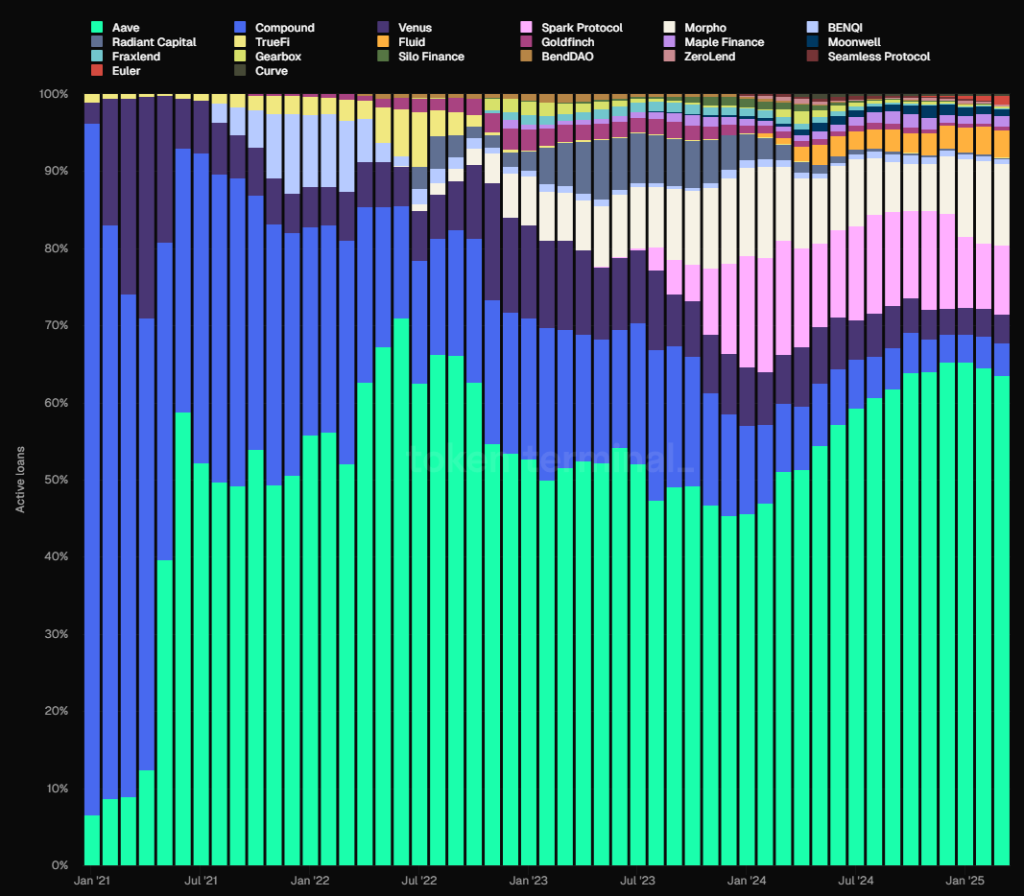
Data Source: Token Terminal
Aave’s Competitive Advantages
Since our July 2024 analysis, Aave’s core competitive advantages have remained largely unchanged, stemming from four key areas:
1. Accumulated Security Reputation: Most new lending protocols suffer security incidents within their first year. Aave, however, has operated without any smart contract-level security breaches to date. This track record of safe, uninterrupted operation is often the top consideration for DeFi users—especially large whales like Justin Sun, who is a long-time Aave user.
2. Two-sided Network Effects: Like many internet platforms, DeFi lending is a classic two-sided market where depositors and borrowers feed each other. Growth on one side stimulates demand on the other, creating a compounding advantage that makes it harder for new entrants to catch up. Moreover, greater liquidity leads to smoother entry/exit for large capital pools, attracting more institutional-sized users, which further fuels growth.
3. Strong DAO Governance: Aave is fully managed via DAO, offering greater transparency and community-driven decision-making compared to centralized teams. Aave DAO includes a diverse set of active participants—top-tier VCs, university blockchain clubs, market makers, risk management firms, third-party developers, and financial advisors—all contributing to robust governance. Aave’s success in overtaking Compound—despite entering later as a pool-based lender—can be attributed in large part to effective DAO governance balancing innovation and security.
4. Multi-chain Ecosystem Presence: Aave is deployed on nearly every major EVM L1/L2 and ranks near the top in TVL across most chains. With the upcoming Aave V4, cross-chain liquidity will be unified, amplifying its multi-chain advantage. Future expansions include non-EVM chains like Aptos and Linea, as well as a return to Sonic (formerly Fantom).
Key Challenges and Risks
While Aave’s market share has been steadily rising over the past year, the rapid growth of Morpho cannot be ignored.
Unlike Aave, where assets, risk parameters, and oracles are centrally governed by Aave DAO, Morpho adopts a more open approach: providing a permissionless lending base layer allowing anyone to create independent markets with custom collateral, risk settings, and oracles. It also introduces vaults (similar to yield funds) managed by professional third parties like Gauntlet. Users deposit funds into vaults, and managers allocate them to optimal lending markets based on risk-return assessments.
This modular design enables faster entry into niche or emerging lending markets. For example, newer stablecoin projects like Usual and Resolv have built markets on Morpho, enabling users to leverage looped lending for yield farming or points accumulation.
We’ll explore Morpho in detail later.
Beyond competition from Ethereum-native protocols, Aave’s growth is also constrained by the broader rivalry between Ethereum and high-performance L1s. If ecosystems like Solana continue gaining ground at Ethereum’s expense, Aave’s heavy reliance on Ethereum could cap its upside potential.
Additionally, the cyclical nature of crypto markets directly impacts Aave’s user demand. During bear markets, speculation and arbitrage opportunities shrink, leading to sharp declines in lending volume and revenue—a common challenge across all lending protocols, which we won’t reiterate further.
Valuation Reference
On a historical basis, Aave’s current PS ratio (fully diluted market cap to protocol revenue) stands at 28.23—within the median range over the past year and far below the triple-digit PS levels seen during 2021–2023 peaks.
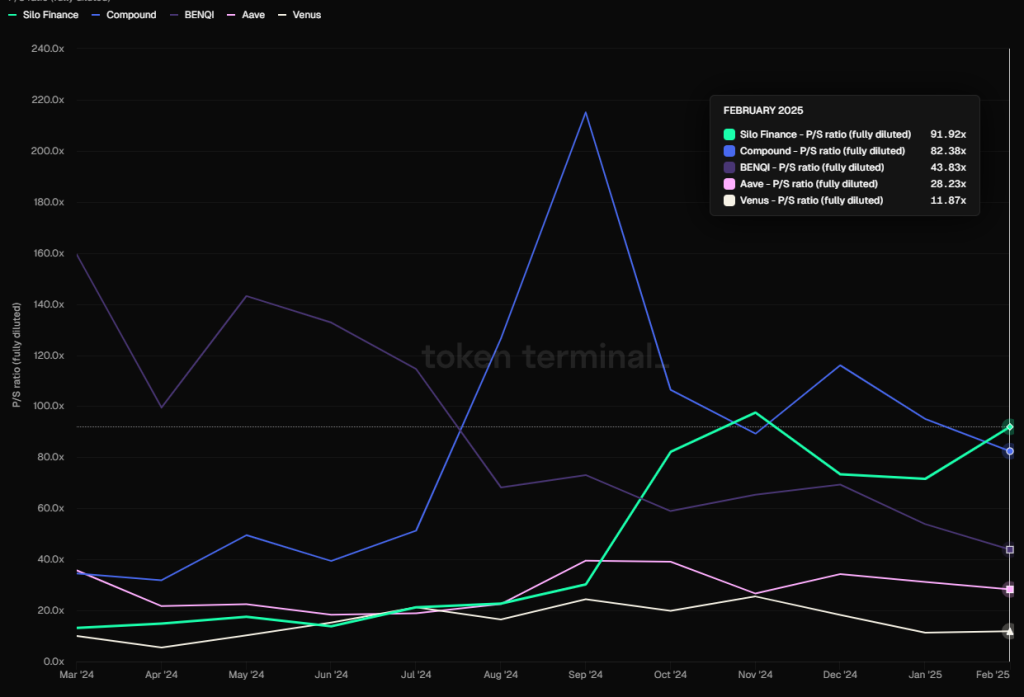
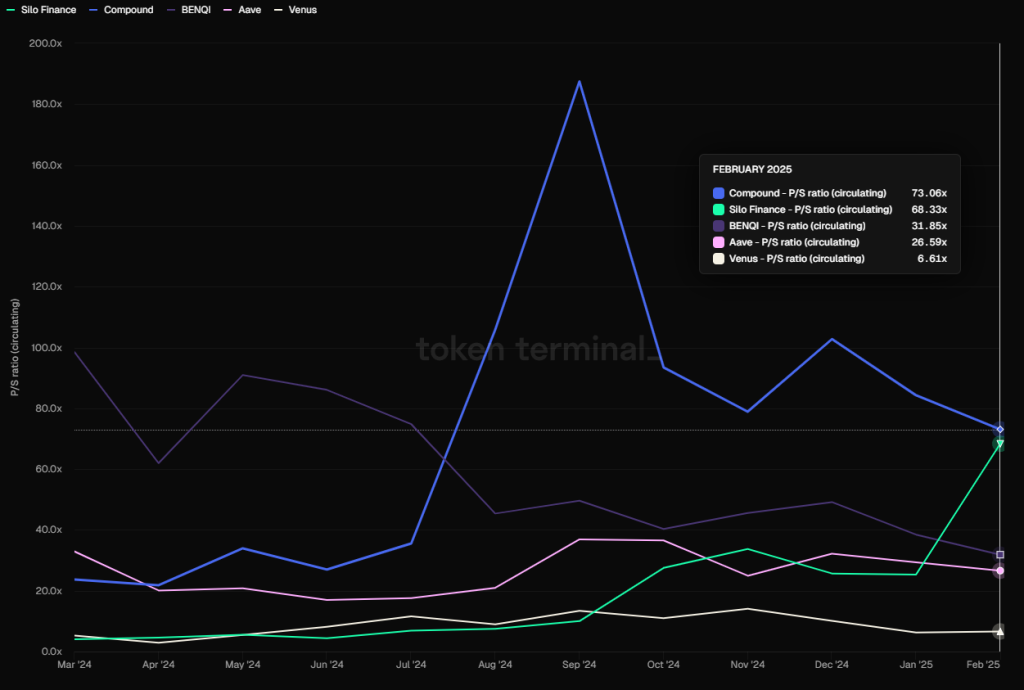
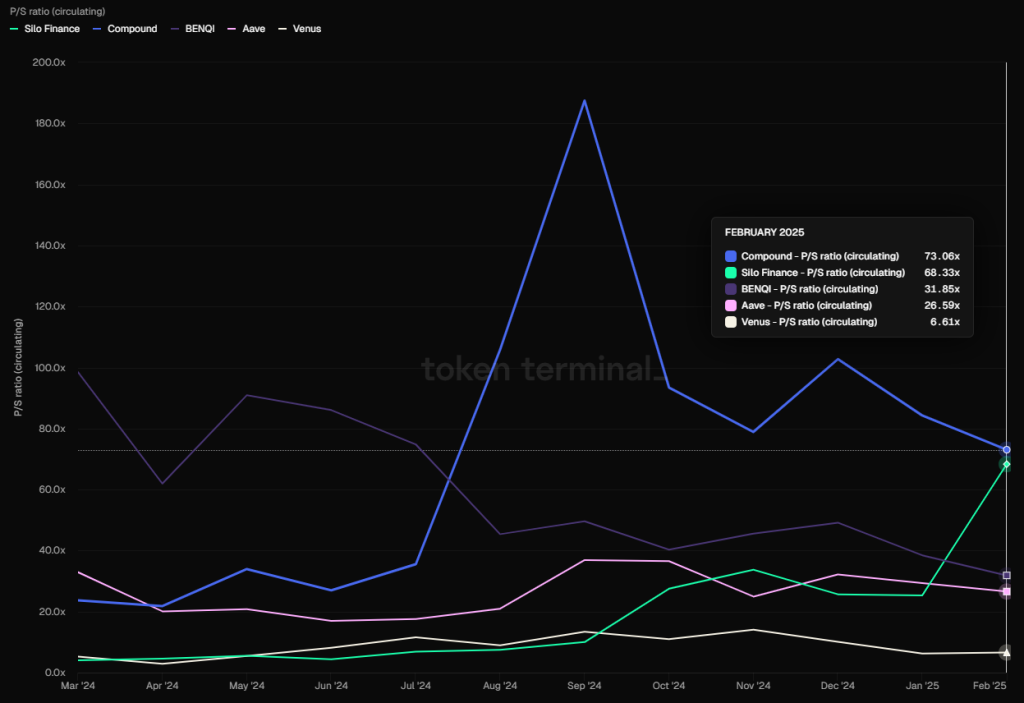
PS Ratios of Major Lending Protocols (FDV-based), Data Source: Token Terminal
Compared horizontally, Aave’s PS is much lower than Compound, Silo, and Benqi, but higher than Venus.
However, it’s important to note that DeFi, like traditional finance, exhibits strong cyclicality—PS ratios tend to compress during bull markets and expand during bear markets.
1.2 Morpho: The Rising Challenger
Morpho began as a yield optimizer built atop Compound and Aave, but in 2024 launched Morpho Blue—an open, permissionless lending infrastructure—directly competing with leaders like Aave. Since launch, Morpho Blue has grown rapidly and gained favor among new projects and novel assets. Morpho currently operates on Ethereum and Base.
Business Status
Morpho offers multiple products:
1. Morpho Optimizers
Morpho’s original product aimed to improve capital efficiency on existing DeFi lending platforms (e.g., Aave and Compound) by matching lenders and borrowers peer-to-peer while retaining underlying yield. This initial product helped Morpho accumulate users and capital, avoiding cold-start problems when launching Morpho Blue.
Although still holding significant capital, the optimizer’s yield enhancement has dropped to negligible levels (~0.07%) and is no longer a focus. Deposits and borrows were disabled starting December 2023.
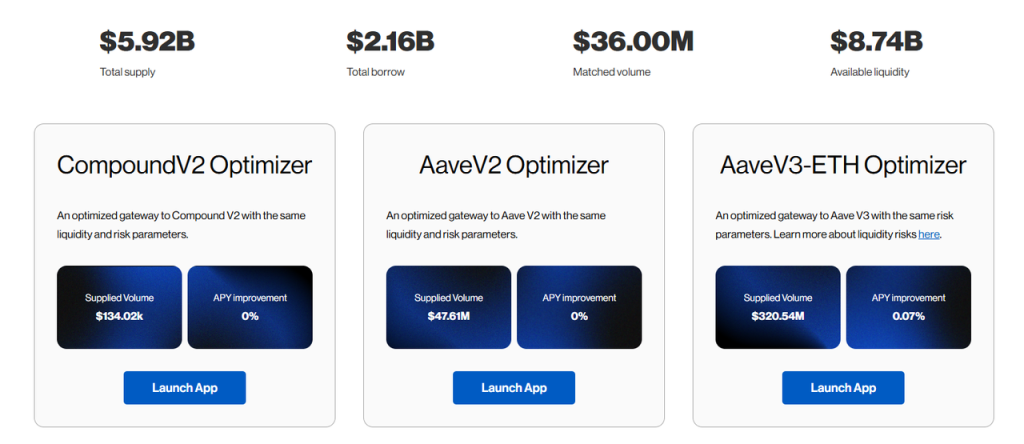
Due to extremely low match rates, current yield optimization is only ~0.07%, Source: https://optimizers.morpho.org/
2. Morpho Blue (or simply Morpho)
Morpho Blue is a permissionless lending base layer allowing users to create customized lending markets. Creators can freely choose collateral types, loan assets, liquidation thresholds (LLTV), oracles, and interest rate models. The design requires no external governance, enabling market creators to manage risk and returns independently to meet specific needs.
Morpho Blue’s rapid growth quickly pressured Aave, prompting Aave to introduce its Merit rewards program—rewarding exclusive Aave users while penalizing those using Morpho.
Before Morpho Blue, isolated lending markets for niche or new assets (e.g., Euler, Silo) generally failed. Most capital flowed through centralized platforms like Aave, Compound, and Spark that focused on blue-chip collateral.
Morpho Blue, however, appears to have cracked the code, succeeding due to several factors:
- Strong security track record: Prior to Morpho Blue, Morpho Optimizers managed large sums without incident, building solid brand trust.
- Open architecture: By decentralizing control over supported assets, risk parameters, oracles, and vault management, Morpho achieves greater flexibility:
- Enables faster response to market demands. New asset issuers proactively build markets on Morpho; specialized risk firms like Gauntlet launch managed vaults, earning performance fees instead of relying solely on service contracts with large protocols.
- Facilitates deeper specialization—participants focus on their expertise. This free-market competition enriches product diversity and reduces operational costs (e.g., frequent upgrades, audits, dedicated risk services).
3. MetaMorpho Vaults
MetaMorpho Vaults are asset management tools designed to simplify lending and provide yield opportunities. Users deposit funds into professionally managed vaults optimized for specific risk-return profiles. Currently, vault capital is primarily allocated to lending markets built on Morpho Blue.
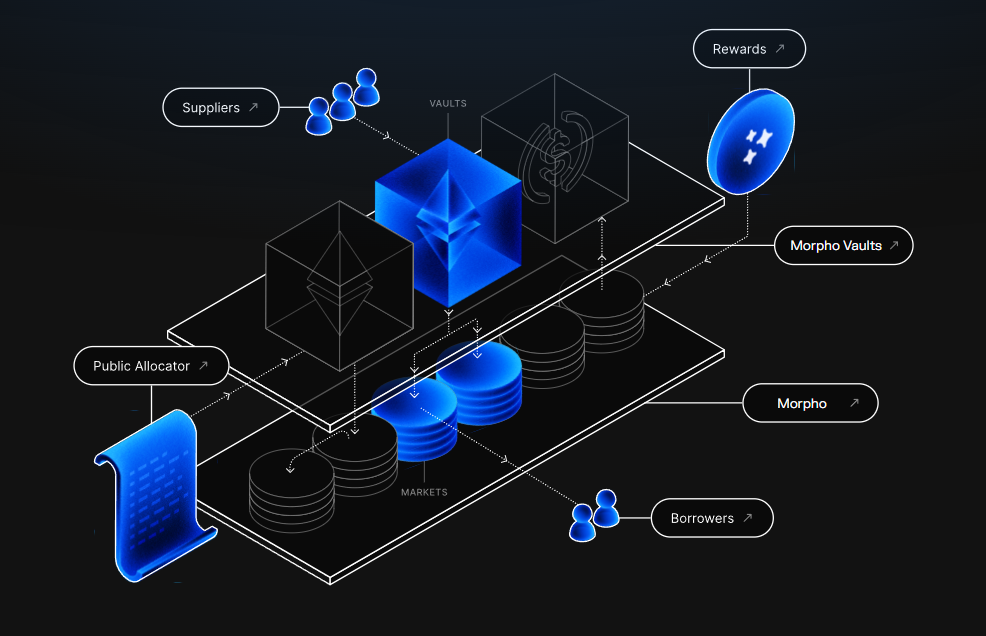
Morpho Product Architecture
With this overview of Morpho’s products, let’s examine its key business metrics.
Loan Volume (Active Loans)
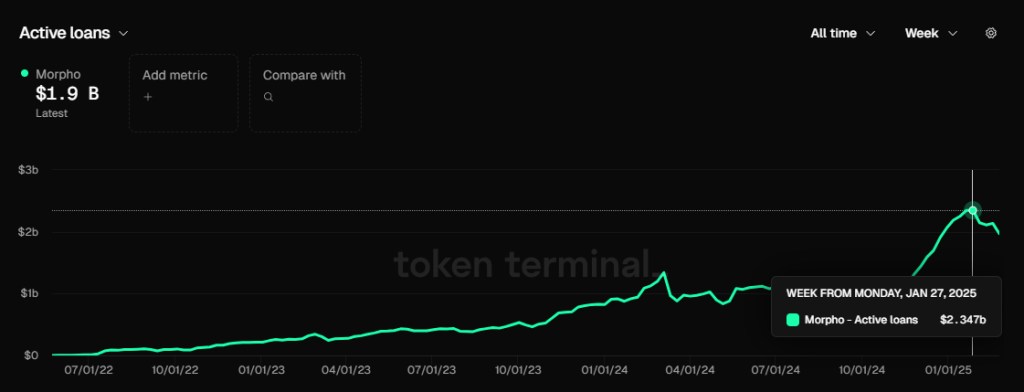
Morpho Loan Volume, Data Source: Token Terminal
Morpho’s peak loan volume, similar to Aave, occurred in late January—reaching $2.35 billion—and currently stands at $1.9 billion.
Morpho has not yet activated protocol fees, so it generates no protocol revenue. However, we can estimate future revenue potential by analyzing Fee—the total interest paid to depositors.

Morpho vs. Aave Fee Comparison, Data Source: Token Terminal
In February 2025, Aave generated $67.12 million in Fees, while Morpho generated $15.59 million.
During the same period, Aave converted $8.57 million of its $67.12 million in Fees into protocol revenue—a retention rate of approximately 12.8% (rough calculation).
As a self-operated lending protocol, Aave retains all income after covering operational costs.
Morpho, however, serves as infrastructure for a broader ecosystem involving third parties—market creators, vault operators, etc. Even if protocol fees are enabled, Morpho’s revenue share will likely be significantly lower than Aave’s due to revenue sharing. We estimate Morpho’s effective fee retention rate at 30%–50% of Aave’s—approximately 3.84%–6.4%.
Applying this (3.84%–6.4%) × $15.59 million, we estimate Morpho’s potential monthly protocol revenue at $598.7k–$997.8k—if fees were enabled—about 7%–11.6% of Aave’s revenue.
Token Incentives
Morpho uses its native MORPHO token to incentivize user behavior—directly rewarding deposits and borrows—unlike Aave, which incentivizes safety modules. As such, Morpho’s core business metrics are less organically driven.
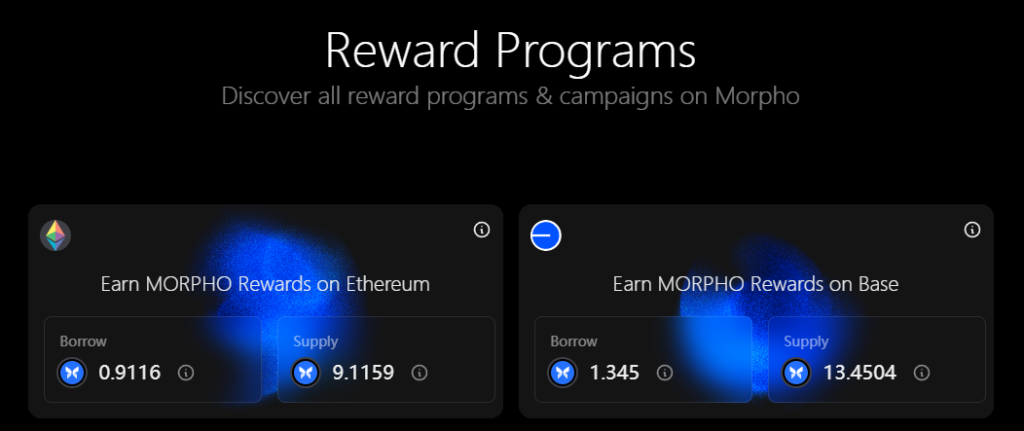
Morpho Incentive Dashboard, Source: https://rewards.morpho.org/
According to Morpho’s dashboard, aggregate subsidy rates are ~0.2% for borrowing and ~2% for deposits on Ethereum; on Base, ~0.29% for borrowing and ~3% for deposits.
However, Morpho frequently adjusts these incentives. Since December, the community has passed three proposals gradually reducing deposit/borrow subsidies.
The latest adjustment on February 21 reduced reward allocations by 25% on both Ethereum and Base, resulting in annual distributions of:
Ethereum: 11,730,934.98 MORPHO/year
Base: 3,185,016.06 MORPHO/year
Total: 14,915,951.04 MORPHO/year
At today’s ($3.3) price, this implies an annual incentive budget of $31.92 million—quite substantial relative to current protocol scale and fee generation.
Nonetheless, further reductions are expected, potentially leading to full subsidy elimination.
Competitive Landscape
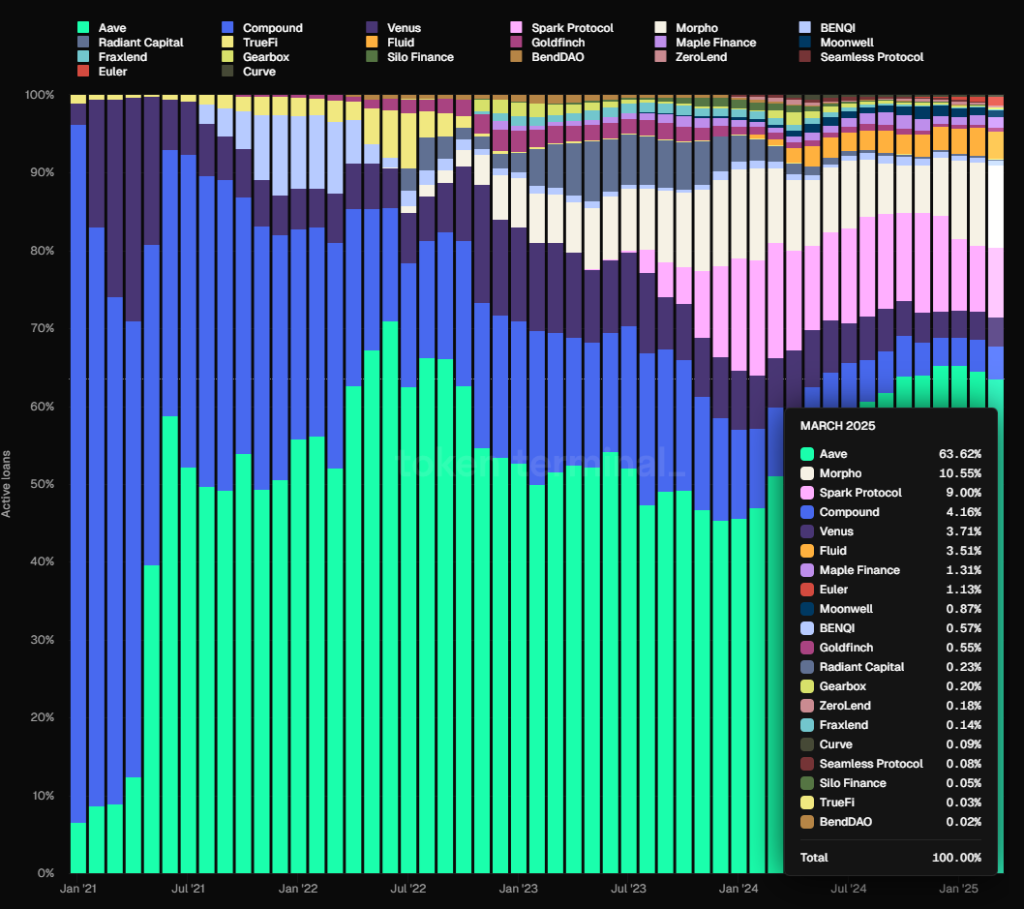
Data Source: Token Terminal
By total loan market share, Morpho holds 10.55%—slightly above Spark—but remains far behind Aave. It occupies the second tier in the lending market.
Morpho’s Competitive Advantages
Morpho’s moat stems from two key areas:
1. Solid Security Track Record: Though not the earliest player, Morpho has nearly three years of operational history (counting from its optimizer launch) without major security incidents—building strong reputation and user trust, evidenced by growing capital inflows.
2. Focus on Lending Infrastructure: As previously analyzed, this approach attracts more ecosystem participants, expands market choices, enhances specialization, and lowers operational costs.
Key Challenges and Risks
Beyond general competition and ecosystem dynamics (Ethereum vs. Solana), Morpho faces significant token unlock pressure over the next year.
According to tokenomist, upcoming unlocks represent 98.43% of currently circulating supply—implying nearly 100% inflation over the next 12 months. Most unlocked tokens go to early strategic investors, contributors, and Morpho DAO. This massive sell-side pressure could weigh heavily on token price.
Valuation Reference
Although Morpho hasn’t enabled protocol fees, our earlier estimation suggests potential monthly revenue of $598.7k–$997.8k based on February fee generation.
Using today’s (March 3) FDV of $2.138 billion (Coingecko), this implies a PS ratio of 178–297—significantly higher than other major lending protocols.
PS Ratios of Major Lending Protocols (FDV-based), Data Source: Token Terminal
However, using market cap instead, Morpho’s current MC is $481.36 million (Coingecko), yielding a PS of 40.2–67—not excessively expensive compared to peers.
PS Ratios of Major Lending Protocols (MC-based), Data Source: Token Terminal
Still, FDV provides a more conservative valuation benchmark.
1.3 Kamino: Solana’s Top Player
Kamino Finance is a comprehensive DeFi protocol on Solana, founded in 2022. Initially launched as an automated concentrated liquidity manager, it now integrates lending, liquidity, leverage, and trading. Lending remains its core business and primary revenue source. Kamino charges multiple fees: interest revenue share, origination fees on borrowing, liquidation fees, plus deposit/withdrawal and performance fees from liquidity management.
Business Status
Loan Volume (Active Loans)
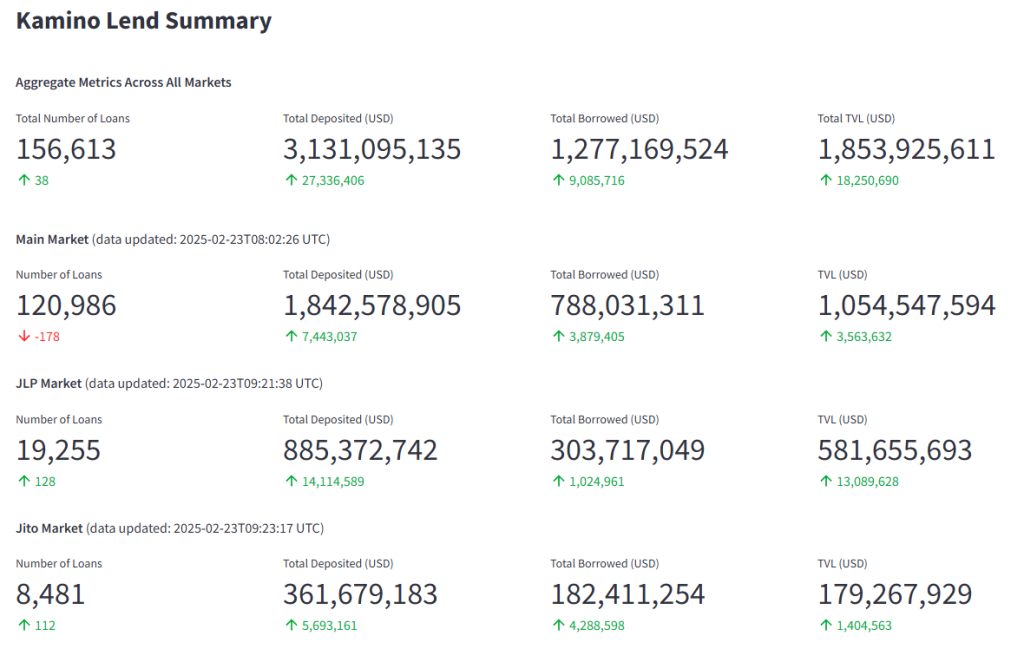
Kamino Key Metrics, Data Source: https://risk.kamino.finance/
Kamino’s current loan volume is $1.27 billion, peaking at $1.538 billion in late January 2025.
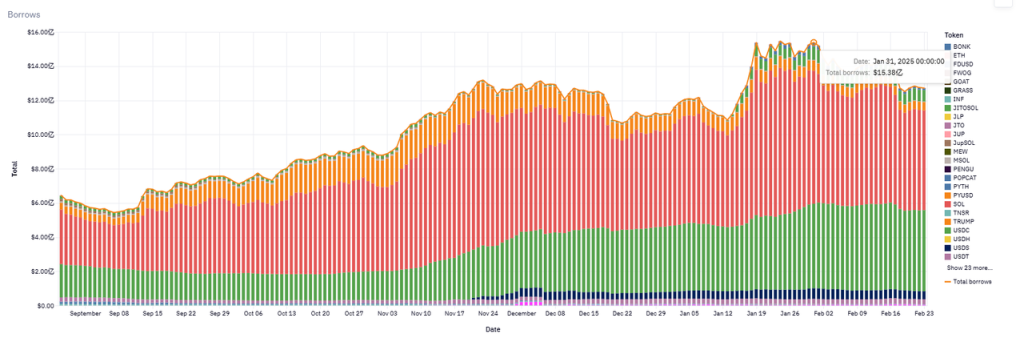
Kamino Borrowing Volume Trend, Data Source: https://allez.xyz/kamino
Protocol Revenue
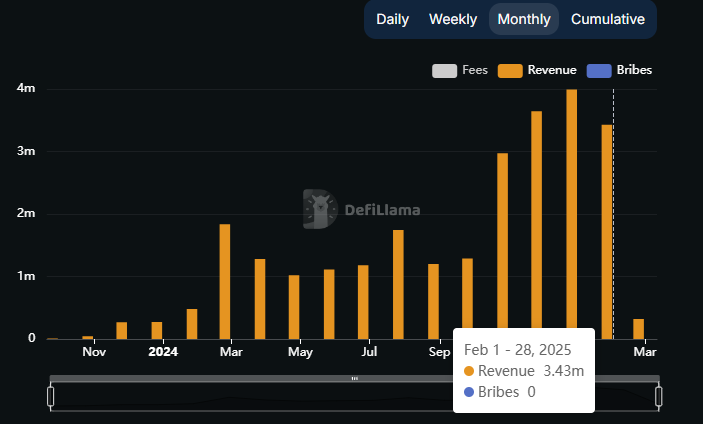
Kamino Total Protocol Revenue, Source: DefiLlama
January marked Kamino’s highest revenue month at $3.99 million. February was also strong at $3.43 million.
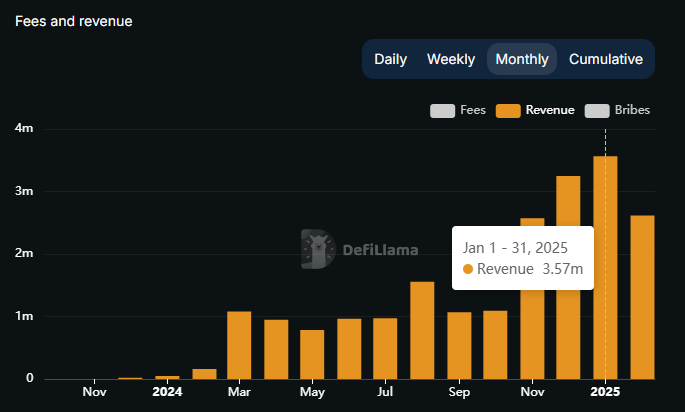
Kamino Revenue from Lending, Source: DefiLlama
Lending accounts for most of Kamino’s revenue—89.5% in January.
Token Incentives
Unlike traditional token incentives, Kamino employs a “season-based points system”—users earn points by completing specified actions, then receive a portion of the season’s total token rewards based on their point share.
Season 1 lasted three months and distributed 7.5% of total KMNO supply as genesis airdrop. Season 2 also ran for three months, distributing 3.5%.
At current prices, these two seasons distributed $105 million worth of KMNO tokens. This generous incentive structure has been a key driver of Kamino’s rapid business growth over the past year.
Season 3 is ongoing and has already lasted over six months since August 1, 2024—without slowing growth. If it matches Season 2’s scale, the airdrop value could reach $30–40 million.
Notably, staking KMNO accelerates point accumulation, increasing user stickiness and token holding.
Competitive Landscape
Major Solana lending protocols include Kamino, Solend, and MarginFi:
- Kamino: Holds 70%–75% market share (by loan volume)—even stronger dominance on Solana than Aave on Ethereum.
- Solend: Led in 2022–2023 but slowed in 2024, now below 20% share.
- MarginFi: Suffered a governance crisis in April 2024, triggering mass withdrawals and reducing its share to single digits.
Kamino consistently ranks top two in Solana TVL, behind only Jito (a staking-focused protocol). Its lending TVL far exceeds rivals like Solend and MarginFi.
Kamino’s Competitive Advantages
1. Rapid Product Iteration and Execution: Founded by Hubble team members in 2022, Kamino initially targeted Solana’s first concentrated liquidity market maker. This early product met user demand for automated, yield-optimized liquidity vaults. Building on this, Kamino expanded into lending, leverage, and trading—forming a full-stack DeFi suite. Few一体化 DeFi projects span multiple use cases. The team continues experimenting with new verticals.
2. Strong Ecosystem Integration: Kamino actively builds partnerships within and beyond Solana. Notable integrations include PayPal’s PYUSD—Kamino was the first Solana protocol to support PYUSD lending, capturing dominant market share. It also partnered with staking leader Jito to launch leveraged JitoSOL products, attracting SOL stakers. Upcoming Lend V2 plans include orderbook lending, RWA support, and modular APIs—deepening integration into Solana’s financial infrastructure. The more protocols build on Kamino, the more capital flows in, strengthening its defensibility.
3. Scale and Network Effects: DeFi lending exhibits strong “winner-takes-more” dynamics. Kamino’s 2024 surge exemplifies this. High TVL and liquidity mean safer, lower-slippage borrowing—boosting confidence among large players. Size itself becomes a barrier: capital flows toward the deepest liquidity, reinforcing scale. Kamino benefits from this virtuous cycle.
4. Strong Risk Management Record: To date, Kamino has avoided major security incidents or large-scale bad debt—unlike competitors like MarginFi, whose troubles drove users to Kamino.
Key Challenges and Risks
Beyond standard risks like contract security and parameter design, Kamino faces additional concerns:
Tokenomics, Inflation, and Incentive Alignment
Kamino’s points-season model resembles a Ponzi scheme, similar to Ethena. If future airdrops fail to meet expectations, user attrition may follow (though by now, the project has likely achieved its objectives). According to tokenomist, upcoming unlocks imply a 170% inflation rate over the next year. Moreover, all protocol revenue currently flows directly to the team—with none going to treasury or token holders. No signs of decentralized governance exist yet. While acceptable early on, prolonged centralization and lack of transparent financial planning could erode token value.
Solana Ecosystem Trajectory
Though Solana has outperformed Ethereum this cycle, beyond memes, it lacks clear PMF in other sectors. DeFi remains Ethereum’s stronghold. Whether Solana can diversify asset classes and attract sustained capital inflows will critically impact Kamino’s ceiling.
Valuation Reference
Kamino 30-day Protocol Revenue, Data Source: https://allez.xyz/kamino/revenue
Using Kamino’s 30-day average revenue and FDV/MC (from Coingecko), we calculate:
FDV PS = 34, MC PS = 4.7—both relatively low compared to other major lending protocols.
1.4 MakerDAO: Old Tree, New Blossoms?
MakerDAO, established in 2015, is Ethereum’s oldest DeFi protocol—now ten years old. Thanks to first-mover advantage, its stablecoin DAI (and upgraded USDS) remains the largest decentralized stablecoin by market cap.
Revenue-wise, MakerDAO earns from stability fees and interest spreads—similar to lending protocols: users pay fees to generate DAI; suppliers earn yield on sDAI/sUSDS.
Operationally, generating DAI by depositing ETH mirrors borrowing USDC from AAVE using ETH as collateral. In early DeFi analysis, CDP-style stablecoins like MakerDAO were often classified as lending protocols. After rebranding to Sky, MakerDAO spun off Spark—a standalone lending protocol—further justifying its inclusion here.
Business Status
Loan Volume (Active Loans)
For stablecoin protocols, the key metric is stablecoin supply—equivalent to loan volume for lenders.
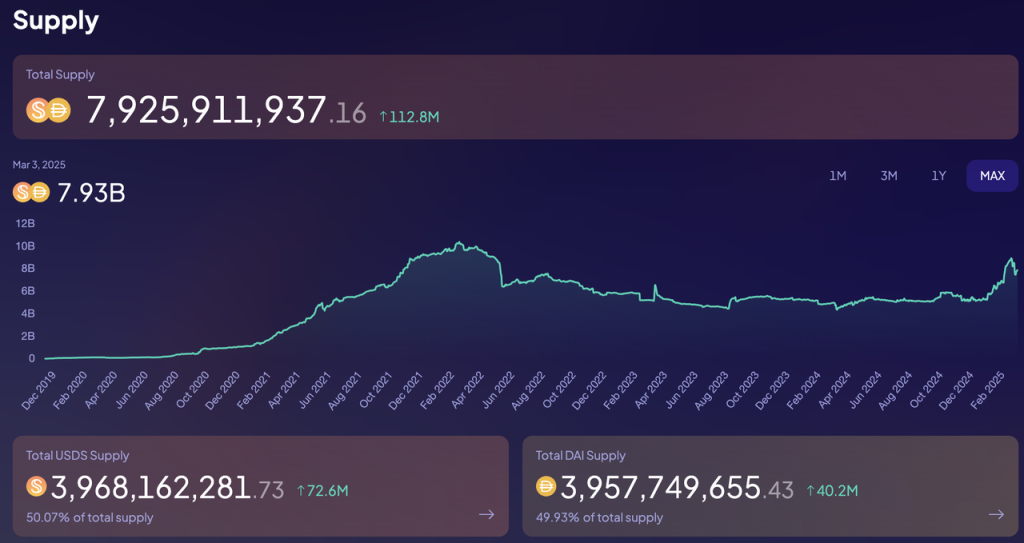
Source: Sky Official Website
MakerDAO’s outstanding DAI supply is nearly $8 billion—still below its prior cycle peak of $10.3 billion.
Spark’s loan volume is around $1.6 billion—higher than Compound, slightly below Morpho.
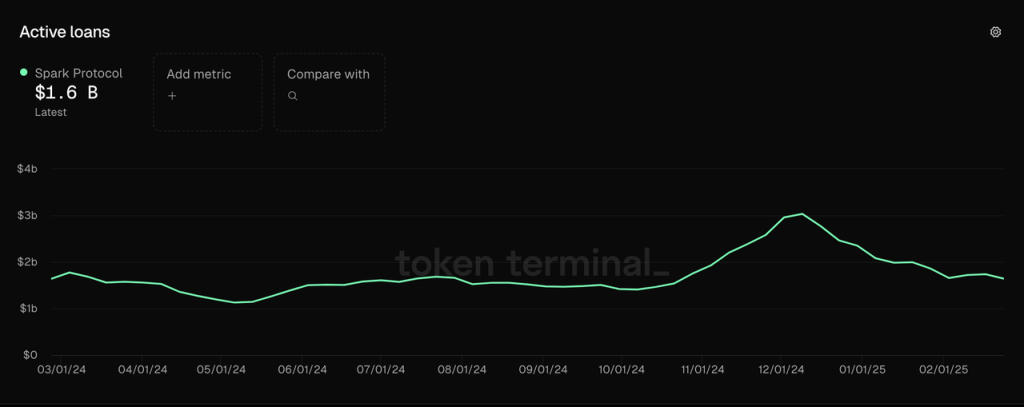
Data Source: Token Terminal
Protocol Revenue
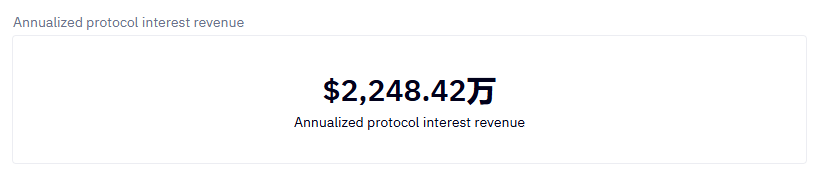
MakerDAO’s equivalent to protocol revenue is total income minus interest paid to sDAI/sUSDS holders. As shown below, stability fees constitute the vast majority—$421 million—while liquidation and price stabilization fees contribute minimally.
Join TechFlow official community to stay tuned Telegram:https://t.me/TechFlowDaily X (Twitter):https://x.com/TechFlowPost X (Twitter) EN:https://x.com/BlockFlow_News


