August could become a major turning point for the crypto market
TechFlow Selected TechFlow Selected
August could become a major turning point for the crypto market
This might be the final low point before a significant rise.
 Navigating Web3 tides with focused insights
Author: Digital Asset Research
Translation: Peisen, BlockBeats
Editor's Note: Digital Asset Research presents strong evidence for a high probability of major events or news occurring between August 6 and August 12, using detailed data across time frames, price ranges, and temporal angles. The article compares the current market cycle with previous cycles, highlights recurring patterns in trend shifts, and provides compelling analysis based on monthly and weekly charts.
This is something I've been publicly discussing for some time now, but today I want to reaffirm it—evidence strongly suggests that between August 6 and August 12, BTC and the broader cryptocurrency market may experience significant shifts in trend and sentiment.
Several months ago, I first mentioned this timeframe during a video outlook, which you can find here.
Today, I’ll walk through all the evidence built step by step—from time range, price range, and time angle perspectives. I believe you’ll see that the likelihood of a major event or news development during this window is very high.
We’ll start from monthly charts and drill down to daily charts to illustrate the convergence of multiple factors.
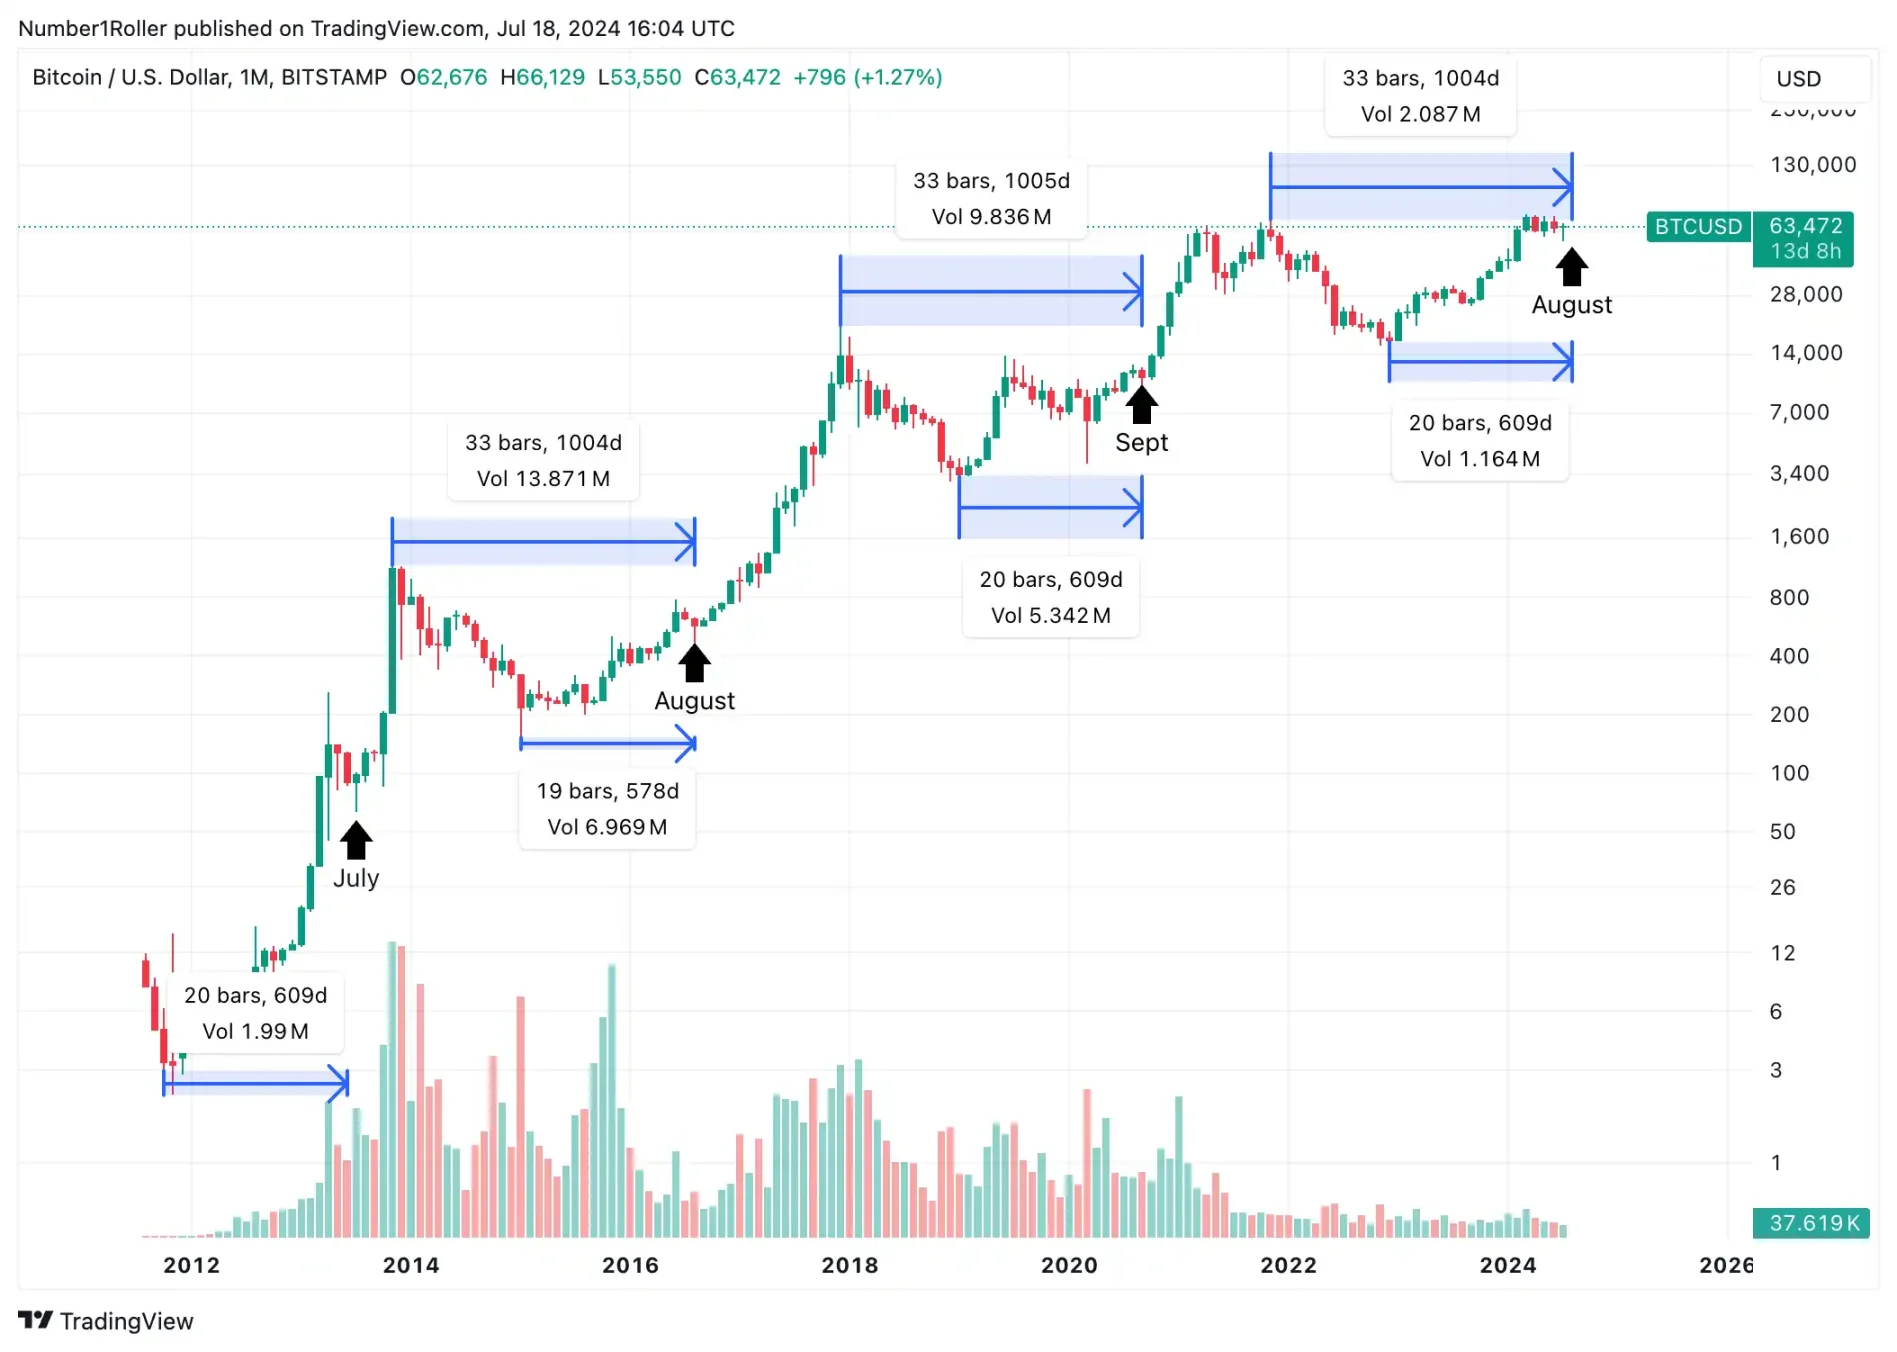
The monthly chart was our focus last week, but to further demonstrate we’re within the same cycle, we’ve also included the months of prior tops. As you can see, the previous two cycles align almost perfectly with the current one. Both 33 months from the major peak and 20 months from the major trough place us squarely in the July-to-September window—the final bottom before a strong upward move.
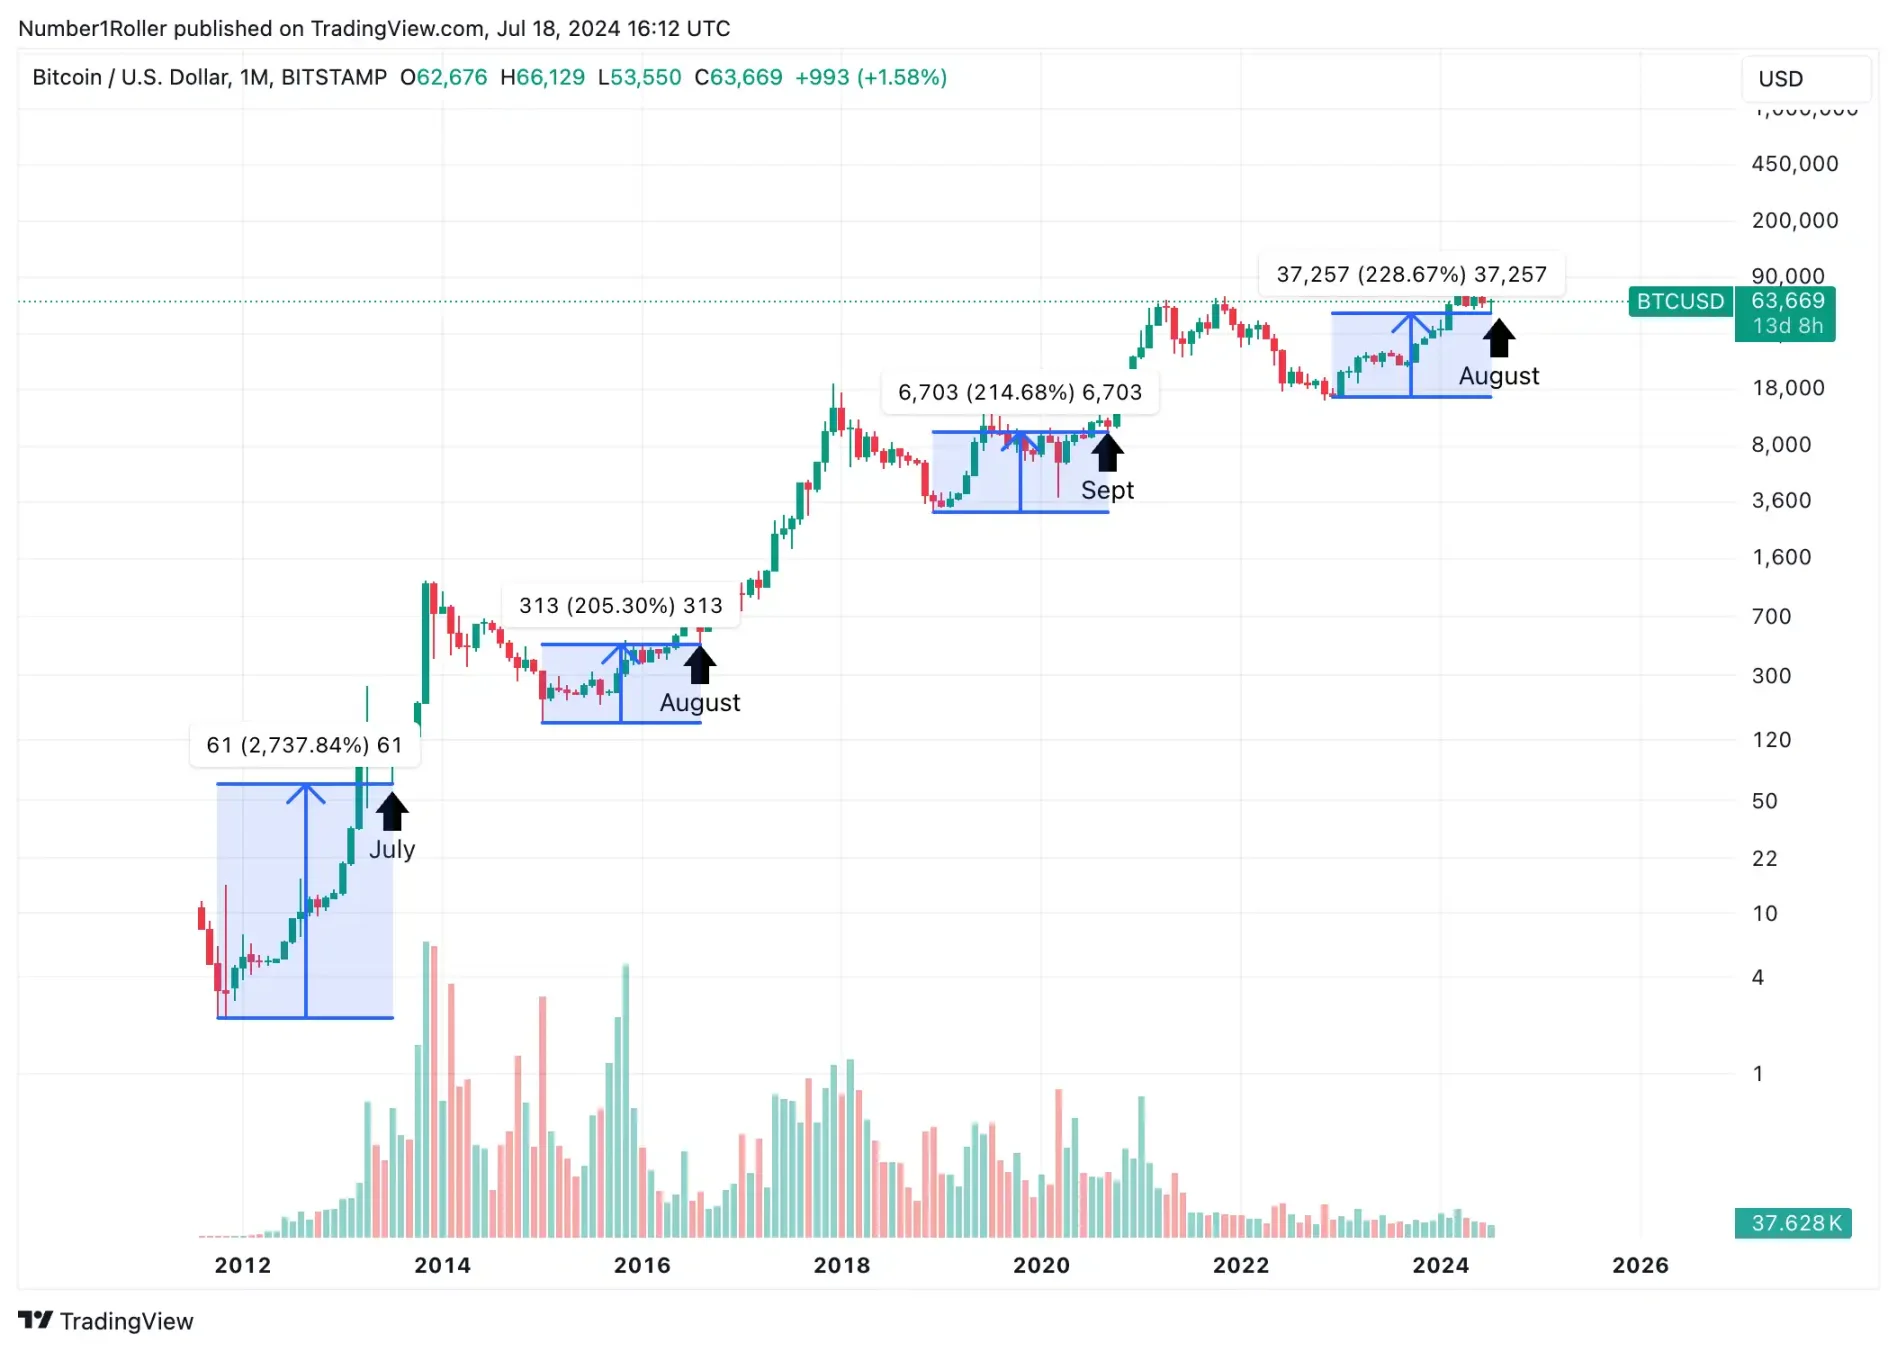
Now that we know timing supports our case, many argue this cycle is different because prices quickly reached new highs. But let’s compare the current cycle with prior ones on the monthly chart.
The evidence is striking. As shown, in the prior two cycles (except 2012), price rose just over 200% from bear market lows—precisely at the stage we are in now. You can clearly see this cycle isn’t different after all. In fact, both time and price are exactly where they should be—neither overextended nor ahead of schedule, contrary to what some commentators suggest.
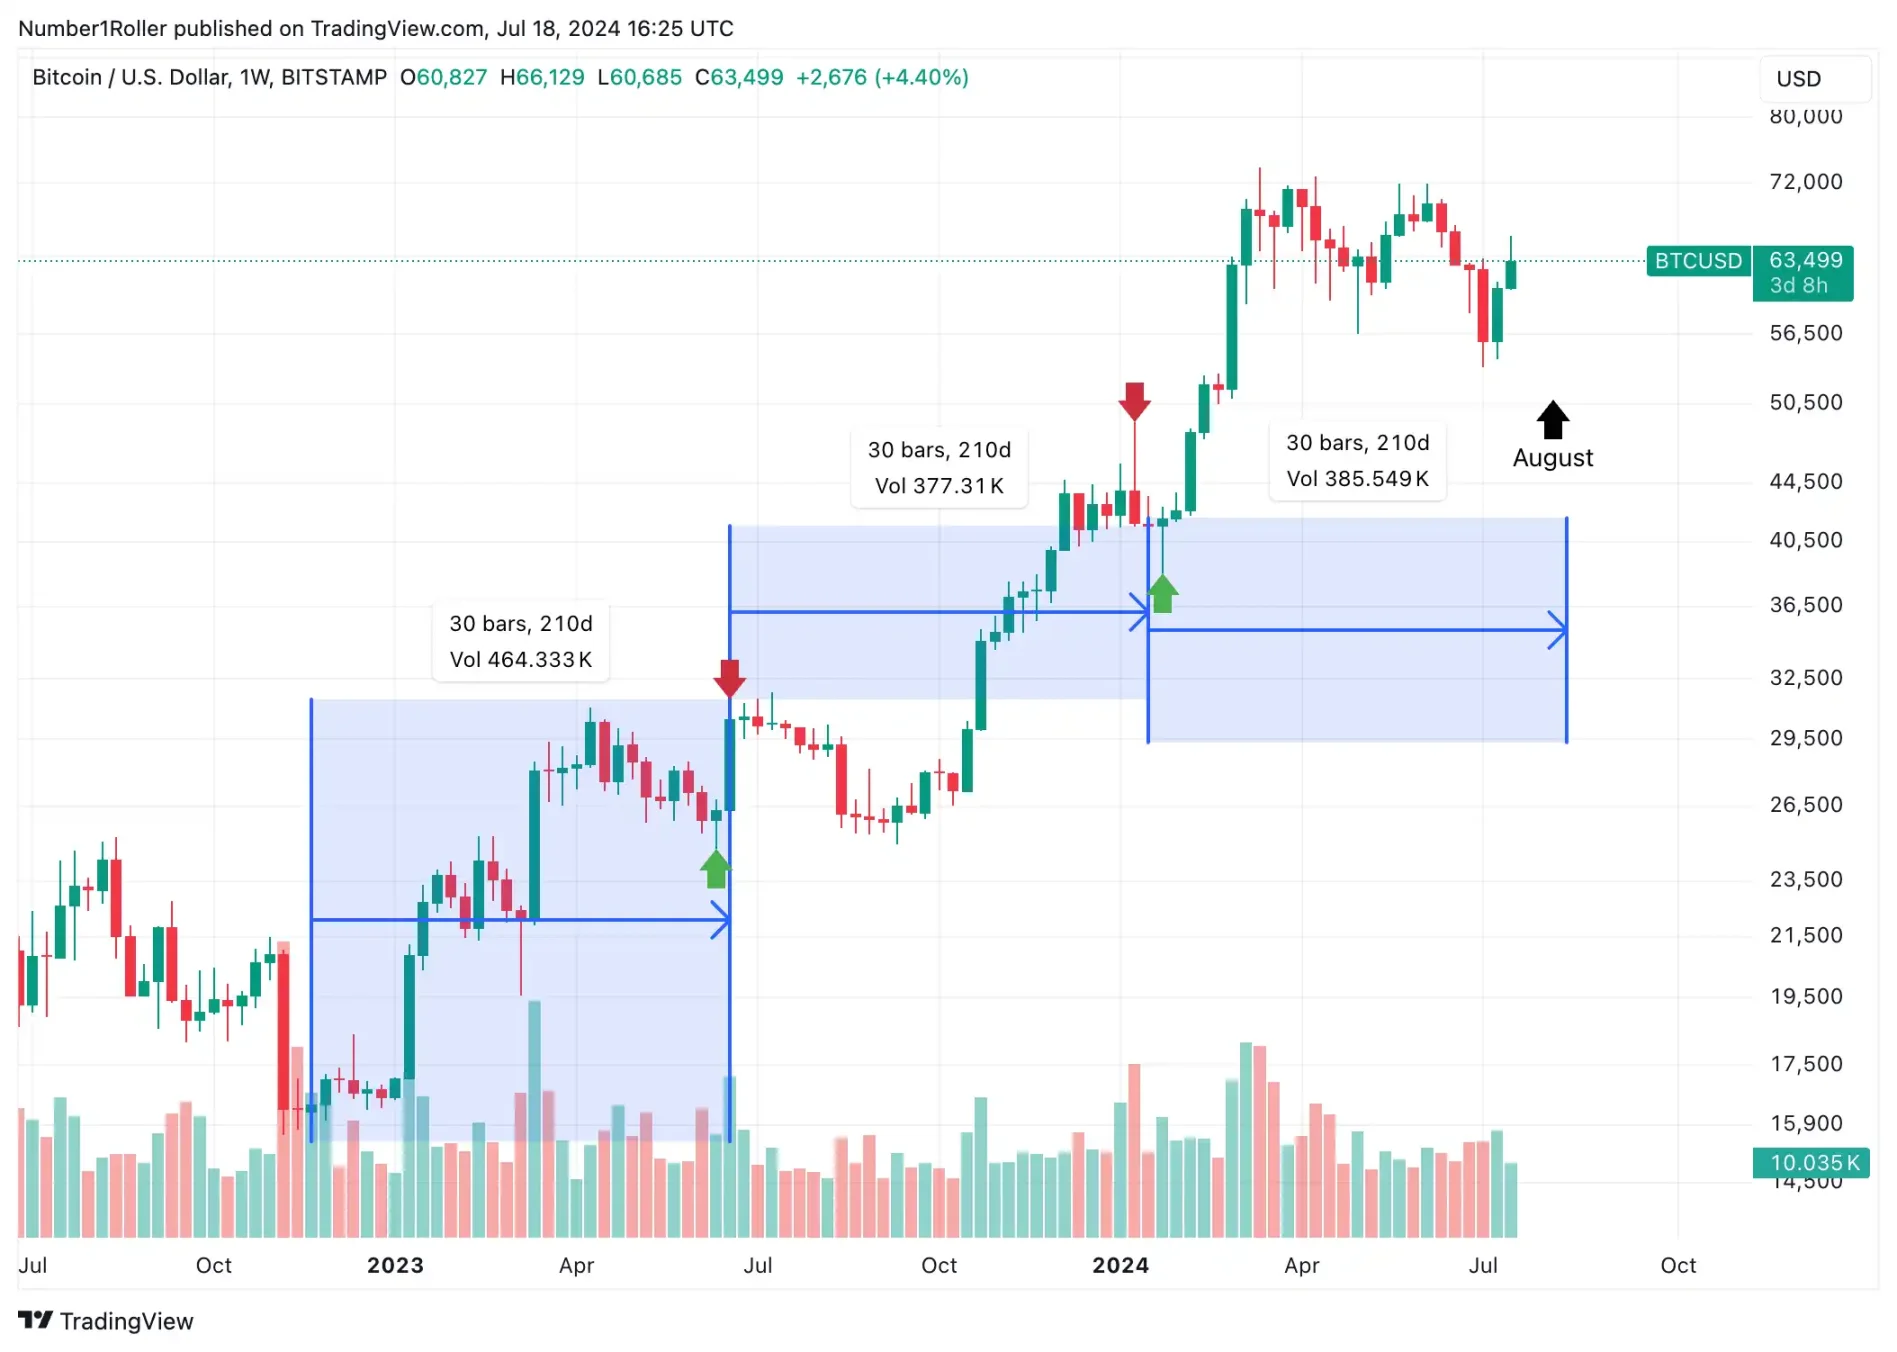
Next, turning to the weekly chart, there’s even more to unpack. First, we observe that every 30 weeks marks a key trend shift in this cycle. Interestingly, this 30-week interval consistently appears midway between a major low and a major high. I'll explain why in the following charts, but for now, note that the next 30-week milestone lands exactly on the week of August 12. Combined, these three 30-week intervals total 90 weeks from the bear market bottom.
Moreover, zooming further into the weekly chart, I noticed that from the 2017 peak to the first notable high in 2021 was 174 weeks. August 12 will mark exactly 174 weeks from that April 2021 high—a clear and significant peak. Thus, we're approaching the same interval between two critical turning points: the 2017 top and the April 2021 top.
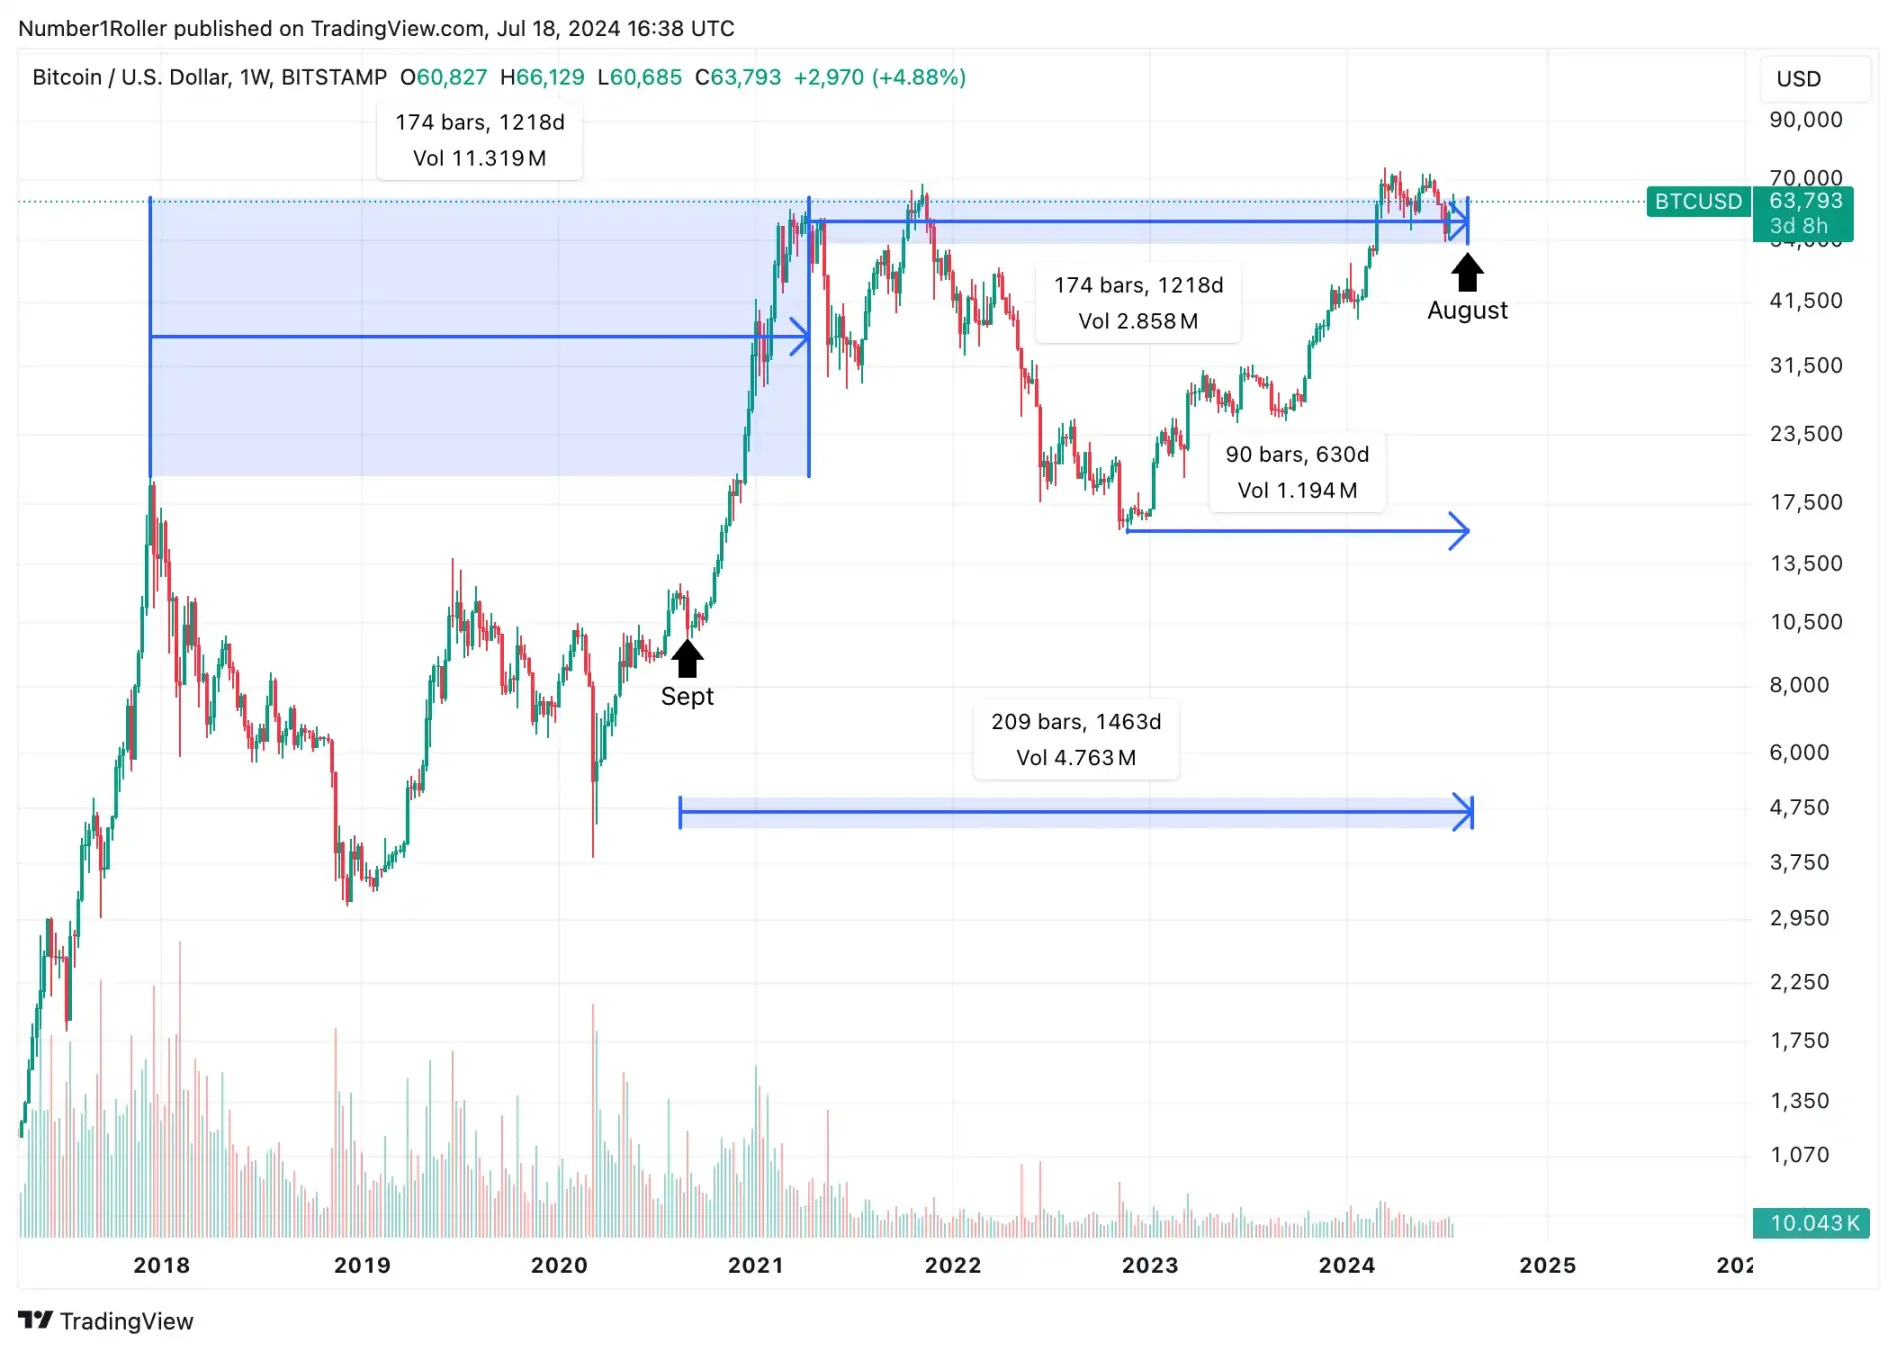
Based on our evidence, however, the market is currently in a different phase. In my view, the inflection point is more likely to manifest as a major low rather than a major high. Yet, as I've consistently emphasized, during such cycles we often witness both a significant high and low within this time window.
The chart below illustrates this specific period in each past cycle, along with how the market behaved this time last year. As you can see, there's nearly always a sharp rally in August followed by a rapid decline—sometimes as deep as 20–50%. Last year differs from the other three charts only in that it was still early in the second year of the cycle, but it nonetheless reveals the seasonal tendency for this type of movement in August.
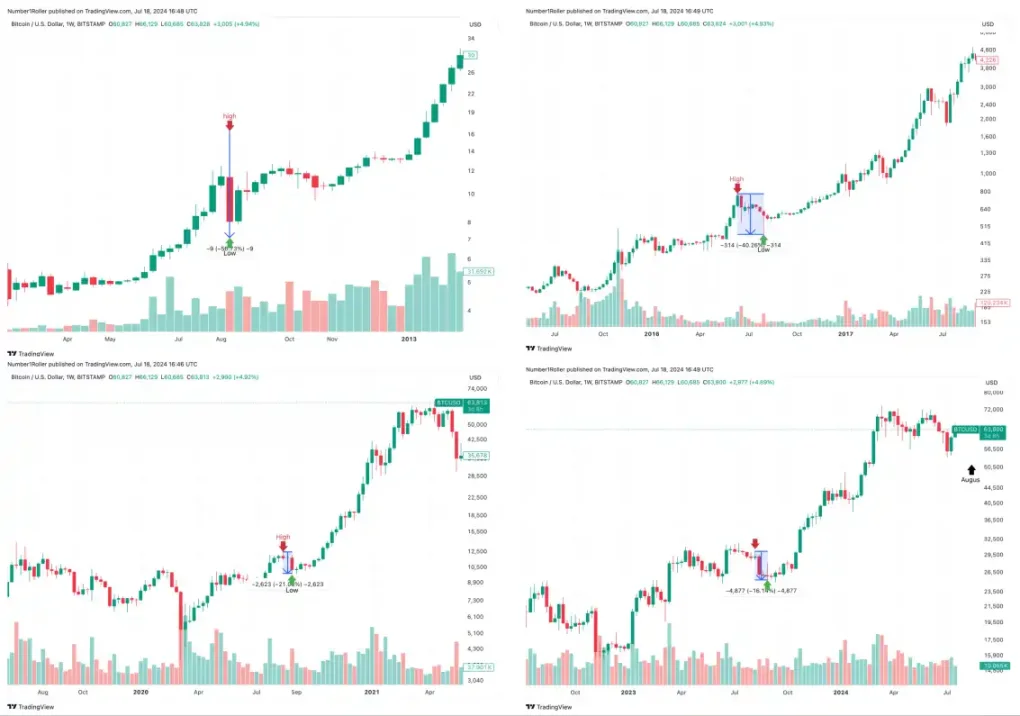
It also shows that in this cycle, the market has formed notable highs and lows near the 30-week inflection points, within a relatively tight time window.
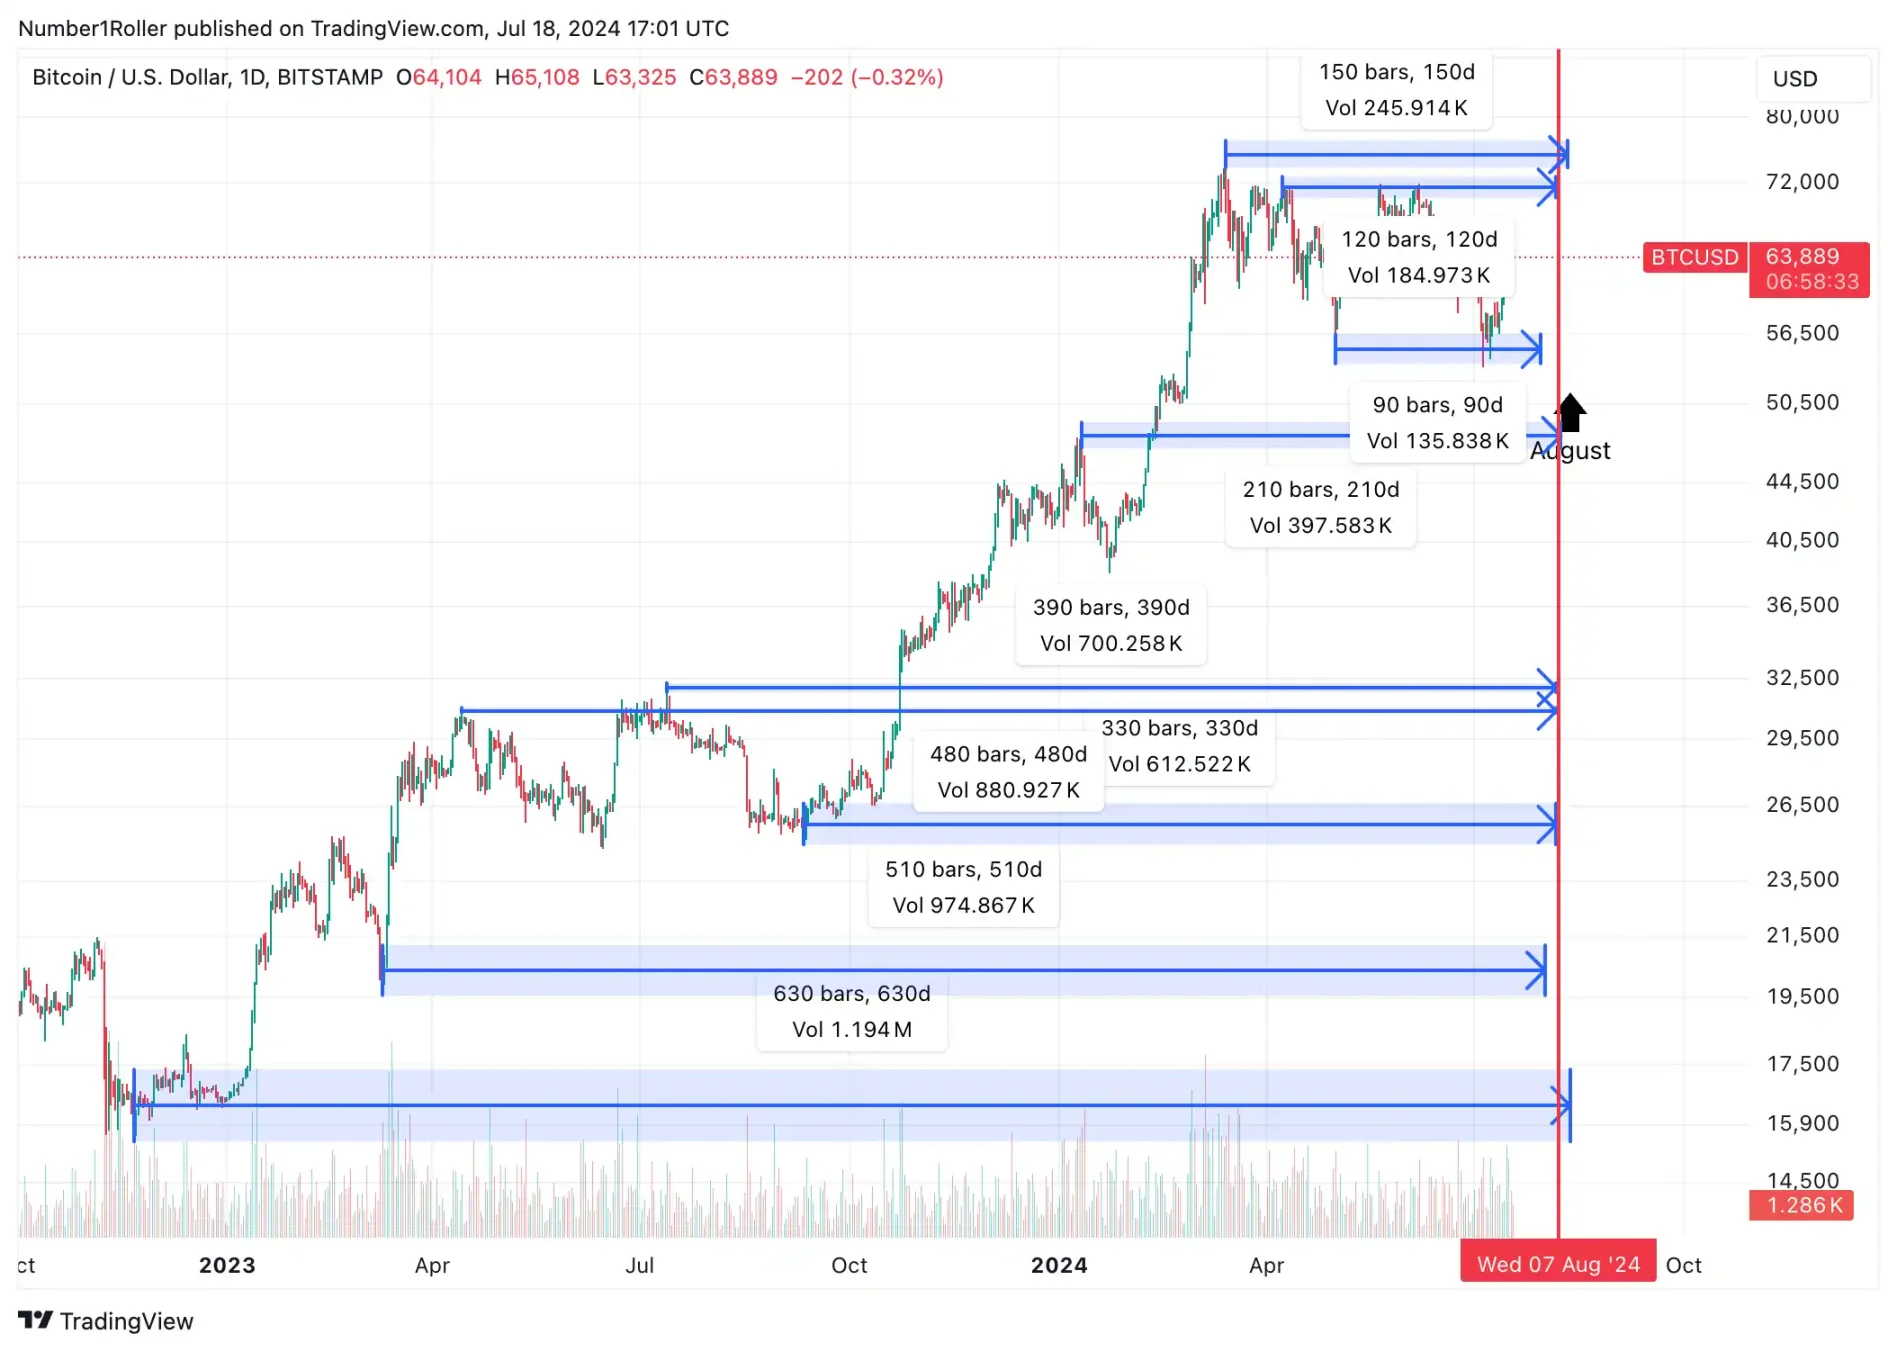
Now, let’s consider the time angle perspective. Simply put, a time angle involves counting 30 calendar days from a significant high or low and watching for trend changes. You start at 30 and add increments—30, 60, 90, 120, 150, 180—and look for trend shifts at those junctures. The greater the clustering of these time points, the more significant that day or week becomes.
As shown in the chart below, all these time measurements converge within a single time angle window. In this cycle, multiple key highs and lows point to the second week of August as a major convergence period.
Finally, from a time range standpoint, the market in this cycle has consistently followed a 150-day rhythm: approximately 155 days of uptrend followed by 150 days of consolidation. Importantly, market time balance should not be skewed—meaning the number of down days should not exceed up days. In bull markets, upward movement typically lasts longer than declines, as illustrated in the chart below. If the market sees more than 150 consecutive down days with new lows forming, that would be a negative signal.
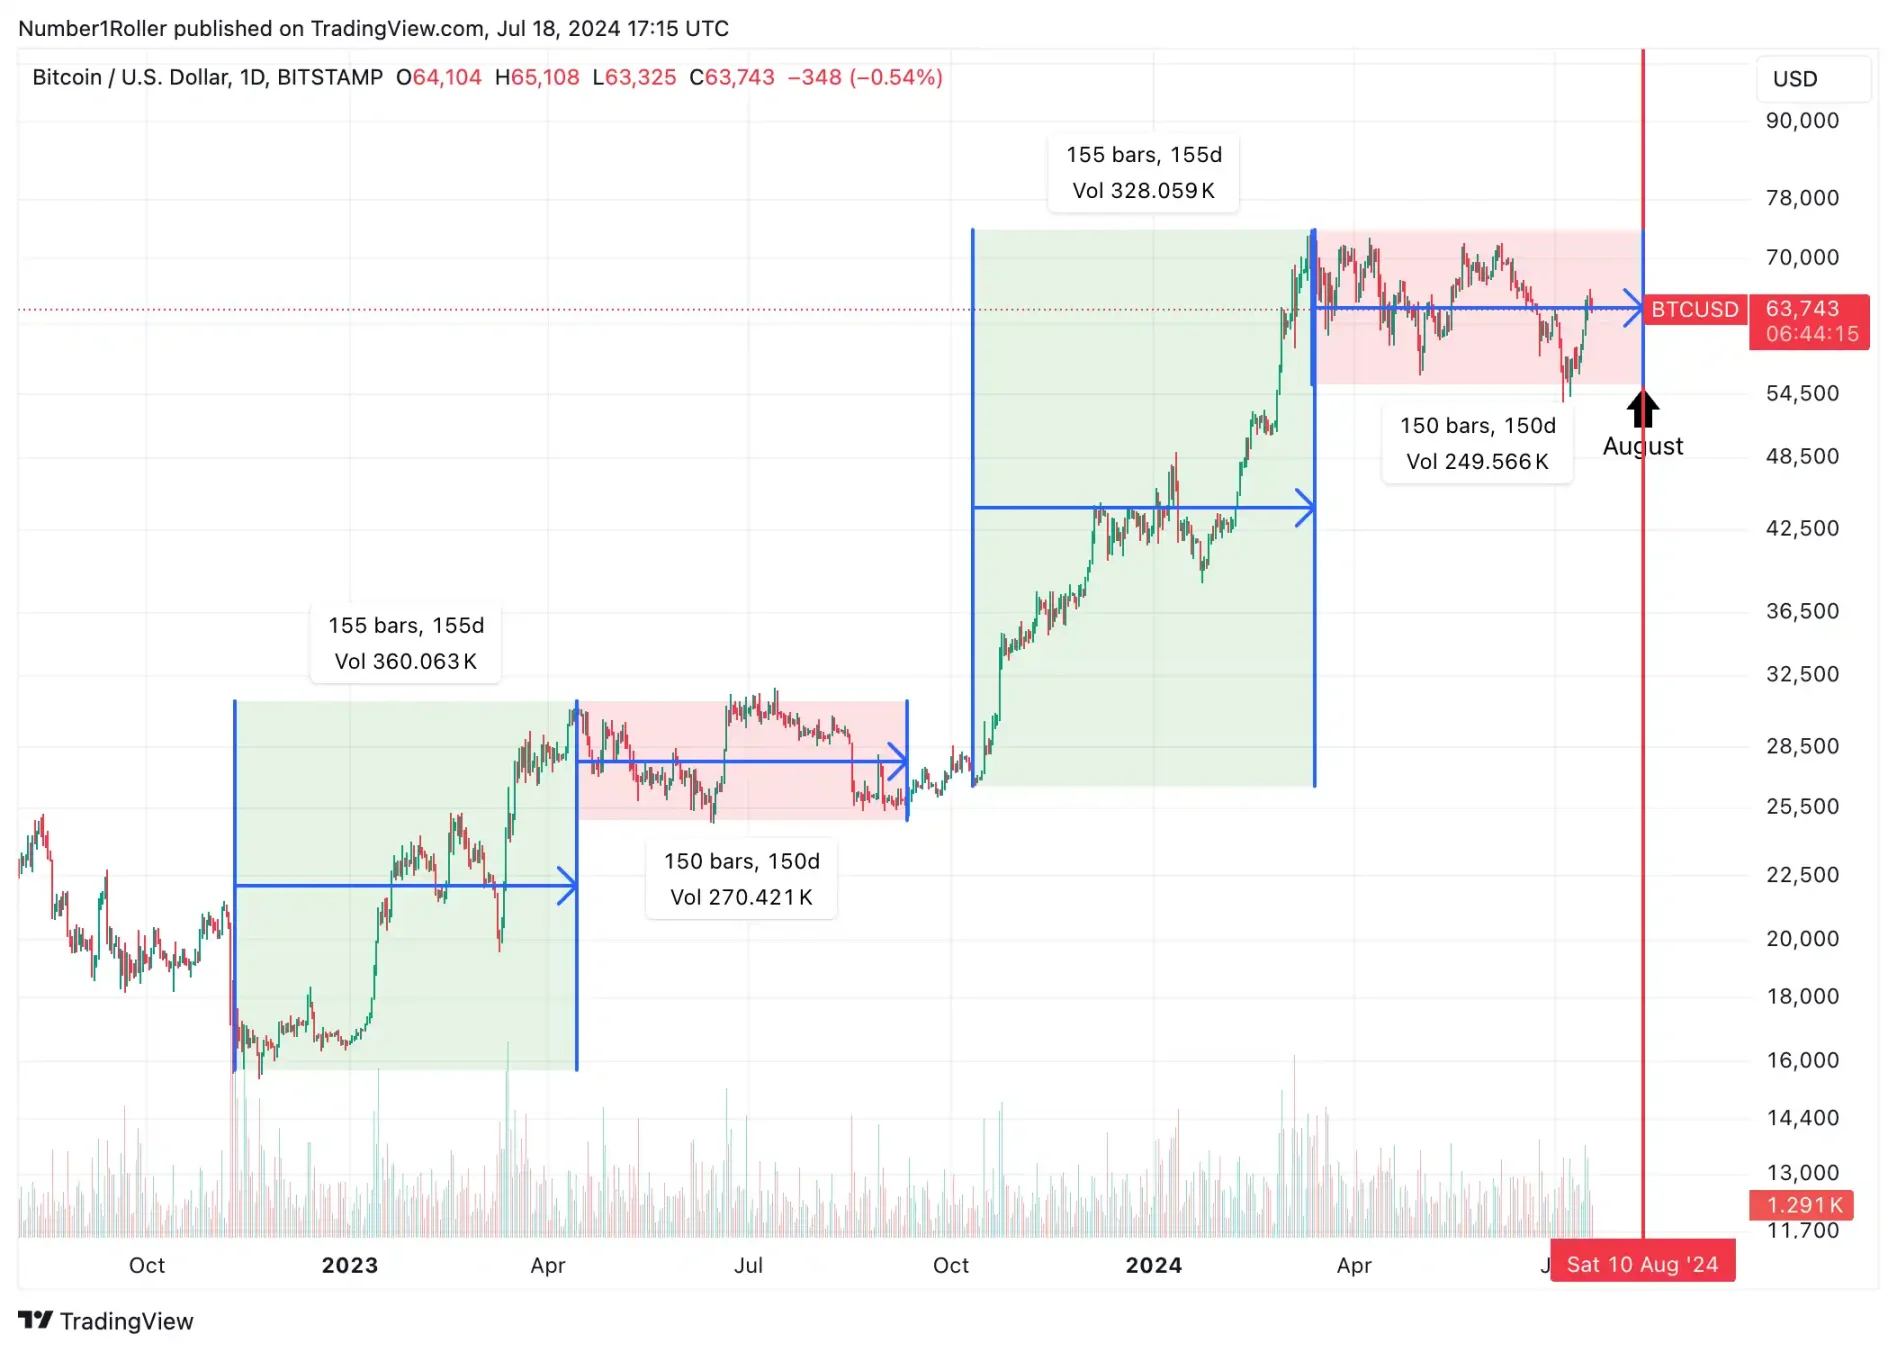
In conclusion, when combining price range, time range, time angles, and seasonal factors, we are approaching a mid-August window that is highly likely to act as a trigger point for BTC. If this evidence weren’t enough, note that BTC’s chart origin date is August 19. I won’t dwell on this, but inception dates matter—and August is historically the month when major bull runs begin.
This is precisely why I remain cautious here and am waiting until this window passes before taking more aggressive action. Will we see ETH ETFs finally launch trading, followed by a sharp selloff similar to what happened with BTC ETFs? Or will political headlines heighten election-related uncertainty? I’m not certain exactly what will unfold—but this is undoubtedly a period worth watching closely and navigating with patience.
Join TechFlow official community to stay tuned
Telegram:https://t.me/TechFlowDaily
X (Twitter):https://x.com/TechFlowPost
X (Twitter) EN:https://x.com/BlockFlow_News
 @1995research