A signal that has appeared before every BTC bottom since 2014, this time it was close.
TechFlow Selected TechFlow Selected
A signal that has appeared before every BTC bottom since 2014, this time it was close.
Either this time is different, or the real shakeout hasn't come yet.
 Navigating Web3 tides with focused insights
Author: Jake Pahor
Compiled: TechFlow
TechFlow Editor's Note: A valuation model tracking Bitcoin's 12-year history has just been rebuilt. The new model shows a current reading of 24.3, in the historical bottom 20% range—but every previous bear market bottom saw this number drop below 20. Either this time is different, or the real capitulation hasn't arrived yet. For those looking to buy the dip, this is an uncomfortable but worth-watching signal.
Two weeks ago I told you Bitcoin was in the bottom 3% range of its entire history. Today this score reading is 24.3, bottom 20%.
The market didn't move 17 points. The model changed. Rather than quietly updating a number and hoping no one checks, I prefer to explain plainly what exactly happened.
Because here's the thing: if you're going to use a score to make real-money decisions, you have the right to know when it changed and why. This is the difference between a system and a sales pitch.
Why the Score Moved But the Market Didn't
Our old model had a flaw, we knew it long ago. It compared today's price against Bitcoin's entire history, including the early years when BTC could rise or fall thousands of percentage points in a few months. That volatility will never repeat. Because they were incorporated into the baseline, the score would quietly read low and never be able to reach the top of its range again. Useful, but drifting.
The rebuilt model (v4.1, now live) measures the position of price within a fair value range, a range that projects forward with the asset, rather than being anchored in 2012. Same 0 to 100 scale. Same job. Better ruler. We validated it against 21 manually labeled cycle tops and bottoms in Bitcoin's history, and it identified these points with about 35% higher accuracy than the old model. I'm not going to churn through the full methodology in the newsletter, but we've published the plain English version on the website, because a score you can't question is just a feeling with numbers.
So what does the new ruler actually say?
Here's where it gets interesting, and honestly, a bit uncomfortable.
Since 2014, every Bitcoin bear market has ended on this model in the same way: the score stays below 20 for a substantial period before the turn. The 2015 bottom printed around 7. December 2018 printed around 15. In November 2022 at the price low of $15,742, the score reading was 18, and it stayed below 20 for several weeks before and after that.
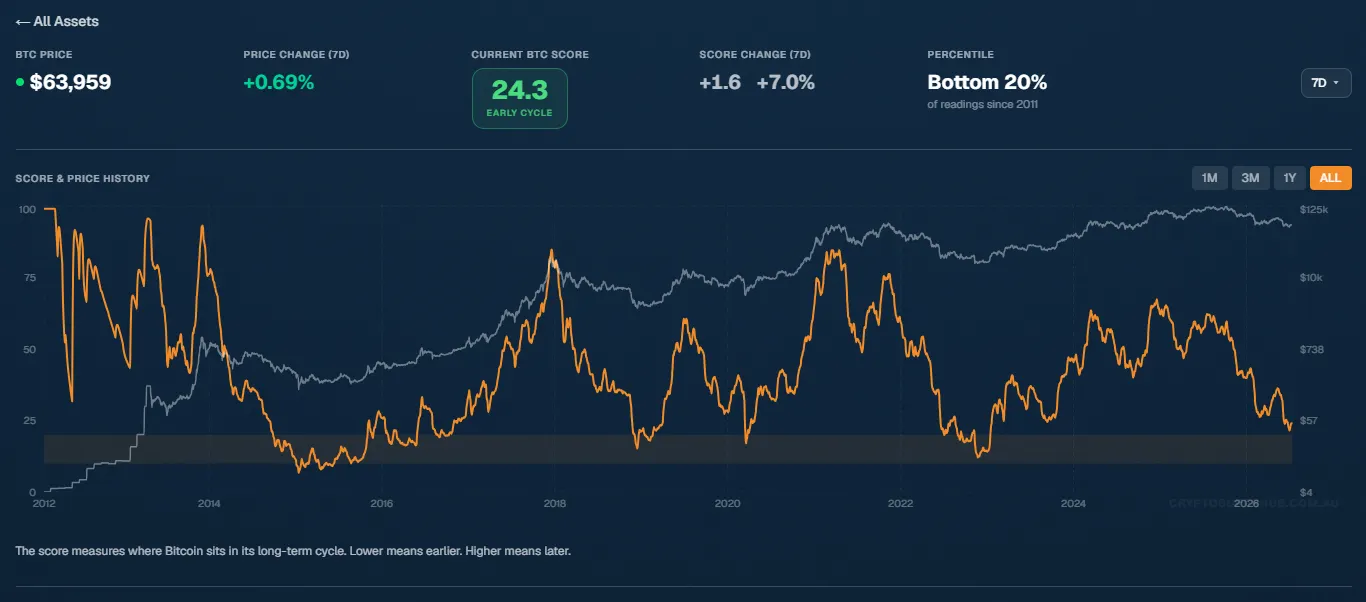
The lowest print so far this cycle: 21.5, July 1, BTC at $58,550.
Close. But not there yet.
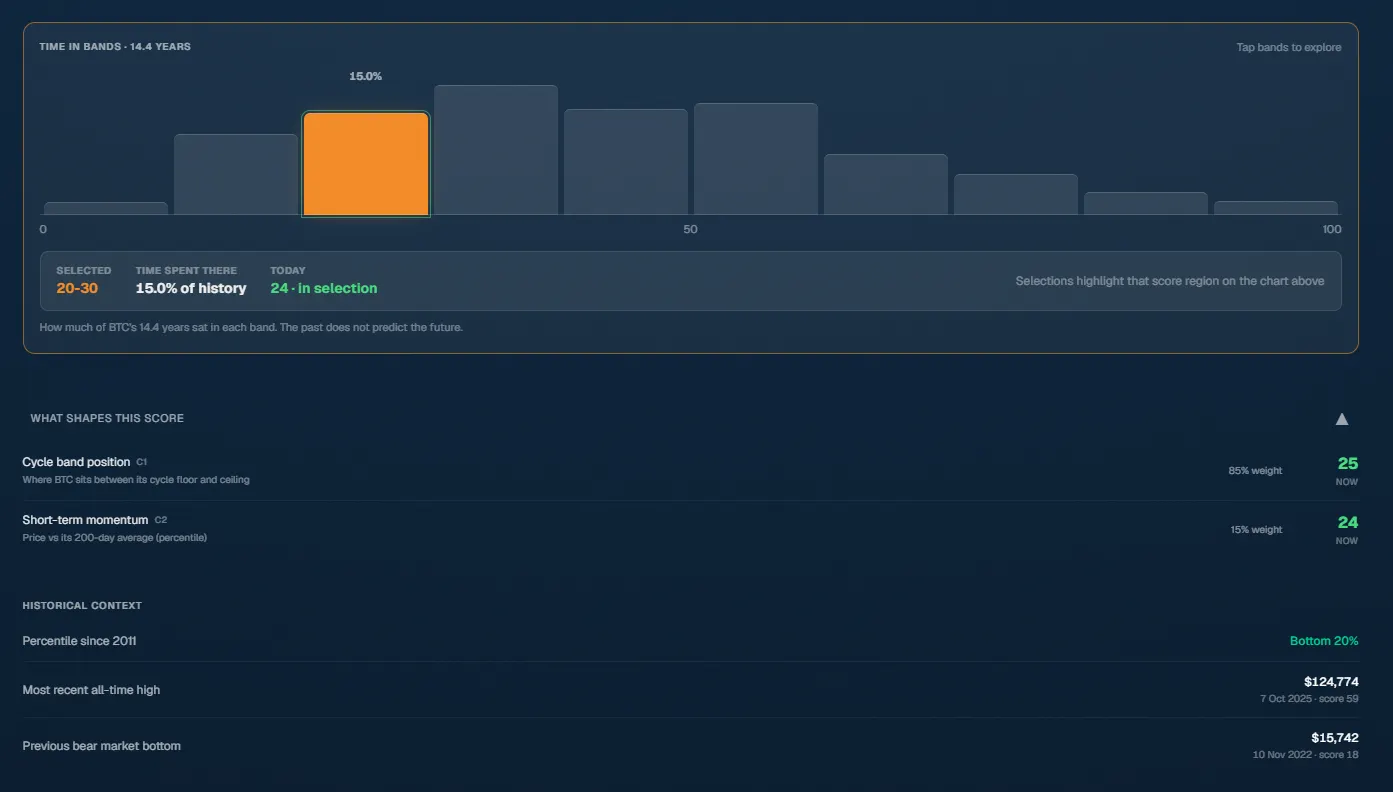
Interpret it how you want, but here is my honest understanding: By the standards of every previous cycle, we have not yet seen the kind of capitulation that historically marks the end. That is one possibility. Another possibility is that this cycle stays shallower, just as every previous cycle was shallower than the one before. Our October 2025 top printed a score of 59, far short of the readings above 74 in past crazy times. Compressed tops might mean compressed bottoms. The past cannot predict the future, and I won't pretend the model is a crystal ball. It is a map of where we are, not a prediction of where we are going.
What I actually did, because a score without decisions is just decoration:
I bought on July 1. Not because I caught the bottom (I didn't know that was the bottom, no one knows). But because my plan set a trigger at that price, and the trigger fired. It felt like an ordinary day. The score printed the cheapest reading of the entire cycle, and my phone didn't ring once. This is what real accumulation zones feel like: boring, quiet, slightly nauseating.
I still have a large chunk of capital, its deployment schedule is written in my plan, tied to score levels, not tied to how I feel that day. If the score prints below 20, my plan will buy more aggressively. If it doesn't drop below 20 and the market turns anyway, my regular DCA has already given me a position. In either case I don't need to be right. I just need to follow what I wrote down when I was calm.
The rebuilt score is now live in the app, along with historical data, so you can check every claim I just made against the charts yourself.
CSH Risk Dashboard
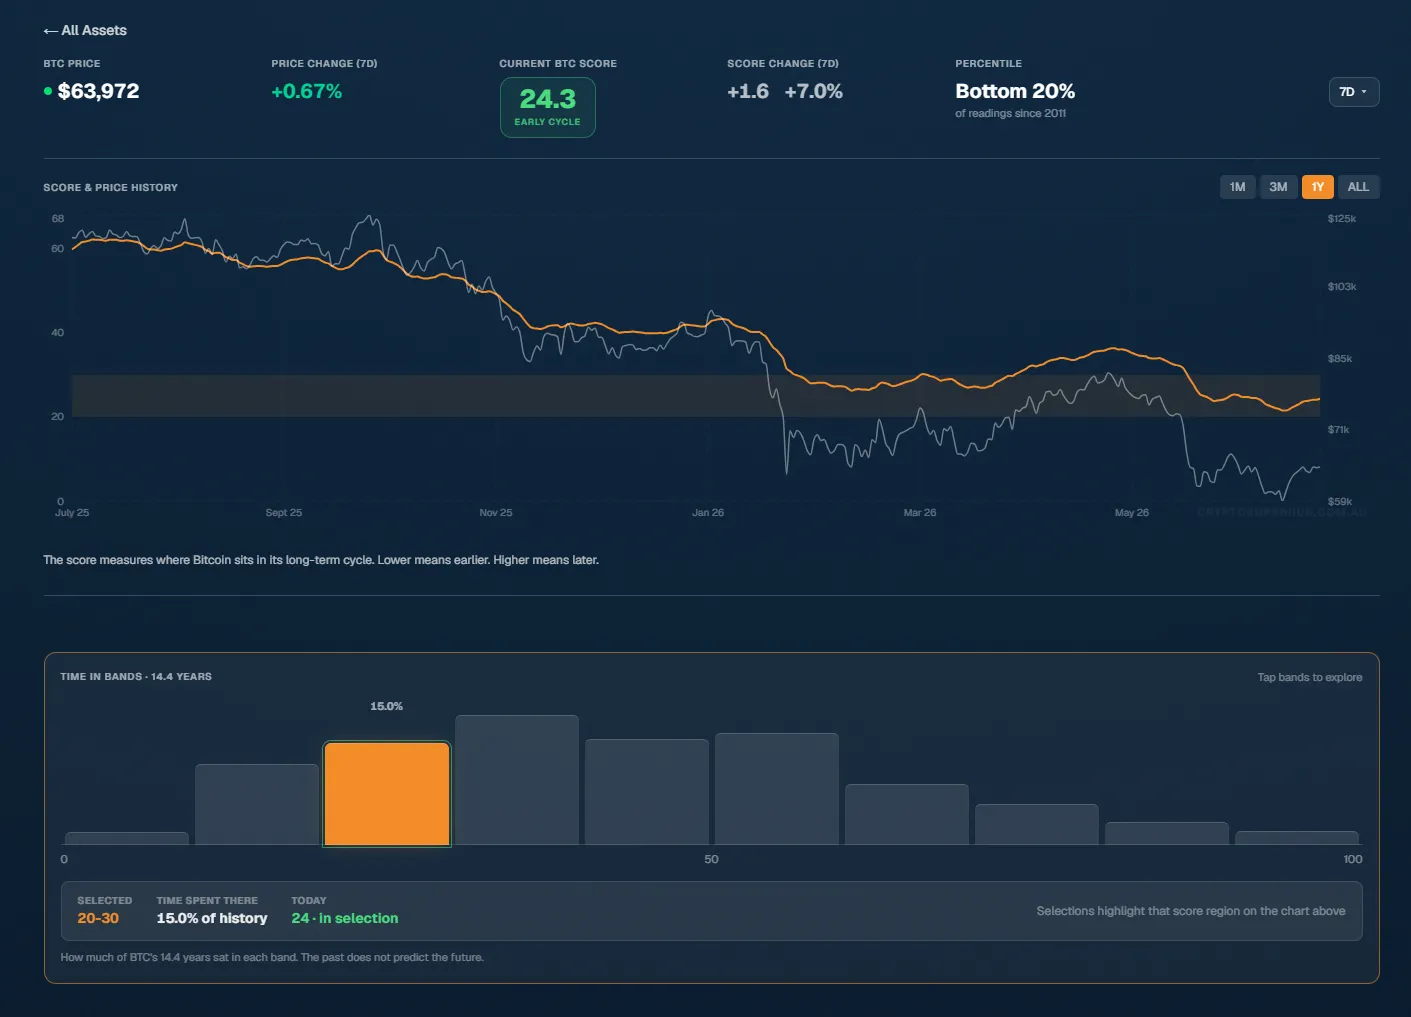
Numbers as of tonight:
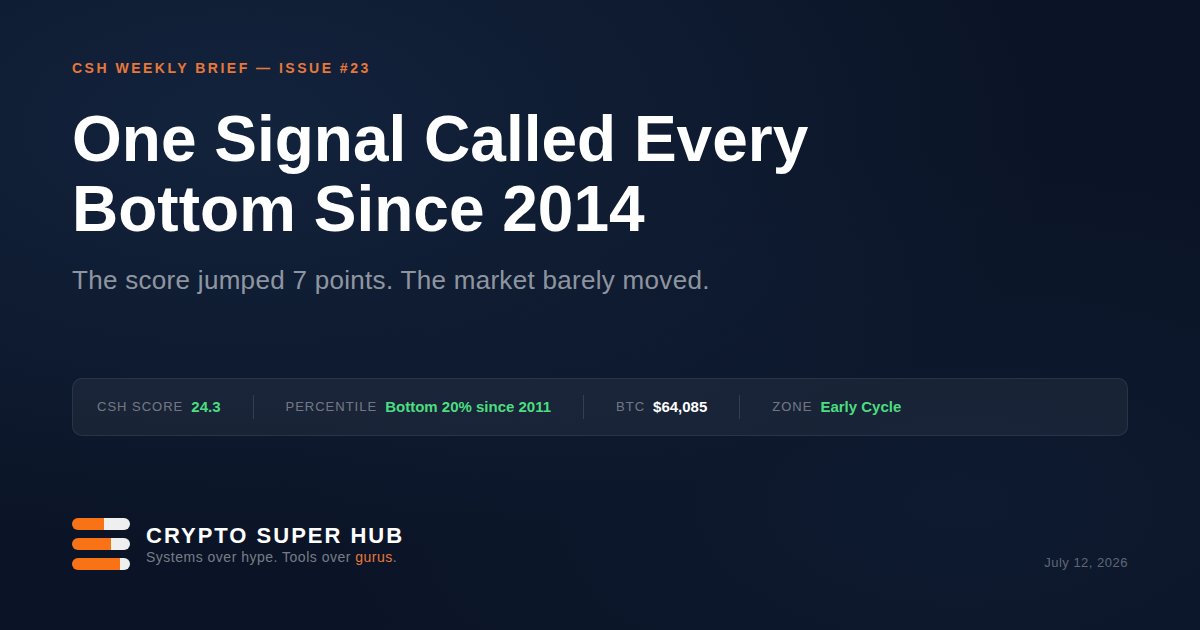
BTC $64,085, up 0.96% this week. The score sits at 24.3, up 1.6 points (7%) over the same period, in the bottom 20% of all readings since 2011. We are in the 20 to 30 range, BTC has spent about 15% of its 14.4-year history in this range.
Pullback, because the system keeps receipts: the low on July 1 at $58,550 printed the cheapest score of this cycle, 21.5. Since then, price is up about 9.5%, and the score followed up. None of this changes the plan. The next tier has its trigger, the trigger hasn't moved.
BTC reclaimed the 200-week moving average this week, located near $62.9k, after losing it on July 1. So what: that line is the life-or-death line for long-term holders, past two bear markets grinded below it for months. Quick reclamation is constructive. My plan doesn't trade moving averages, but this is the same shift captured by the score's momentum reading this week.
One Bitcoin can now buy approximately 15.5 ounces of gold, the lowest point in nearly three years. Gold has corrected significantly, falling from a record high near $5,100 in January to around $4,120, but BTC has still lost ground relative to it: this ratio has roughly halved since the October top, when one coin could buy nearly 30 ounces. So what: hard money capital went to gold first this cycle. When the crypto cycle turns past, this ratio will swing back quickly. My plan doesn't trade this ratio, but there is no clearer picture to show how unwelcome BTC is right now.
Bitcoin dominance is at 59%. So what: altseason is nowhere on the radar. Bear market rule in the script: altcoins bleed longer and harder. Plan is to accumulate the index leader first, ask about altcoins much later in the cycle.
Jake's Workbench: Launch Week
The biggest build week we've had. Tom is a machine:
CSH Score v4.1 is live for BTC, with ETH, SOL, and XRP following closely. The website underwent a complete UI overhaul, including charts and mobile. And we ran a full security audit before something we've been pushing all year: the Paid Founding Plan.
Straight talk on this last thing: there will be exactly 100 founding seats, discount pricing locked in forever. That cap is real, not a marketing stunt, so when it's full, it's full. If you want to see it first, create a free account, you'll hear about it from me before anyone else. For the price of a couple of coffees per month, you get the score, the plan builder, and a dashboard that keeps you honest on days you don't want to be.
An apology here: if you were using a live plan for score triggers this week, the model change moved your readings, I know this is annoying. Short-term pain, long-term gain of a much sharper tool. Full changelog is on the website.
Outlook for Next Week
I'm watching three things, none of which require prediction:
200-week MA near $62.9K. We reclaimed it this week, after losing it on July 1. Holding above it is the first good sign; losing it again puts lower support levels back on the table.
The score's path to 20. Every previous bear market printed below it before the turn, but not this time yet. If it gets there, my plan will buy more aggressively. If it doesn't, DCA has already given me a position. Watch this number with me on the app.
Gold rotation. If the BTC/Gold ratio stops falling, that is the earliest signal that hard money capital is starting to look our way.
We rebuilt our own model 10 to 12 weeks before asking anyone to pay for it, and the new version makes today's market look less like a bottom, not more. This is the most inconvenient possible outcome for our business, and we published it anyway. System over hype was never meant to be a slogan.
The question I have for you this week is this, I will feature the best answers in the next issue: What score level would make you deploy your last third of dry powder? Reply with a number. Mine is already written in my plan.
If this issue was useful, hit the heart. Substack relies on this to decide who else to show it to.
Chat next Sunday,
Thanks for reading. Share this with someone who would find it valuable.
Join TechFlow official community to stay tuned
Telegram:https://t.me/TechFlowDaily
X (Twitter):https://x.com/TechFlowPost
X (Twitter) EN:https://x.com/BlockFlow_News
 @jake_pahor