Time to Move Out of AI Stocks? Defensive Stocks' S&P Weighting Drops to Historic Low, Last Seen in 2000
TechFlow Selected TechFlow Selected
Time to Move Out of AI Stocks? Defensive Stocks' S&P Weighting Drops to Historic Low, Last Seen in 2000
A Market Where Risk Aversion Has Vanished: Retail Frenzy or Eve of a Crash?
Author: Jim Paulsen
Translation: TechFlow
TechFlow Editor's Note: The proportion of defensive stocks in the S&P 500 has fallen to 17%, near historical lows—what does this mean? Veteran strategist Jim Paulsen tells you with over 60 years of data: Whenever investors throw "risk aversion" out the window, the market is often not far from trouble. If your position is full of AI and tech stocks, this article is worth reading carefully.
Sometimes in the stock market, investors gather around a common theme, or simultaneously avoid a certain important part. This "herd" behavior often provides important information that should not be ignored—but does not necessarily need to be followed. Now may be one of those moments.
For most of this bull market, the investment "herd" has been pouring into New Era stocks and achieving great success. This bull market has been continuously boosted by several star sectors, including Mag7, quantum computing, hyperscale computing power, artificial intelligence, micro-cap stocks, IPOs, and cryptocurrency. Amid all this excitement, investors are increasingly letting the degree of "risk aversion" in their portfolios fade, which is perhaps understandable.
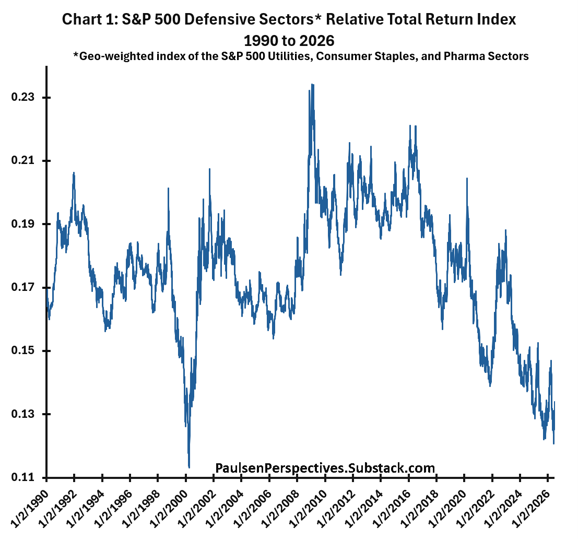
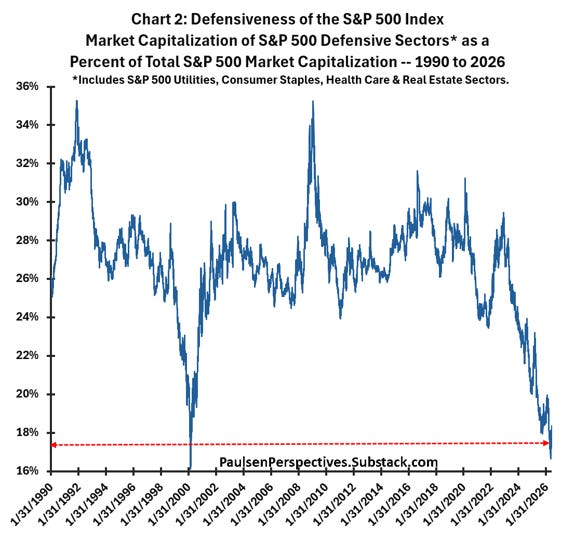
Chart 1 shows that "defensive stocks" have been underperforming in the contemporary bull market and have consistently underperformed the market for most of the past decade. Chart 2 indicates that risk aversion within the S&P 500 index is slowly disappearing. The market cap proportion of defensive stocks in the S&P 500 index has currently fallen to about 17% of the total market cap. This is near historical lows, almost half the peak in the early 1990s and at the 2009 stock market low—when defensive stocks accounted for nearly 36% of the overall stock market. No one knows how long the "current" tech boom will last, nor how high the stock market will rise led by New Era stocks. No one knows!
Nevertheless, it is becoming increasingly clear that the S&P 500 index—and possibly most portfolios—is becoming riskier. With "defense" now accounting for such a small proportion of market cap, market volatility is expected to be more intense for the remainder of this bull market. Running on high-octane alone without a defensive buffer may still succeed, but it could be much more nerve-wracking. Additionally, as risk aversion becomes increasingly absent, the likelihood of disappointing results also increases.
Stock Market Risk Aversion
A good indicator to measure the degree of stock market risk aversion may be the relative performance of low beta stocks compared to high beta stocks. Chart 3 shows the total return performance of the lowest quintile price beta stocks relative to the highest quintile price beta stocks since 1963. Data comes from the Kenneth R. French database, including all U.S. stocks listed on the NYSE, Nasdaq, and American Stock Exchange.
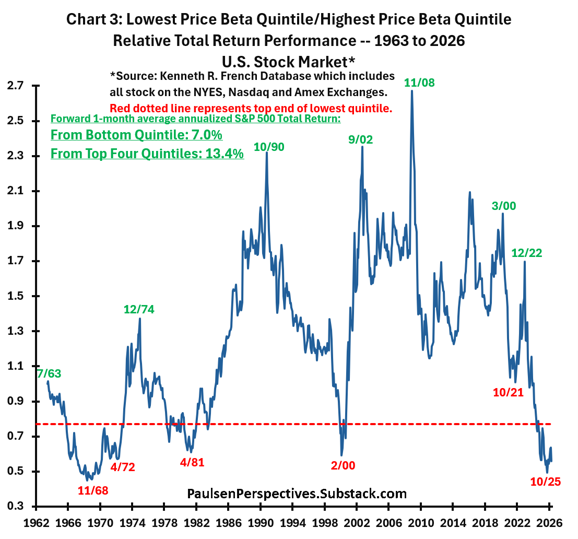
Over the past nearly 65 years, the performance gap between the most defensive stocks and the most aggressive stocks has been large. The relative total return index between low beta and high beta stocks ranges from about 0.4 to 2.7. Periods of extreme investor defense are shown by the highest relative values, while extreme bullishness (or lack of defensiveness) is indicated by the lowest relative readings.
The dates shown on the chart clearly indicate that the degree of defense is closely related to the future risk of the overall stock market. The major peaks in the relative performance of low beta relative to high beta stocks (marked in green in the chart)—usually characterized by excessive pessimism and caution driving the outperformance of the most defensive stocks—usually represent very good buying opportunities. For example, buying the stock market in July 1963 was after the sell-off during the Cuban Missile Crisis; from July 1963 to the S&P 500 peak in 1968, the stock market rose nearly 60%! December 1974 marked the stock market low of the Nifty Fifty, October 1990 represented the "start" of the huge bull market of the 1990s, September 2002 marked the internet bubble bear market low, November 2008 was only a few months away from the Great Recession bear market in early 2009, March 2000 was the pandemic bear market low, and finally, December 2022 was very close to the 2022 bear market low.
The major lows of this relative total return index—when low beta stocks significantly underperform high beta stocks over a period, usually indicating general stock market optimism and very low defensiveness (shown by red dates in Chart 3)—have historically proven to be periods when investors should be cautious when investing in the stock market. November 1968 was the start of the 1969-70 bear market, April 1972 was a few months before the start of the Nifty Fifty stock market crash, April 1981 marked the start of the bear market after the Volcker tightening, February 2000 almost precisely hit the internet bubble bull market peak, and October 2021 was only a few weeks away from the start of the 2022 bear market.
Last October, this defensiveness indicator approached its lowest level since 1963. Although the S&P 500 index did suffer a nearly 10% pullback earlier this year—bottoming in March—it has since rebounded to new historical highs. Nevertheless, the low/high beta relative performance of the U.S. stock market remains severely depressed, still signaling that the overall stock market may face difficulties in the coming months.
The red dashed line represents the lowest quintile of this indicator since 1963. As shown in the chart, when the low/high beta relative index is in the lowest quintile, the S&P 500 index's future 1-month average annualized total return is only 7% (below average return), while the average future annualized return at other times is 13.4%. That is to say, historically, when defensiveness is in the lowest quintile, the S&P 500's future 1-month average annualized total return is approximately "half lower" than the return provided by the stock market at other times. When defensiveness disappears, investors are best advised to be "cautious".
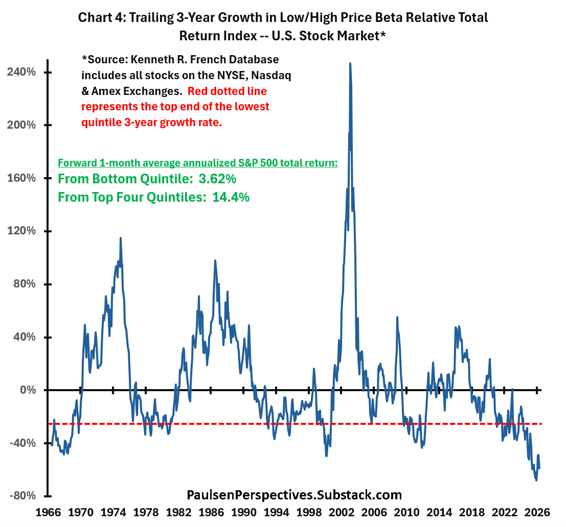
Chart 4 illustrates this more clearly, showing the past 3-year growth of the low/high price beta relative total return index (i.e., the past 3-year growth of the series shown in Chart 3). Although the level of low/high beta relative performance is important for future stock market returns, the degree of sustained underperformance is also important. Today, not only is the relative total return of low/high beta stocks near historical lows, but low beta stocks have also been significantly underperforming for at least the past 3 years. As shown in Chart 4, historically, whenever the past 3-year relative total return of low/high beta stocks was in the lowest quintile since 1963 (i.e., below the red dashed line, indicating severe and sustained relative underperformance of low beta stocks, just like currently), the future 1-month average annualized S&P 500 total return has been very disappointing, only 3.62%, while the average annualized total return at other times was 14.4%. Low beta stocks are underperforming, but the degree of underperformance over the long term in recent years is so large—indicating investors have thrown caution to the wind—meaning the S&P 500 may face a difficult road in the coming months. Historically, when this caution signal flashes red like today, the future 1-month average annualized S&P 500 total return is nearly 4 times less than at other times since 1963.
Consider Overweighting Broad Market Assets
Although downside volatility in the overall stock market may affect all stocks, I suspect any sell-off will be concentrated in the highly popular (high beta) New Era stock sectors. Therefore, adjusting the portfolio to reduce holdings in these overweighted sectors and increase exposure to broader market assets, such as small-cap stocks, value stocks, defensive and cyclical sectors, and international stocks, may outperform the overall S&P 500 for the remainder of this year.
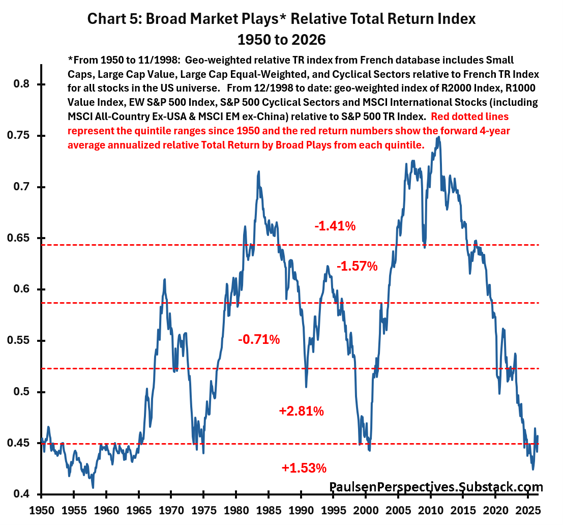
Chart 5 shows the relative total return index of the "broad stock market" proxy indicator since 1950. There are a few points worth noting. First, since around 2011, the broader stock market has mostly underperformed the overall S&P 500 index—similar to the sustained underperformance during the period from 1983 to the late 1990s. In fact, since 2011, the relative total return of broad market assets has fallen from the highest quintile to the lowest quintile. Using its relative total return index as a guide for attractiveness, it has gone from being massively overweight and overly popular in 2011 to extremely underweight and cheap today.
Second, historically, the relative performance of broad market assets often experiences "long-term" cycles. It significantly led from 1958 to 1969, underperformed from 1969 to 1975, again consistently led the stock market for nearly a decade from 1975 to near 1984, suffered a period of underperformance for nearly 15 years from 1985 to 2000, again led in the decade before 2010, and has mostly underperformed in the past 15 years. Long-term sustained relative performance cycles are not rare at all. Importantly, if the relative performance low reached last October can hold, this cycle of broad market stock underperformance will represent one of the longest periods of sustained underperformance in the post-war era. The recent era of broad market underperformance is both long and significant, and most importantly, seems overdue for a turnaround.
Third, since October 2025, broad market assets have again outperformed the overall stock market, this is the "first time" during the contemporary bull market. Interestingly, although most people still focus on the extent to which AI and other "tech stocks" are still leading the stock market, "broad market assets" have quietly outperformed the market by one of the largest margins in the past 15 years.
Finally, as shown in Chart 5, since 1950, when the relative broad market total return index is in the lowest two quintiles (like today), the future 1-month average annualized outperformance of broad market assets over the overall S&P 500 index is 1.53% to 2.81%. If broad market assets have finally turned a corner, they may continue to outperform the overall S&P 500 for a period of time.
Final Comments
I am concerned that "defensiveness" in the U.S. stock market seems to have disappeared. Most investors are still more worried about "missing" the next phase of this New Era bull market—now allegedly led by AI stocks—than about suffering any major stock market setback.
A temporary "reality check" for investors may be coming, led by New Era stocks, but not necessarily limited to New Era stocks. My guess is that even if New Era stocks do correct by more than 20%, a bear market will be avoided. I am not suggesting that investors should sell all tech stocks. I do not expect the upcoming potential volatility to replicate the internet bubble crash. But I would tilt the overall portfolio to an underweight position in New Era stocks and increase exposure to an overweight position in "broad market assets". Given that broad market assets have already outperformed the market since last October, reducing holdings in New Era stocks may still benefit your overall relative performance even if New Era stocks and the overall stock market continue to rise in the coming months.
Thanks for reading! Jimp
Any financial instruments mentioned in this article are speculative in nature and may involve principal and interest risk. Any prices or levels shown are historical data or purely indicative data. This material does not consider the specific investment objectives or financial situation, objectives or needs of specific investors and does not constitute a recommendation for specific securities, investment products or other financial products or strategies. The securities, investment products, other financial products or strategies discussed in this article may not be suitable for all investors. Recipients of this report must make independent decisions regarding any securities, investment products or other financial products.
Join TechFlow official community to stay tuned
Telegram:https://t.me/TechFlowDaily
X (Twitter):https://x.com/TechFlowPost
X (Twitter) EN:https://x.com/BlockFlow_News