Grayscale: After the 50% Drop, BTC Is Near the Bottom of This Cycle
TechFlow Selected TechFlow Selected
Grayscale: After the 50% Drop, BTC Is Near the Bottom of This Cycle
In an optimistic scenario, it is already near the bottom; in a pessimistic one, it will decline further.
Author: Zach Pandl (Grayscale Head of Research)
Compiled by: TechFlow
TechFlow Editor's Note: Bitcoin fell below $60,000 this week, hitting a new low for this cycle. Counting from the high of $125,000 in October, it has already halved. Grayscale Head of Research Zach Pandl views this pullback within historical cycles, believing it is just another cyclical correction within an uptrend, rather than a trend reversal. He provides two scenarios for exiting the bear market: in the optimistic scenario, Bitcoin may already be near the bottom; in the pessimistic scenario, it may fall further. The key variables for judgment are whether the Fed raises interest rates and whether the CLARITY Act can pass the Senate. This article is from a research report perspective, serving holders in judging direction.
This week Bitcoin fell below $60,000, refreshing the low point of this cycle. Counting from the peak of $125,000 in October, Bitcoin has now fallen by more than 50%. In our view, this pullback is another cyclical correction within Bitcoin's long-term uptrend (Figure 1).
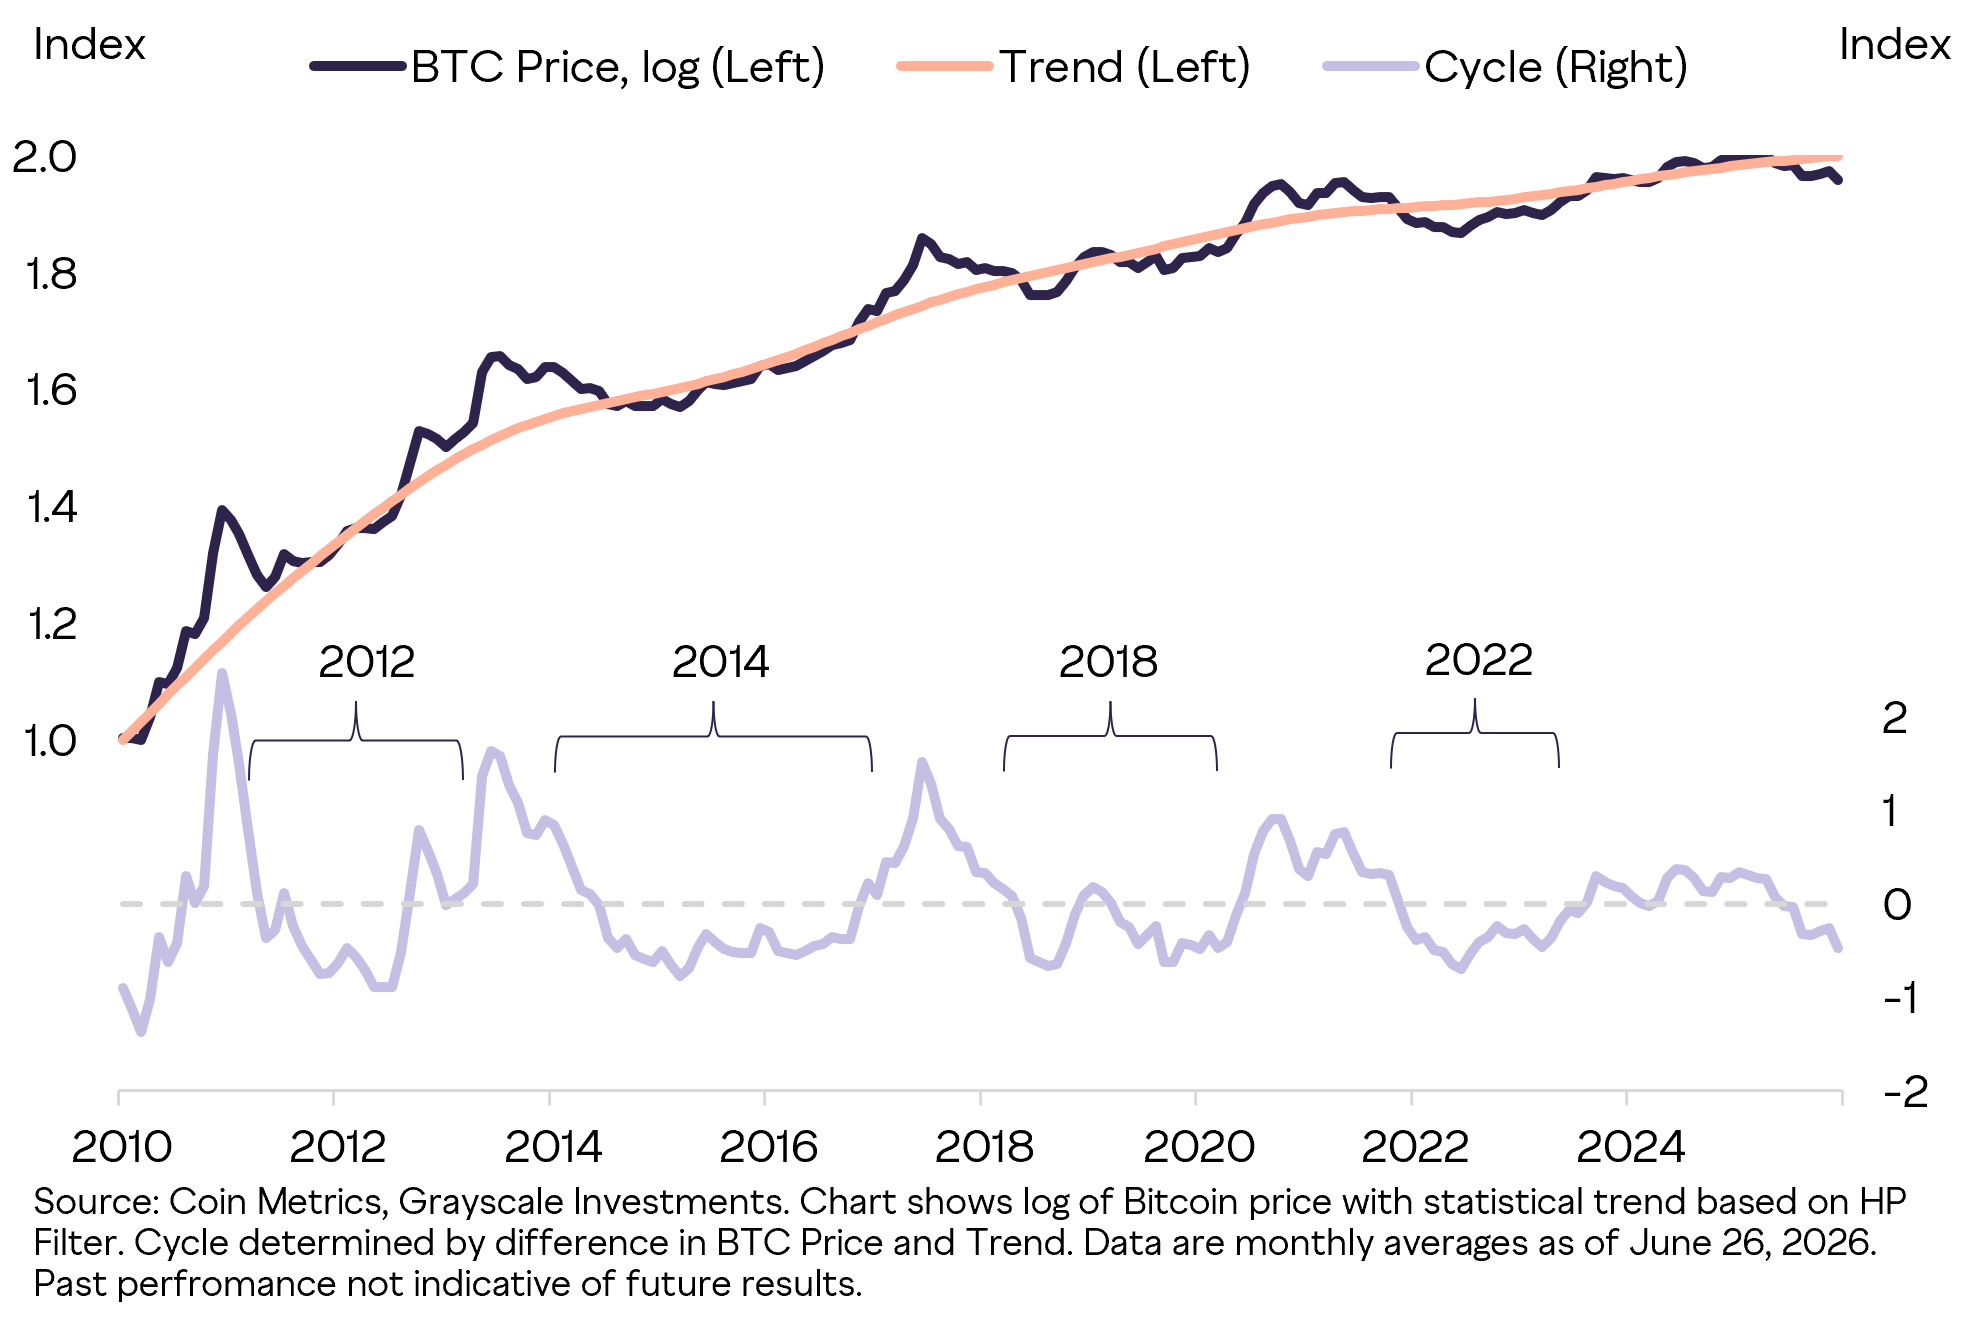
Figure 1: Bitcoin's pullback is just another cycle within the uptrend. The dark line is Bitcoin price (logarithmic, left axis), the orange line is the statistical trend line based on HP filtering, and the light purple line is the cyclical deviation between price and trend (right axis). The cyclical lows of the years 2012, 2014, 2018, and 2022 are marked, showing that the current cyclical deviation has once again returned below the zero axis.
Data Source: Coin Metrics, Grayscale Investments, monthly averages as of June 26, 2026. Past performance does not represent future results.
There are several factors suppressing Bitcoin prices in recent months. The most critical is that market expectations for Fed policy have changed, which directly hits the logic of the "currency debasement trade." At the end of last year, prediction markets generally believed Trump would nominate the relatively dovish Kevin Hasset as Fed Chair. As a result, he nominated the relatively hawkish Kevin Warsh, who officially took office this month. Due to stubborn inflation, the market now expects the Fed to raise interest rates this year instead of cutting them (Figure 2). Spot gold prices are also competing with fiat currencies (such as the USD); it has fallen about 25% from its high, and after volatility adjustment, the decline is similar to Bitcoin.¹
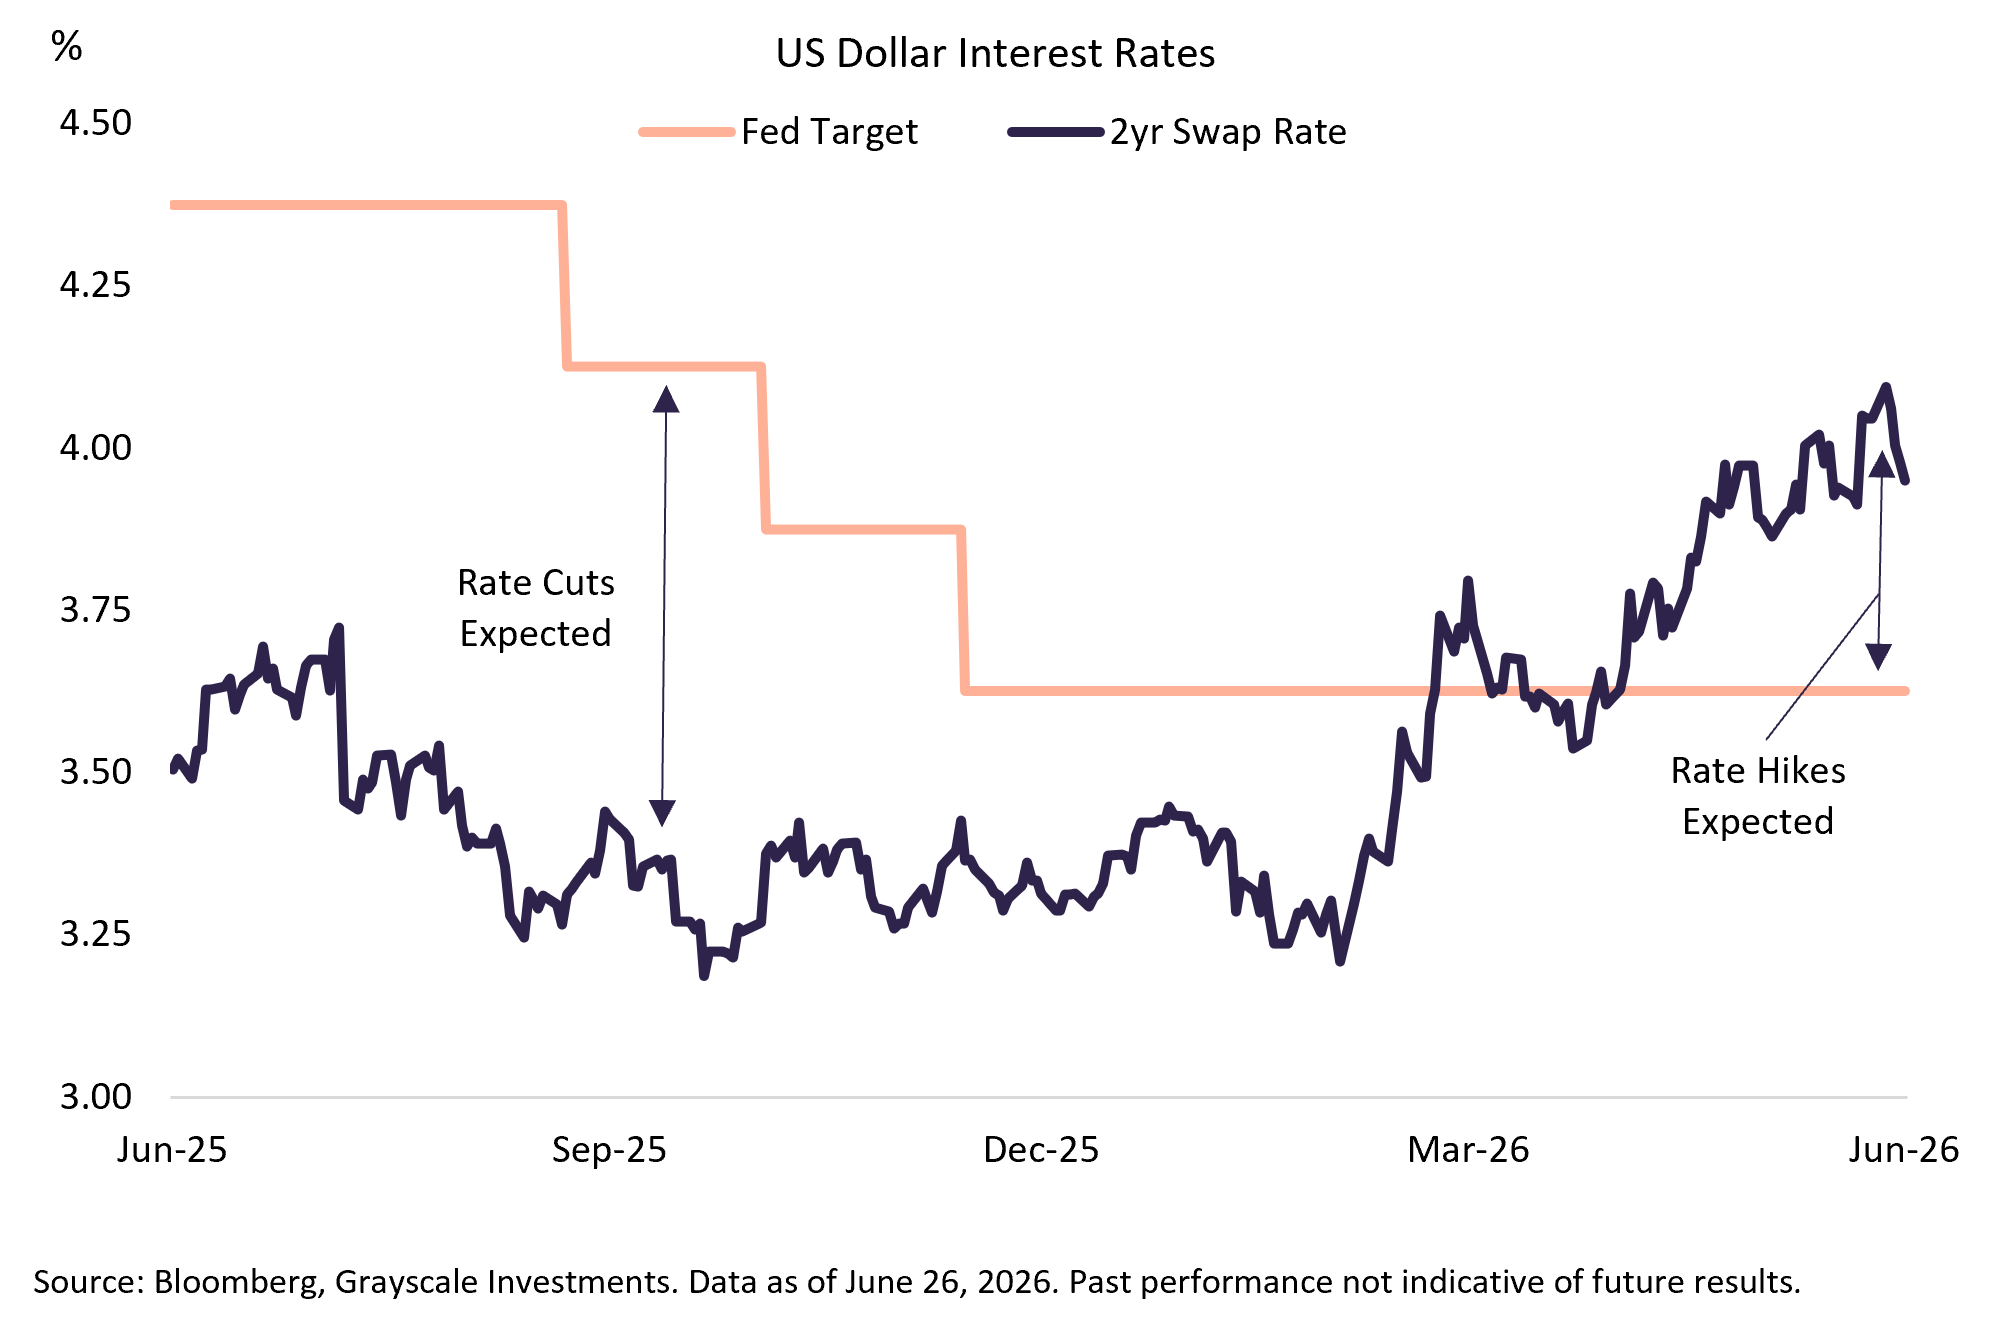
Figure 2: The market now expects the Fed led by Warsh to raise interest rates. The orange line is the Fed target rate, and the dark line is the 2-year swap rate. In the left half, the swap rate is lower than the target rate (market expects rate cuts), and after March 2026, the swap rate surpasses the target rate and continues to rise (market expects rate hikes).
Data Source: Bloomberg, Grayscale Investments, as of June 26, 2026. Past performance does not represent future results.
Besides the shift in Fed expectations, the crypto market is currently grappling with three things: first, uncertainty over whether the CLARITY Act can pass; second, pressure on Strategy's leveraged balance sheet; third, investor concerns about digital asset security risks posed by quantum computing.
Meanwhile, improvements in the regulatory environment continue to drive institutional adoption of public chain technology. We believe this is the most important structural trend in the digital asset market. Just this month, the CFTC approved the first batch of perpetual futures in the US market; the growth of stablecoins and tokenized assets will provide support for many top public chains. The broader social and political underlying logics behind crypto assets are also still present: unrestrained expansion of government debt, declining public trust in intermediaries, and the rise of AI. AI may spawn demand for alternative payment systems, and also spawn demand for technology capable of defending human sovereignty.
Broadly, we see two paths for Bitcoin to exit this bear market (Figure 3). The baseline scenario is: the CLARITY Act passes the Senate, Strategy takes measures to strengthen its balance sheet, and the Fed holds off on raising interest rates. If upcoming news moves in this direction, Bitcoin price may already be not far from the bottom. The downside scenario is: the CLARITY Act fails to pass this year, Strategy and other DATs (Digital Asset Treasury companies) further deleverage, and the Fed is forced to raise interest rates due to stubborn inflation. If downside risks materialize, Bitcoin may still explore lower levels moderately. In several historical cycles, Bitcoin price has fallen about 80%, but we do not believe the peak-to-trough pullback in this cycle will be that deep, because this bull market itself rose relatively moderately, plus institutional demand for digital assets is stickier.
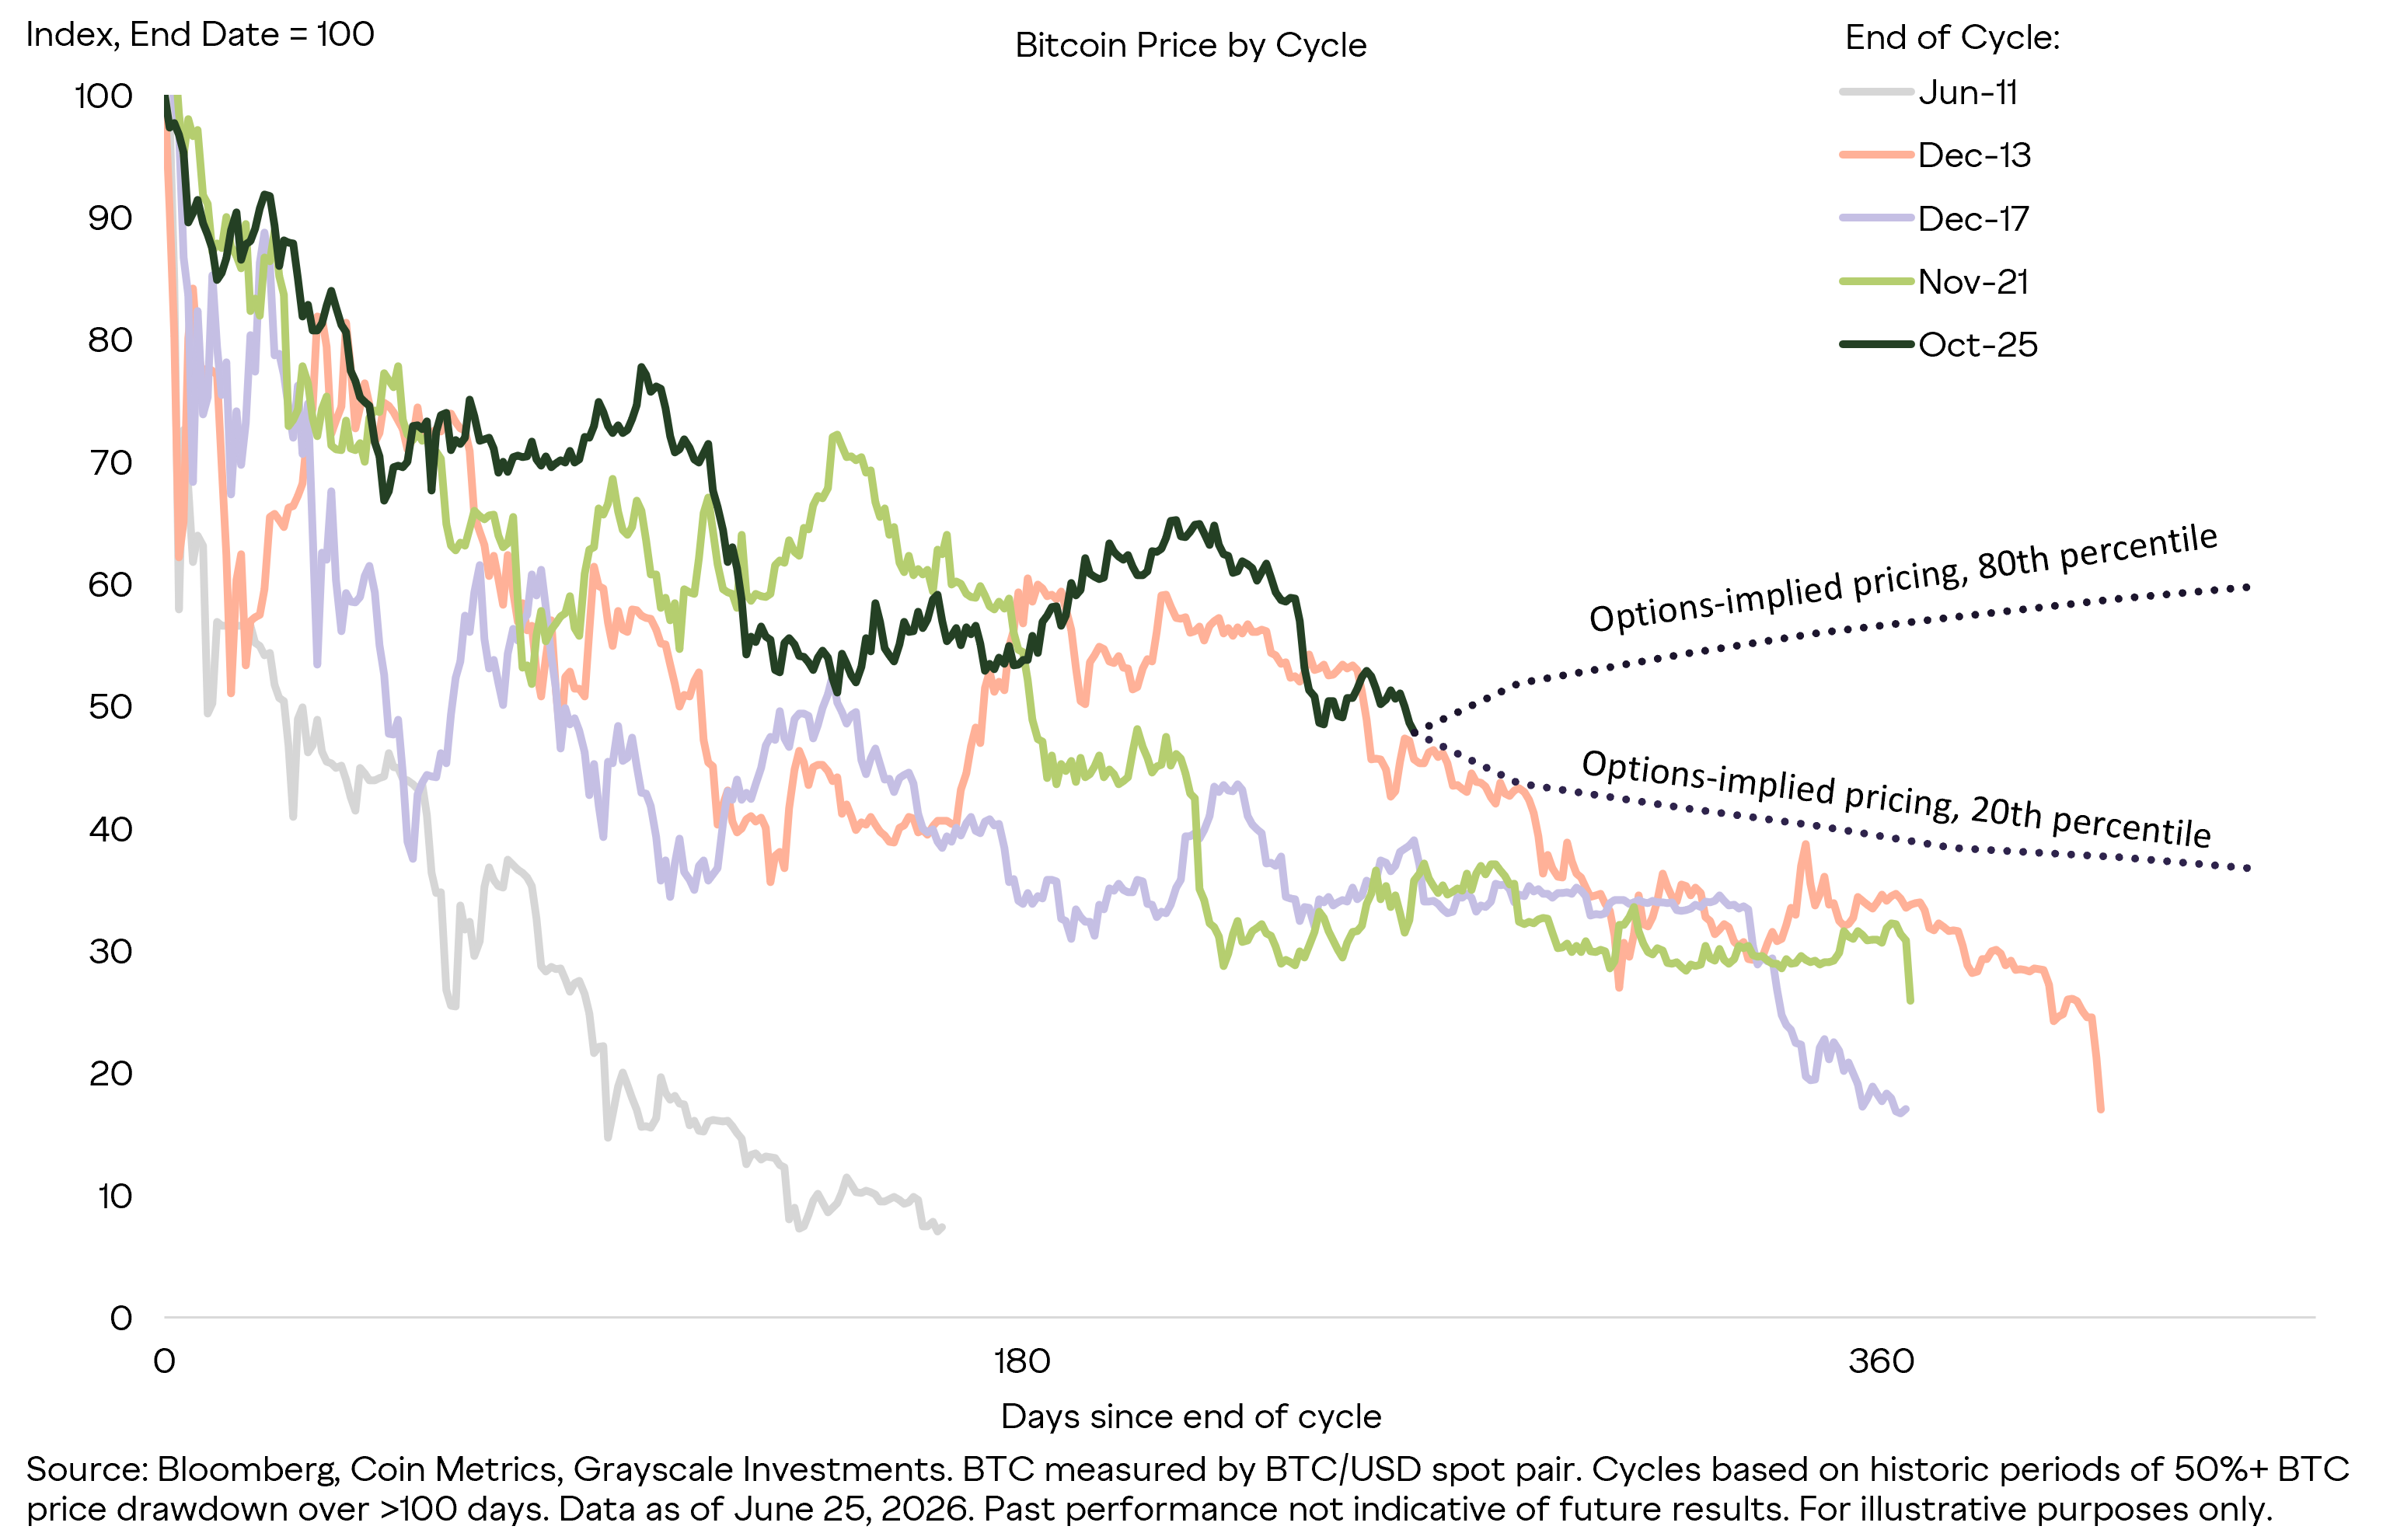
Figure 3: Two scenarios for Bitcoin exiting the latest bear market. The chart aligns the price trends of several historical cycles to the same starting point (Cycle End Date = 100), the horizontal axis is days after the cycle end. Gray is Jun-11, orange is Dec-13, purple is Dec-17, green is Nov-21, dark green is this cycle Oct-25. The two dashed lines on the right are the 80th percentile and 20th percentile paths priced by options, corresponding to the optimistic and downside scenarios above. The worst historical cycles (such as Jun-11, Dec-17) fell to only the 10-20 position.
Data Source: Bloomberg, Coin Metrics, Grayscale Investments, Bitcoin priced in BTC/USD spot, cycles defined as periods in history exceeding 100 days with a decline of over 50%, as of June 25, 2026. Past performance does not represent future results, for illustration only.
The Grayscale research team remains extremely optimistic about the medium-to-long-term prospects of crypto assets. It has been the best-performing asset class² over the past decade, and we believe it will be over the next decade as well. Investors will manage their portfolio risks around short-term catalysts to meet their respective needs. But in our view, the current bear market gives long-term investors a great opportunity to position early and bet on the structural growth of public chain technology and digital asset valuations over the next decade.
Core Conclusion: Whether Bitcoin price has seen the low point of this cycle depends on the next few catalysts, including the Fed's interest rate decision and the progress of the CLARITY Act in the US Senate. We see many structural tailwinds for crypto assets and believe current valuations are a very attractive entry point for long-term investors.
¹ Considering the difference in their relative volatility (gold 22%, Bitcoin 47% over the past two years), a 25% decline in gold roughly corresponds to a 40-50% decline in Bitcoin.
² Asset classes are represented by the following indices: S&P 500 Total Return Index (US Stocks), Dow Jones US Real Estate Total Return Index (Real Estate), S&P/GSCI Total Return Index (Commodities), Bloomberg US Aggregate Bond Index (US Bonds), MSCI Emerging Markets Total Return Index (Emerging Market Stocks), Bloomberg US Treasury Index (US Treasuries).
Join TechFlow official community to stay tuned
Telegram:https://t.me/TechFlowDaily
X (Twitter):https://x.com/TechFlowPost
X (Twitter) EN:https://x.com/BlockFlow_News