1kx Research Report: Assessing Node Operator Costs Is the Key to DePIN Projects
TechFlow Selected TechFlow Selected
1kx Research Report: Assessing Node Operator Costs Is the Key to DePIN Projects
DePIN founding teams must help node operators optimize costs.
Author: 1kx
Compiled by: TechFlow
Executive Summary
-
Key Takeaways
-
What is DePIN and why discuss costs?
-
Proposed framework for cost estimation:
-
Step 1: Identify network contributors
-
Step 2: Assess cost components
-
Step 3: Evaluate cost structure differences and aggregate
-
Appendix with examples
Key Takeaways
-
To ensure continuous participation in decentralized physical infrastructure networks (DePINs), network managers (founders, DAO members, etc.) must consider the costs incurred by node operators.
-
In some cases, cost-optimization decisions are straightforward. For example, Livepeer's move from Ethereum to Arbitrum in 2022 reduced settlement costs by over 95%. For DePIN managers with limited R&D resources, external assistance may help assess node operation costs.
-
If nodes operate at a continuous loss, operators will stop running them, reducing overall node supply. Understanding operational costs of a DePIN network and its primary drivers enables network operators to initiate governance discussions; cost estimates can also guide R&D efforts aimed at reducing node operating costs to prevent declines in network service supply.
-
Estimating network operating costs can be difficult for protocol managers because contributors are often anonymous (these networks are typically permissionless, meaning anyone can join or leave at any time) and lack publicly available data related to costs.
-
To guide managerial decision-making, we propose a framework for cost estimation:
-
Beyond providing an overall estimate of current costs, this framework also offers:
-
Detailed breakdowns per role and cost component, helping identify major cost drivers
-
Indications of how these change under different assumptions about demand growth or network capacity expansion
-
Examples will demonstrate how to apply this framework. For instance, joint research with POKT Network revealed persistent challenges for node operators in scaling service nodes. However, they overcame barriers related to economies of scale (including demand generation) through decentralized gateways.
Introduction: What Are DePINs and Why Discuss Costs?
DePINs are decentralized networks composed of nodes that provide hardware resources (physical infrastructure) for various applications such as computing, storage, wireless connectivity, or data measurement. DePINs use Web3 incentive models (i.e., token reward systems) to incentivize the creation of physical infrastructure networks. As of May 2024, the total market capitalization of all DePIN tokens is $29 billion.
DePINs contribute to both digital and physical resource networks:
-
In Physical Resource Networks (PRNs), contributors deploy location-dependent hardware to deliver (non-fungible) services. This includes:
-
Wireless networks (e.g., Helium, World Mobile, XNET, Nodle)
-
Sensor networks (e.g., Dimo, Hivemapper, Silencio, Onocoy)
-
Energy networks (e.g., Starpower, PowerLedger, Arkreen)
-
-
In Digital Resource Networks (DRNs), contributors direct hardware to provide (fungible) digital resources where physical location is not a primary factor. This includes:
-
Computing (e.g., ICP, Livepeer*, Akash Network, POKT Network*, Covalent*, Lit protocol*)
-
Bandwidth and privacy (e.g., NYM*, Hopr, Orchid, Mysterium, Fleek)
-
Artificial Intelligence (e.g., Bittensor, Fetch.ai, Modulus Labs*)
-
Early DePIN projects generated significant interest due to their token design frameworks. For example, Helium rewarded contributors with HNT tokens to help run wireless networks via hotspots, while Filecoin allows users to rent out excess storage space. While this was sufficient to launch many DePIN projects, token rewards alone may not guarantee long-term node participation.
If operating nodes becomes unprofitable, node operators will no longer have incentives to maintain DePIN infrastructure. Therefore, DePIN founding teams must assist node operators in optimizing costs.
The DePIN Flywheel
A typical DePIN tokenomics flywheel works as follows:
-
Build the supply side of the service, e.g., storage or 5G antennas
-
Inflationary token rewards incentivize node operators to provide necessary infrastructure when demand alone is insufficient to cover costs
-
As demand grows, monetization through network activity may increase node operator revenues even as token rewards decrease
-
Ongoing monetization of network activity and increased node operator income further incentivize supply, creating a DePIN flywheel
Diagram of the DePIN flywheel:
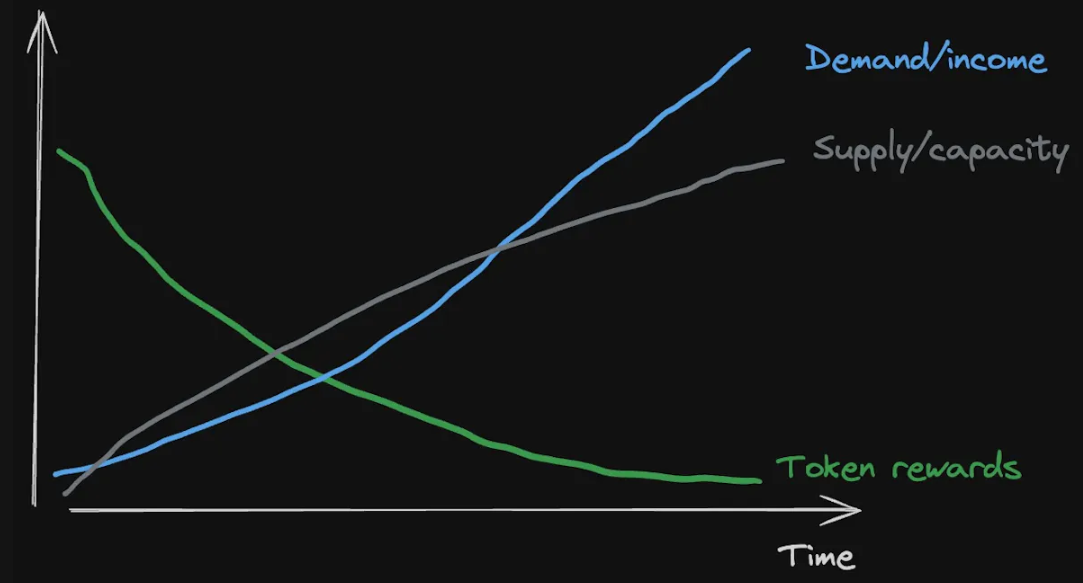
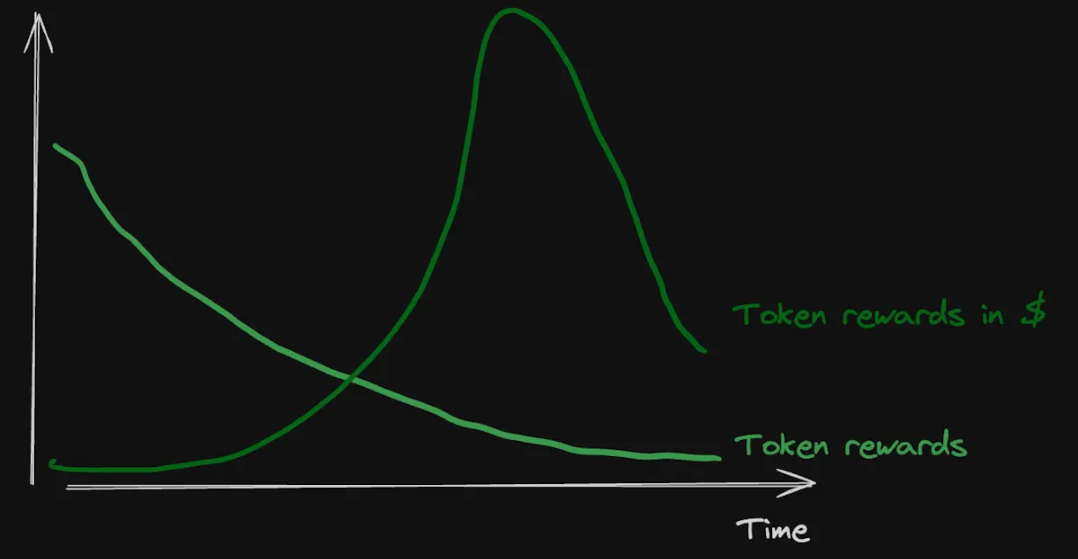
As described in our analysis of reward emission schedules, the dollar value of these token rewards (token price) is largely influenced by overall market sentiment. Thus, they may look like this:
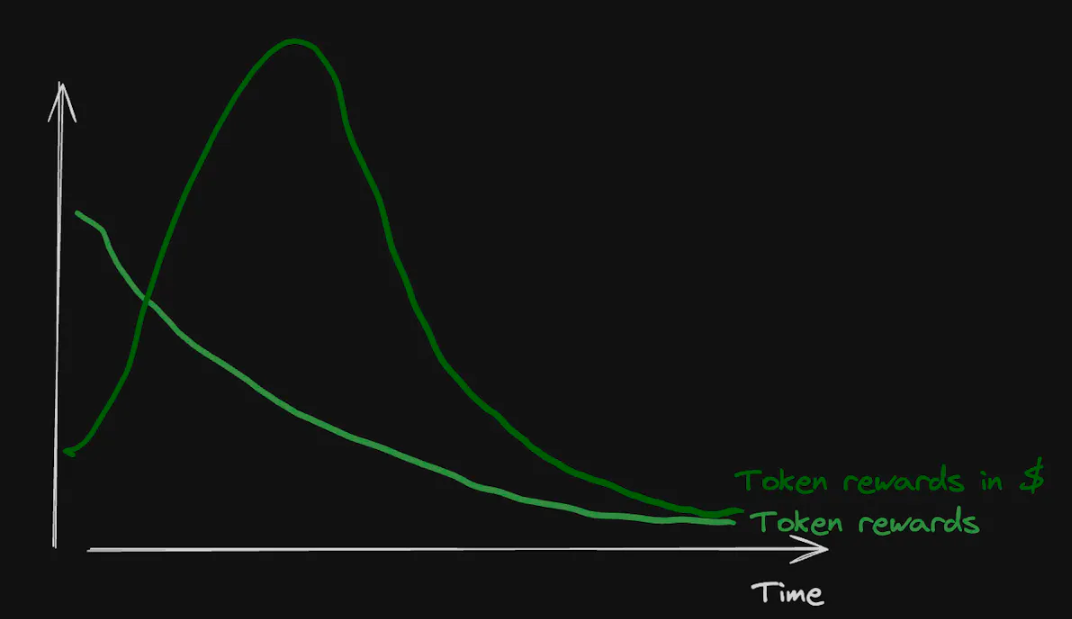
Or like this, depending on when you entered the bull market:
So, what does token emission have to do with costs?
As mentioned above, if token rewards and user demand revenue are insufficient to break even, node operators may stop supporting the network. Most operational expenses of DePINs are paid in fiat currency, making the dollar value of token rewards important and tied to overall market performance. Even with well-designed token emission schedules, worst-case dynamics could look like this:
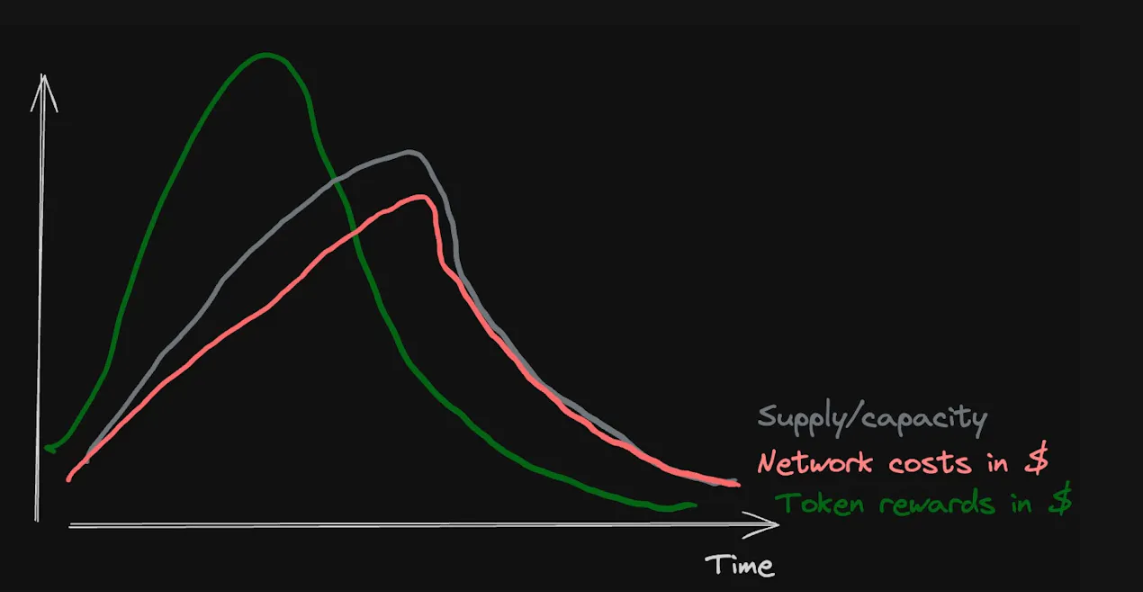
This would lead to node operator exits, resulting in higher latency, lower reliability, and degraded user experience. Ultimately, stagnant demand would shut down the flywheel.
The good news is there are multiple ways to address this situation. One approach is to make token emissions more flexible, aligning them better with network monetization (see KPI-based emissions). Another method is addressing cost issues directly—making the overall network more efficient and less sensitive to token price drops. Our approach would look like this:
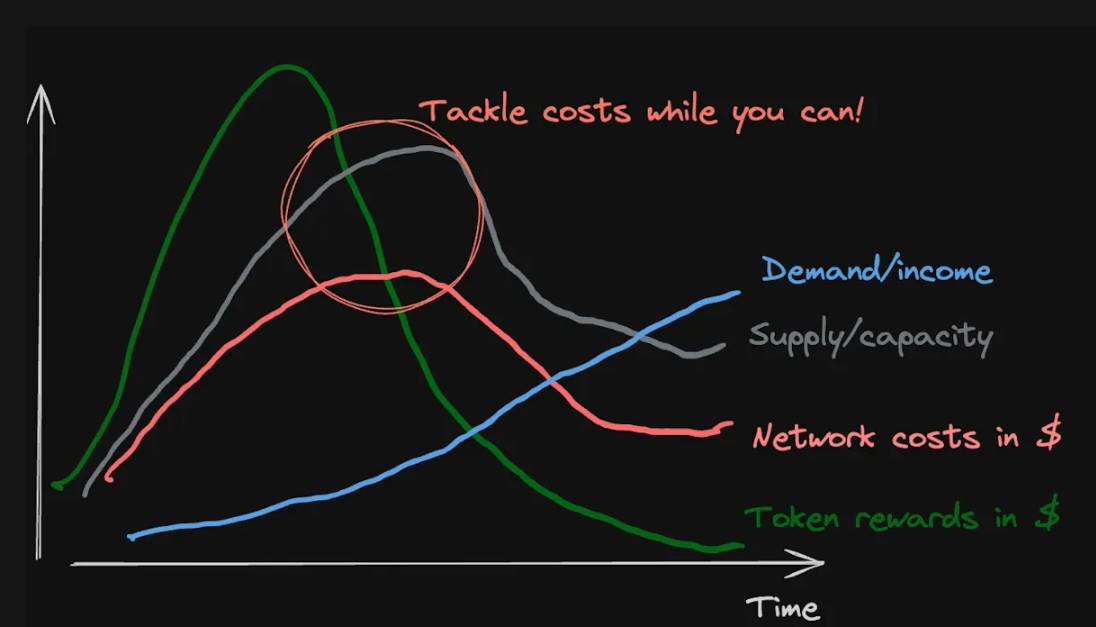
Key Proposition: If you understand the operating costs of your DePIN network and its main drivers, you can initiate governance discussions and R&D initiatives to reduce node operating costs and prevent declines in network service supply.
Given the decentralized and permissionless nature of DePINs, assessing cost bases is not straightforward. While token-based rewards and revenues are usually tracked on-chain, other node operation costs are not public (e.g., infrastructure bills). This means we need to rely on assumptions and estimations based on available data points.
In this article, we tackle this challenge and walk you through the estimation framework.
-
Step 1: Network Contributors
-
Step 2: Cost Components
-
Step 3: Evaluating Cost Structures of Network Contributors
Framework
We propose the following framework for DePIN network managers as a method to evaluate the operational costs involved in running infrastructure nodes.
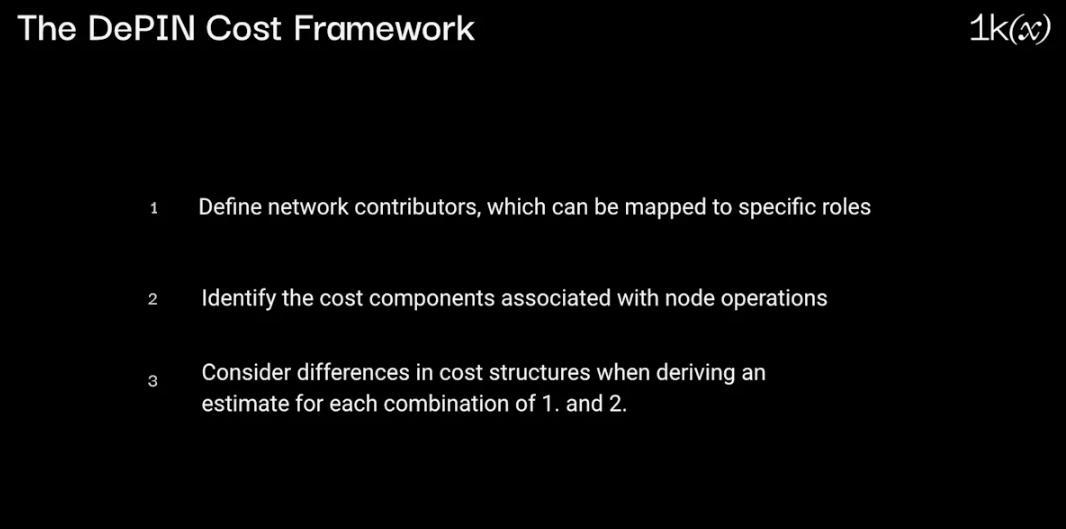
Using this framework, DePIN cost estimation involves three steps:
-
Identify network contributors
-
Evaluate cost components (e.g., hardware, labor)
-
Evaluate the above cost structures and aggregate into an overall cost estimate
Step 1: Identify Network Contributors
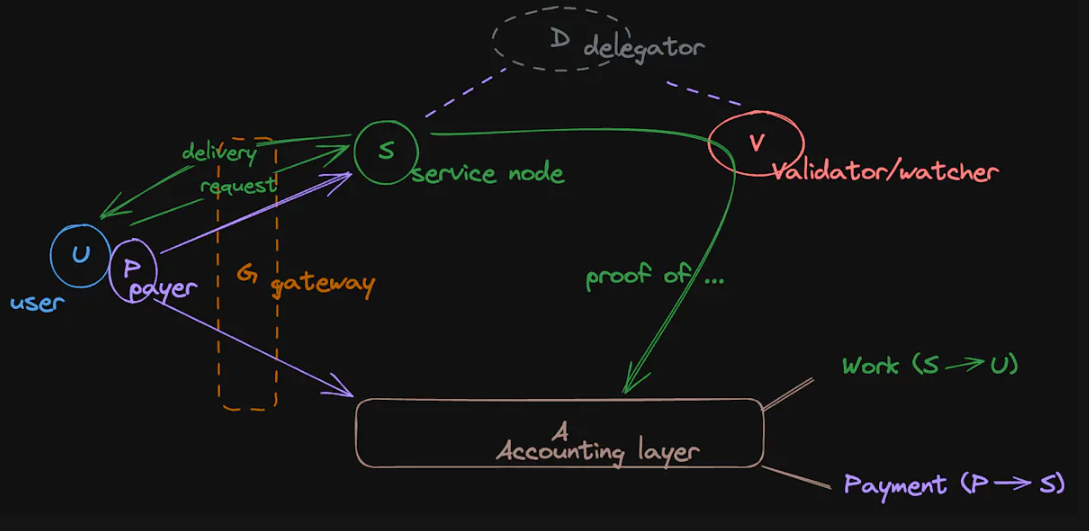
Although DePINs offer various services (e.g., computing, network coverage, mobile data, etc.), the roles required to deliver these services are consistent across networks (see overview of DePIN supply-side roles across 30+ networks):
-
Service Nodes / Producers: They provide the service and the required physical infrastructure (e.g., servers, antennas, dashcams, etc.). Examples include Filecoin storage providers, Helium hotspots, or Livepeer transcoders.
-
Validators / Observer Nodes / Fishermen: They verify work completed by service nodes either directly or via a ledger layer. These verification results are then sent to the ledger layer. Examples include Filecoin storage providers (who also validate proofs from other providers), and Helium hotspots and oracles (which perform proof-of-coverage checks for other hotspots).
-
Ledger Layer: Tracks the flow and status of delivered work/services and corresponding payments. Note that protocols define their own ledger logic—how work and payments are tracked and stored on-chain (we'll explore this in another article). Examples include Livepeer on Arbitrum or POKT Network’s POKT chain (operated by POKT validators).
-
Gateways: Act as coordinators/load balancers between users, service nodes, and the ledger layer when managing access or aggregating services (e.g., sensor data). Examples include Livepeer coordinators or POKT Network gateways.
-
Delegators: Can participate economically in service nodes or observer nodes through staking.
Roles related to the demand side (such as sales teams) are still uncommon, and evaluating associated protocol operation costs, such as governance expenses, is a separate topic.
Note that not every DePIN has delegation or gateways, and not all roles need to be separated. For example, Filecoin storage providers (SPs) are classified as both service nodes and validators and also operate the Filecoin chain, thus forming the ledger layer. The same applies to Arweave miners.
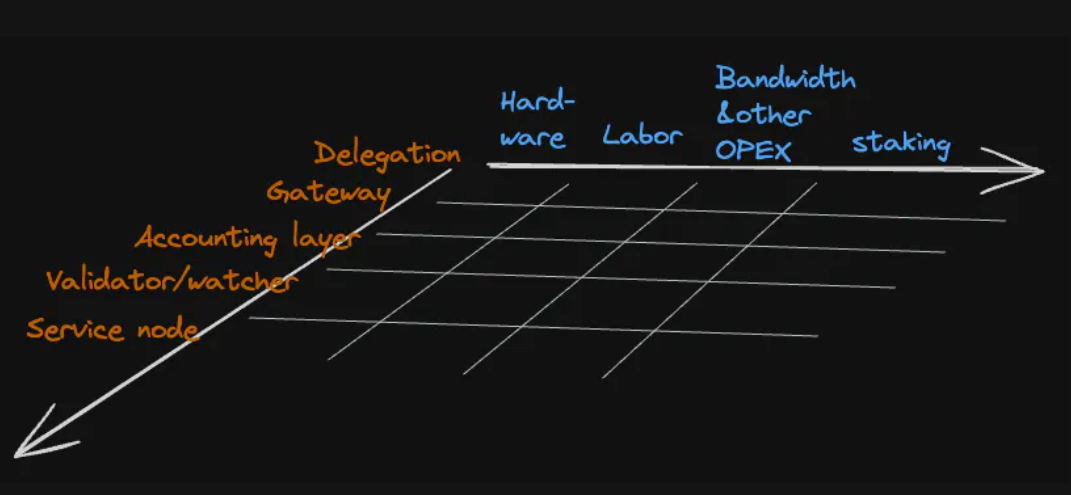
Step 2: Evaluate Cost Components
Each of the above roles can be executed via nodes whose costs stem from one or more of the following four components (most involve multiple components):
-
Hardware / Infrastructure: Costs associated with actual physical infrastructure, such as dashcams
-
Labor: Time cost associated with setting up and operating infrastructure
-
Bandwidth, Power, and Other Operational Expenses: Costs related to data exchange and other operations, such as electricity, data center leasing
-
Staking: Opportunity cost of funds not invested elsewhere
The last point relates to capital cost: broadly speaking, it's nearly impossible to obtain information on debt/financing costs associated with these operations. However, we can assess one part of capital cost: many DePINs follow a "stake-for-access" (work token) model, requiring node operators to stake tokens to qualify for participation. Acquiring these tokens represents an investment; even if we assume the amount can be reclaimed upon leaving the network, holding these tokens carries an opportunity cost compared to investing the funds elsewhere.
Our assessment of cost composition would be incomplete without considering transaction-related costs tied to the ledger layer. Evaluating this isn't simple—it depends on several dynamic factors. Generally, networks determine the extent to which bookkeeping occurs off-chain. But for on-chain records and transactions on the settlement layer, there are three options:
-
Proprietary L1: The network runs its own blockchain. Examples include Arweave, Filecoin, and POKT Network. Typically, service and validator nodes also cover this role, so related costs are included (though we try to separate them when possible—see POKT Network example).
-
Proprietary L2, better known as appchains or application-specific rollups: Rollup infrastructure (e.g., sequencers) and adjacent infrastructure (e.g., block explorers, wallet integrations) costs can generally be mapped to the four components. Less clear cases, such as using rollup-as-a-service (RaaS) providers, are mapped to bandwidth and other costs.
-
Public L1/L2: Outsources the settlement layer, meaning the network doesn't pay hardware or labor costs. However, service and validation nodes (and users/payers) directly pay usage fees. There are challenges in assessing network-related costs of these transactions, hence limitations: Not all transactions relate to the ledger layer (e.g., swaps or other DeFi trades), but separating them is often difficult. We map these costs to bandwidth and other costs.
Putting all these pieces together to create a cost estimate is a challenging task. We not only need to estimate each cost component for each role in the network, but also account for the fact that not all node operators have identical cost structures. Determining an overall cost estimate is far more complex than simply multiplying the number of network node operators by the estimated cost of a single operator.
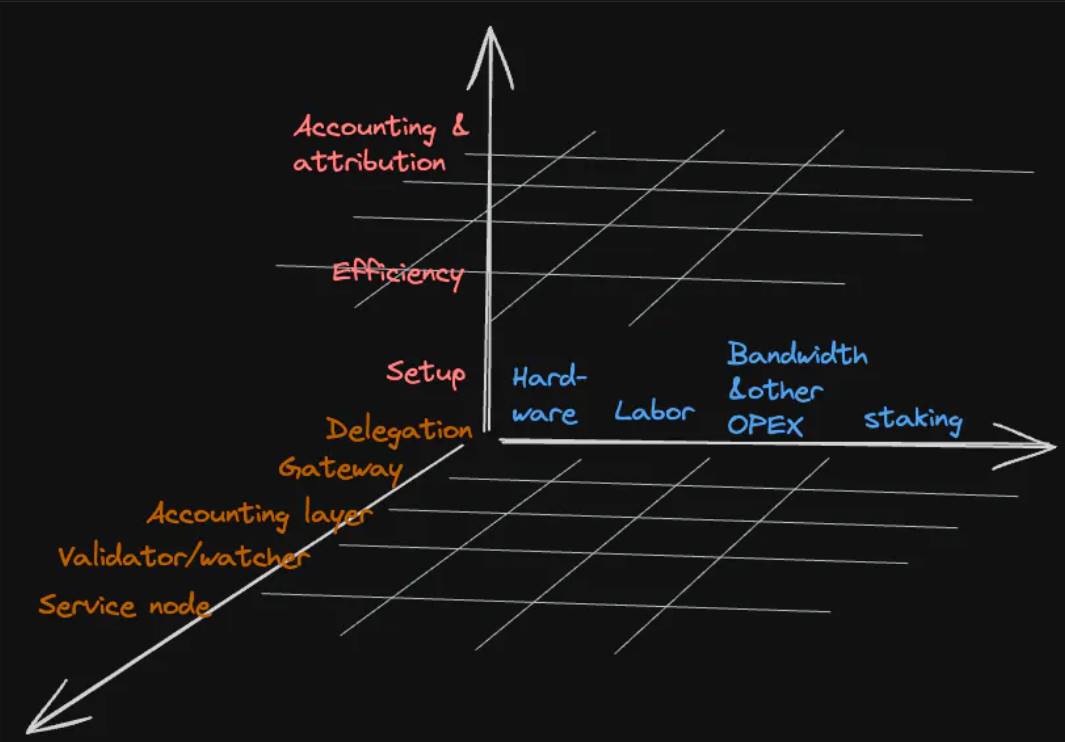
Step 3: Evaluate Cost Structure
When discussing cost structure, we refer to key differences affecting costs. These critical variations necessitate reliance on assumptions. Of course, this involves trade-offs: making assumptions simplifies the process but may sacrifice accuracy. Nonetheless, given the numerous factors involved, certain assumptions are necessary to achieve a feasible theoretical model.
Three main considerations arise when evaluating cost structure:
-
Setup Differences: A typical example is one operator using bare-metal servers while another runs on cloud infrastructure (buying vs. leasing). When we know the corresponding share of nodes across the network, we can usually account for these differences. This also relates to capital costs, such as leasing or financing agreements. We recommend ignoring these differences and assuming no capital cost.
Another cost difference relates to purchase timing (storage gets cheaper over time, though buying H100s might not follow the same trend) or geographic location. We recommend accounting for timing by using current prices. For labor costs, location matters: DePINs can draw contributors globally, where local wage rates vary significantly. Nevertheless, in our framework version, we simplify by assuming a uniform hourly wage for all node operators.
-
Efficiency Differences: Node operators can have identical setups, yet one may achieve lower per-node costs due to economies of scale if they operate more identical nodes. In our framework, we need to assess the distribution of node operators as a first step to account for these effects. Then, we must understand and estimate cost impacts through surveys with large and small operators or by leveraging other available data points (e.g., advertised bulk discounts).
Another example is long-term supporters of the network who, compared to new entrants, are further along the learning curve and thus operate more efficiently. Unless we obtain direct data points from surveys, we ignore this aspect.
-
Attribution and Accounting Differences: Even if two node operators are identical in the first two aspects, their perception of contribution may differ, leading to different cost bases. For example, one treats participation as a side hustle and doesn't track time costs, while another treats it as a full-time business paying project-based wages. We account for these differences by assigning wider error margins to the "side-hustle" group (since they're typically underestimated), but assume similar time input per node across all operators (see economies of scale).
This relates to shared economies, common in DePINs: Operators can leverage the same setup across multiple networks (thus sharing hardware, labor, bandwidth, power, and other operational expenses). For example, Livepeer operates on both Ethereum and Filecoin, and io.net spans Render, Filecoin, and other GPU networks. In cases where hardware is crucial, we do not consider cost savings from shared economies. Not only are they hard to identify, but it's also difficult to quantify which network benefits most from cost reductions and how savings should be apportioned. On the accounting side, we aim to break down total costs into monthly amounts. To simplify, we assume a common cycle over which total amounts are depreciated and monthly lifecycle costs are evenly distributed across all node operators.
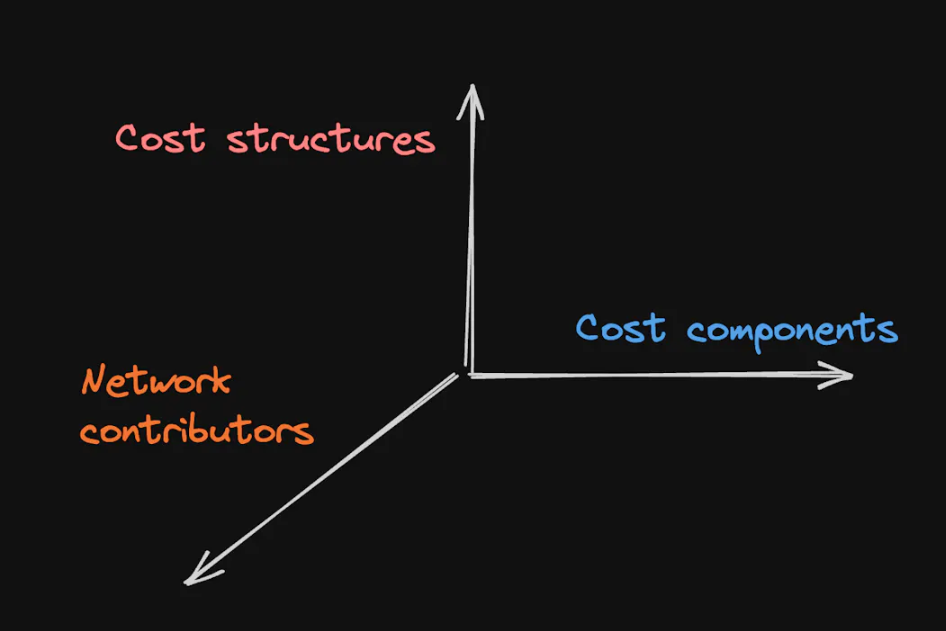
Of course, there are more nuances, which we will explore in detail in an upcoming in-depth article in the DePIN repository. This adds a third dimension to our "execution plan," considering sixty different combinations:
Overall, although this formula is very comprehensive and provides multiple cost structure options, it is most useful when applied across multiple time points rather than at a single static moment. The strongest models link operating costs to network capacity. This allows us to understand how costs change with shifts in capacity or utilization. Network capacity relates to the service provided—e.g., number of RPC requests for POKT, storage capacity for Arweave or Filecoin, or percentage of road network mapped for Hivemapper.
Note that this formula requires substantial publicly available information, which we recommend gathering from documentation provided by the network, forum/Discord posts, and, if feasible, surveys².
Conclusion and Next Steps
With the rapid development of DePINs, estimating cost components across various DePINs remains challenging. Beyond known hardware costs and power laws governing capacity changes over time, estimating crypto-specific costs (e.g., gas fees on settlement layers and throughput capacity) is not straightforward.
Understanding the relationship between current costs versus reward emissions and demand-side revenues, how major cost drivers shift under different assumptions, and how costs scale with increasing demand—all are valuable indicators.
To help guide governance decisions in DePIN economic design, cost estimates must be linked with reward emissions and usage revenues. While I plan to provide more examples of DePIN cost estimates, I welcome feedback on the proposed framework, its assumptions and simplifications, and potential improvements to cost estimation.
Appendix - Examples Illustrating the Framework
Livepeer Network
The Livepeer Network provides decentralized video infrastructure for live and on-demand streaming. Recently, Livepeer began enabling idle GPU resources for AI model training use cases (details here).
An example of applying the framework step-by-step is available here. Most cost estimates are based on a survey of node operators (i.e., Orchestrators) conducted in summer 2023 and community-sourced information (e.g., here).
The total estimated cost of running the Livepeer network is approximately $85,000 per month. A breakdown of average costs shows hardware and labor each account for roughly the same share (about 40%). Taking into account uncertainties in labor cost estimates as described in the spreadsheet, the monthly cost for 100 Orchestrators, their transcoders, and settlement on Arbitrum is around $40,000, with a low-end estimate also around $40,000. Notably, this $40,000 monthly cost is close to the current fee revenue of approximately 5–10 ETH per month (at ETH prices of $3–4K). However, Orchestrators do not have negative PnL because a large portion of their income actually comes from staking rewards³.
Notably, ledger layer costs are about 0.5–2 ETH per month, as Livepeer transactions settle on Arbitrum. This represents over 95% cost savings compared to pre-Arbitrum migration levels in Q1 2022. Moreover, transaction volume on Livepeer today is 2–3 times higher than before the Arbitrum migration. Relatively, the ledger layer now accounts for about 5% of costs, whereas previously it was the primary cost driver (about 80% of costs).
Recently, the algorithm allocating work has been adjusted to focus more on the price per pixel offered by Orchestrators. This has put downward pressure on transcode pricing and may help stimulate demand (see here), but discussions in the forum suggest price levels need to drop further. On the other hand, the recent launch of the AI subnet may help add additional monetization pathways for the network.
One potential scenario in the estimation spreadsheet is a 3x increase in transcode minute demand, with total costs rising only 20%. Notably, bandwidth is the primary driver of cost increases.
Assuming similar price levels (1 ETH = $3,000), this should be enough to bring the network into a breakeven range. However, if transcode prices drop by 50%, network-level fee revenue would be about $45,000/month—below the low end of cost estimates. With emerging use cases such as AI video generation (increasing monetization opportunities), it remains to be seen how cost and revenue dynamics on the Livepeer network will evolve.
POKT Network
At its core, POKT Network provides decentralized remote procedure call (RPC) endpoints. Recently, POKT Network announced expansion into more AI model inference scenarios.
An example of step-by-step framework application is available here. Most cost estimates are based on a survey of node operators in summer 2023 and follow-up interviews with them and gateway operators.
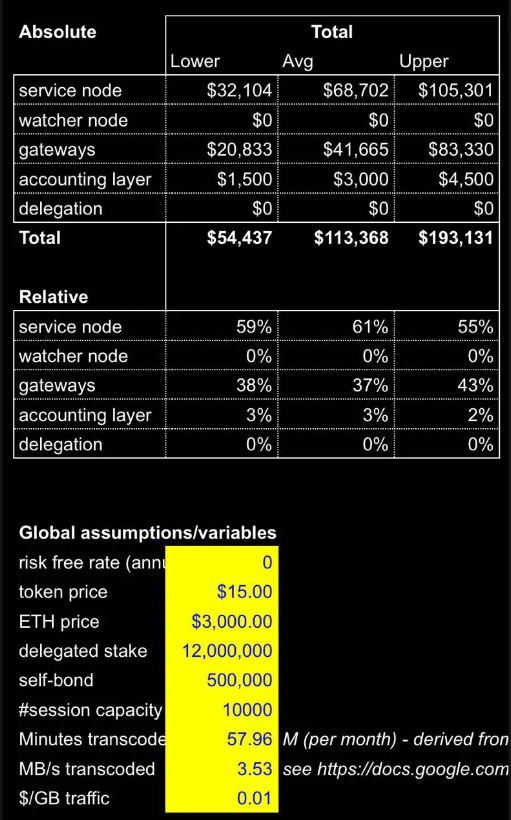
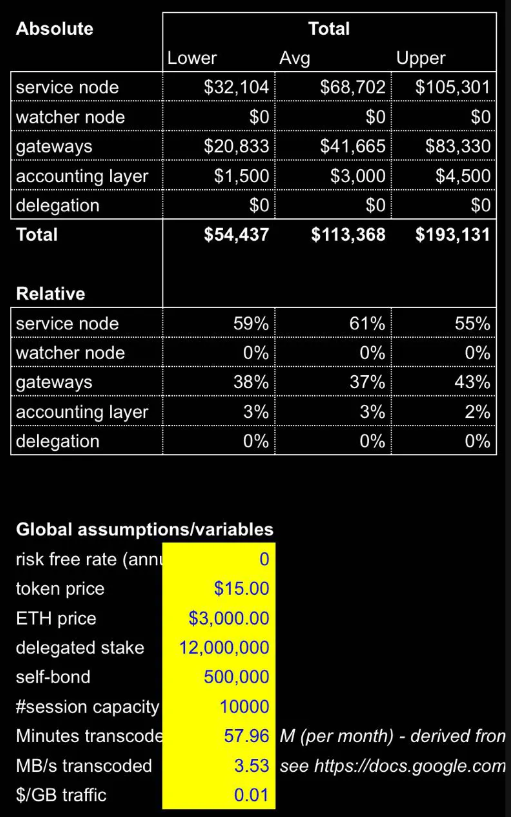
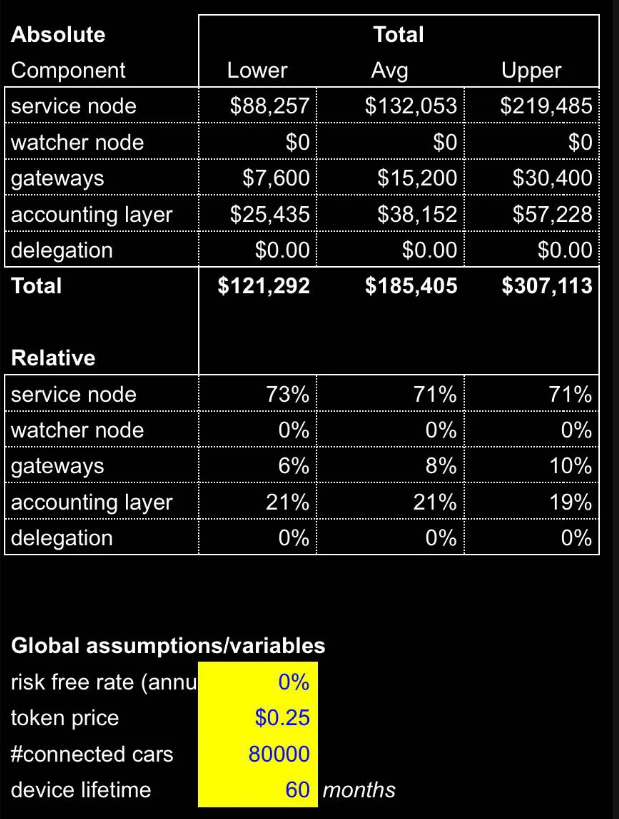
Based on approximately 15,000 nodes providing RPC endpoints and four gateway operators providing access, we estimate POKT Network’s current costs at around $200,000 per month (±$80,000) to serve about 500 million relay requests daily. Currently, service nodes account for the largest portion (about 75% of costs).
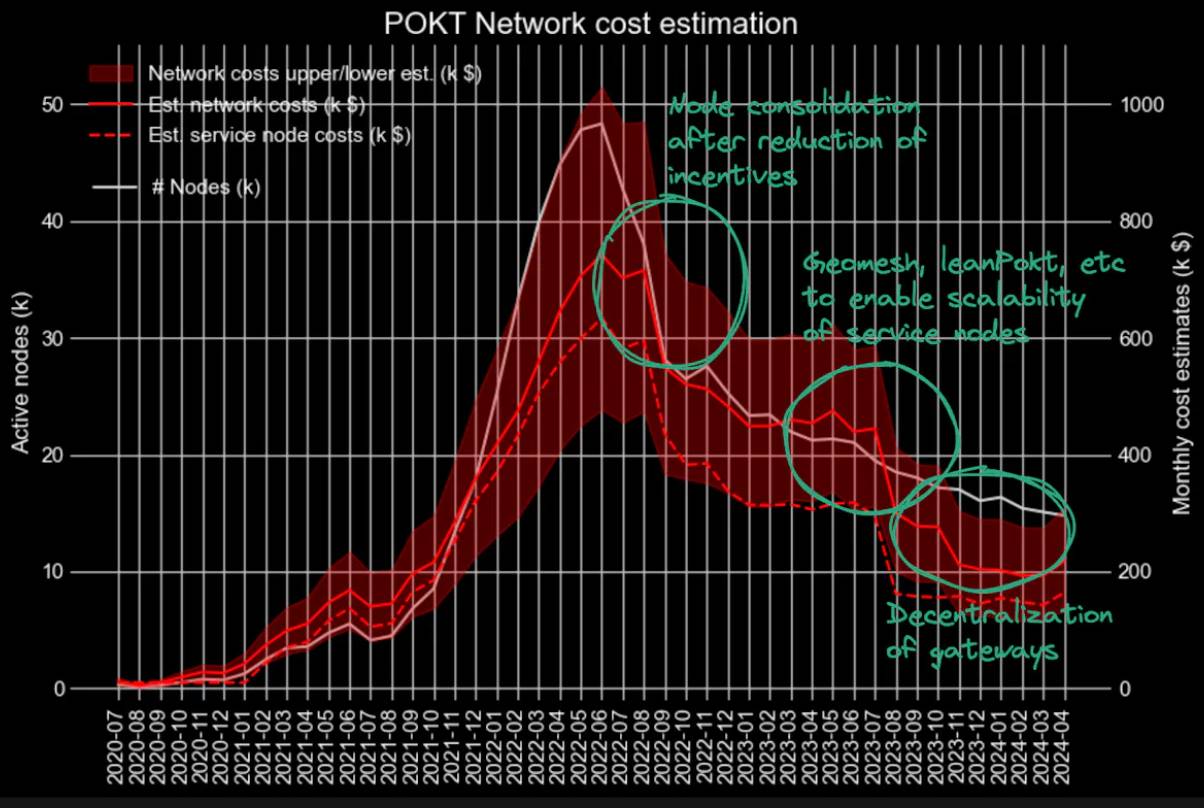
Because we have access to historical data on the number of active nodes in the network and data points on cost components at different time points, we can place network cost estimates on a timeline, showing three key periods of significant cost reduction:
-
Node consolidation after token reward reductions (especially USD-denominated rewards) during the mid-2022 bear market
-
Network-wide rollouts of improvements such as Geomesh and LeanPOKT that significantly reduced operating costs, alongside individual operator setup improvements
-
Decentralization of the gateway role, lowering bandwidth costs through simpler gateway setups
Because our cost framework links cost estimates to network capacity and demand, we can assess how cost structures change. For example, if demand increases from the current 500 million to 2.5 billion relay requests per day, gateways would account for 60% of total cost base (~$400K/month vs. current ~$200K). Note that this is a 2x cost increase despite a 5x demand increase. This is because service nodes can improve their setups, allowing increased demand to be met on a nearly unchanged cost base. If we further assume that the share of low-cost-base new gateways increases from the current 30% to, say, 50% of all relay requests, then the overall network cost would be $300K/month.
With gateway decentralization, gateway operators can individually set their pricing. If we assume an average price of $4 per million requests, POKT Network as a whole would earn $300K/month, thus breaking even⁴.
Dfinity/ICP
Dfinity / Internet Computer Protocol (ICP) is designed as a “blockchain of blockchains,” providing computational resources for smart contract execution (called Canisters), organized within subnets (details here). Its backbone consists of node machines that provide storage, compute, and bandwidth to replicate all Canisters, states, and computations within their subnet.
An example of step-by-step framework application is available here. Most cost estimates are based on data available in documentation and forum posts.
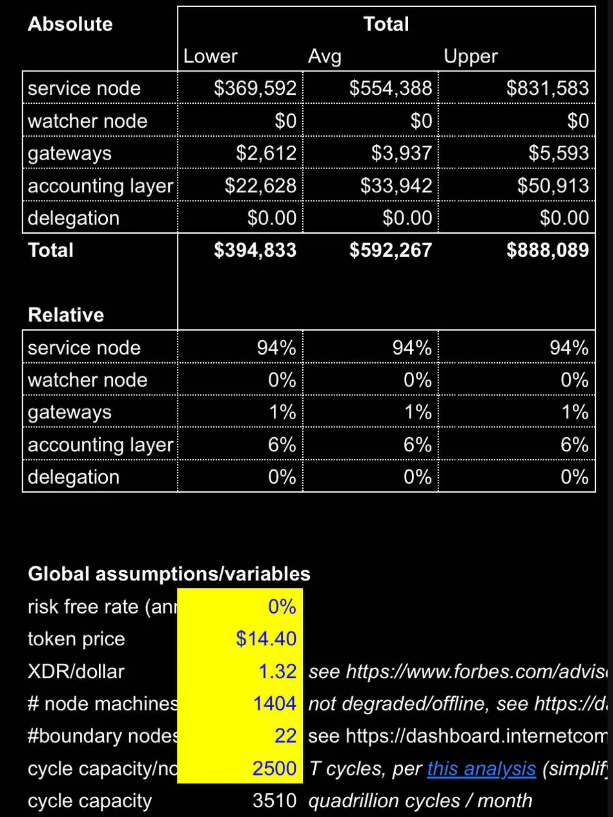
ICP is one of the few networks where fiat-based costs are incorporated into the token reward mechanism, making cost assessment easier. Currently, about 1,400 node machines are operated by approximately 85 operators. We lack data points on economies of scale for large operators, so our overall estimate range is quite wide: roughly $400K–$900K per month, averaging around $600K.
While revenue assessment deserves a separate article, we estimate current monthly revenue at about $25,000. Compared to estimated costs, this seems low—but it’s due to low utilization: only 559 node machines are currently active, so we estimate current demand (measured in cycle burn rate) accounts for only about 2% of total capacity. This means the network could withstand a 25x demand increase without increasing its current cost base. A forum post actually projects 15–25x demand growth over the next two years, which (all else equal) would bring ICP earnings to match these monthly costs.
DIMO
DIMO is a decentralized network enabling drivers to manage their vehicle data. At the same time, DIMO enables businesses and developers to build innovative mobility-related applications (and profit from them). Data collection occurs via special devices (e.g., Autopi , Macaron) or an app. While the above DePIN examples are digital resource networks, DIMO is the first physical resource network included in the analysis.
An example of step-by-step framework application is available here. Most cost estimates are based on (device) pricing information, Dune data, and forum posts.
For the ledger layer, we assume half of the average gas cost per vehicle of $0.6–$1.5 in Q1 2024 on Polygon is attributable to DIMO’s operations. For gateways, we assume associated hardware costs of about $4,000/month and labor costs of about $11,000/month. Overall, monthly expenditure is approximately $180,000, as shown in the table below. Most costs relate to bandwidth and other expenses, with about 1/3 linked to Polygon settlement costs and 2/3 attributed to assumed share from Smartcar integration.
We lack indicators of actual network revenue, but based on estimates of the global automotive data market and related revenues, current per-vehicle data revenue is approximately $150–$185, projected to grow to $500–$600 by 2030⁵. If DIMO can monetize 10–15% of this, resulting revenue would range from $110,000–$180,000/month, covering operational costs.
However, data monetization itself does not appear to be the protocol’s actual goal; instead, DIMO focuses on providing infrastructure to support applications on the network, reflected in recent discussions about DIMO node and token upgrades. Proposed changes could impact the above cost structure.
Join TechFlow official community to stay tuned
Telegram:https://t.me/TechFlowDaily
X (Twitter):https://x.com/TechFlowPost
X (Twitter) EN:https://x.com/BlockFlow_News