21Shares Report: What's Different About the Fourth Bitcoin Halving?
TechFlow Selected TechFlow Selected
21Shares Report: What's Different About the Fourth Bitcoin Halving?
Bitcoin shows renewed vitality after the halving.
Author: 21Shares
Translation: Peng SUN, Foresight News
TL;DR Net inflows into U.S. spot Bitcoin ETFs have exceeded $10 billion, holding over 400,000 BTC—surpassing the annual post-halving supply (approximately 164,000 BTC). The U.S. ETF market, valued at $7 trillion, is four times larger than Europe’s; just 1% allocation would double Bitcoin's market cap. Bitcoin supply is dwindling, with exchange balances now at 2.3 million BTC, a five-year low. Long-term holders (BTC held over 155 days) decreased their holdings from 14.9 million to 14.29 million BTC, accounting for nearly 70% of total supply, while short-term holder balances rose from nearly 2.3 million to 3.07 million BTC—an increase of over 33%. Despite reaching new all-time highs, whales holding more than 1,000 BTC have not sold off, signaling strong conviction in further upside potential. In contrast, during March and October 2021, whales sold heavily around $60,000 before BTC hit its peak. From an MVRV Z-score perspective, investors have been buying the rally over the past month, yet indicators still suggest we may be in the early stages of a bull market. Currently, NUPL averages 0.6, indicating the market hasn't reached extreme greed—largely because ETF inflows are pulling forward expected post-halving activity. If one applies historical patterns rigidly, Bitcoin could consolidate in the coming weeks. Bitcoin is no longer just a store of value; innovations like Ordinals, BRC-20 tokens, and Bitcoin L2s will drive additional demand and expand use cases.
In April 2024, Bitcoin将迎来 its fourth halving. Historically, prices performed exceptionally well within 12 months following each previous halving. However, this time appears different. At this juncture, Foresight News compiles key insights from 21Shares’ Bitcoin Halving Report, offering an in-depth analysis of the implications of the 2024 Bitcoin halving on the market, mining sector, and broader ecosystem.
What Impact Does Bitcoin’s Four-Year Halving Cycle Have?
Why Every Four Years?
While we don’t know why Satoshi Nakamoto chose a four-year halving cycle, it aligns with major events such as U.S. presidential elections, introducing periodic uncertainty into markets. Given that U.S. fiscal policy significantly impacts the global economy, Bitcoin’s halving can be seen as a deliberate mechanism to provide stability to a volatile traditional financial system during political transitions.
Of course, while not perfectly aligned, the four-year interval might serve as a psychological benchmark, similar to conventional economic cycles, elections, or major sporting events.
How Does Halving Affect Bitcoin Price?
The impact of Bitcoin halvings on price growth has diminished over time. After the first halving, Bitcoin surged approximately 5,500% in the subsequent cycle; after the second, about 1,250%; and in the current cycle, roughly 700%.
In other words, Bitcoin’s steady long-term appreciation reflects a maturing market. Explosive rallies are typically driven by hype and speculation, whereas sustained growth suggests increasing stability and broader adoption—similar to traditional assets like gold.
However, this cycle features a significant difference: exogenous demand from ETF inflows has propelled Bitcoin to new all-time highs before the halving, potentially setting up a unique growth phase. This may also stem from a supply shock, which we’ll explore further below.
How Does Halving Affect Miners?
Bitcoin halving affects miners in several ways, including reduced block rewards and shifts in profitability and operating costs—though these depend heavily on the prevailing Bitcoin price.
For example, although block rewards decrease, Bitcoin’s price may rise accordingly. Mining firms like Marathon and Core Scientific may refinance to avoid shutting down equipment.
Moreover, miners aren’t necessarily doomed. If some miners exit the network, mining difficulty drops, reducing electricity costs and improving cost efficiency. This encourages others to rejoin, increasing hash rate. Conversely, some miners may sell Bitcoin—we’ll examine this selling pressure using alternative metrics shortly.
What Do Miners Do Before Halving?
Miner deposits to exchanges are a key indicator. Typically, miners sell BTC to cover electricity and hardware expenses. However, in this halving cycle, miner selling has decreased compared to prior cycles.
Throughout February 2024, miners deposited an average of 127 BTC per day to exchanges—nearly 70% less than the previous cycle. Between February and March 2020, miners deposited 417.4 BTC daily. It’s important to note that miners pay operational costs in USD, and rising BTC prices post-ETF approval have helped reduce their need to sell.
Halving Effect: The Four-Year Compass for Bitcoin
Historically, Bitcoin has performed very well in the 12 months following each halving. On average, it took 172 days post-halving to surpass the prior all-time high (ATH), followed by another 308 days to reach the new cycle peak.
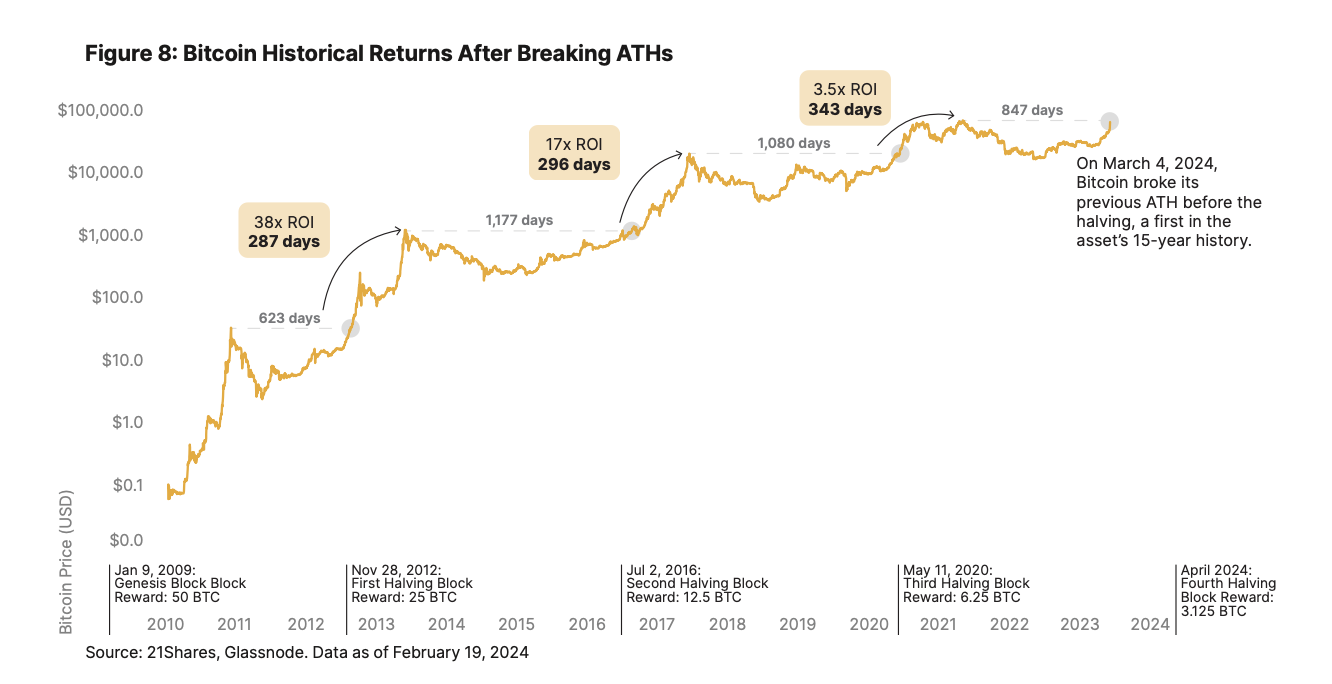
However, since Bitcoin is currently trading near its ATH, this cycle may diverge. Previously, Bitcoin traded 40%-50% below the prior peak in the weeks leading up to halving. Additionally, Bitcoin posted its strongest monthly candle ever in February.
What’s Different This Halving Cycle?
This Bitcoin halving seems different—more institutions are adopting Bitcoin, and its use cases are expanding. Let’s analyze current supply and demand dynamics to better understand these differences.
Demand Side: ETF Buying Pressure
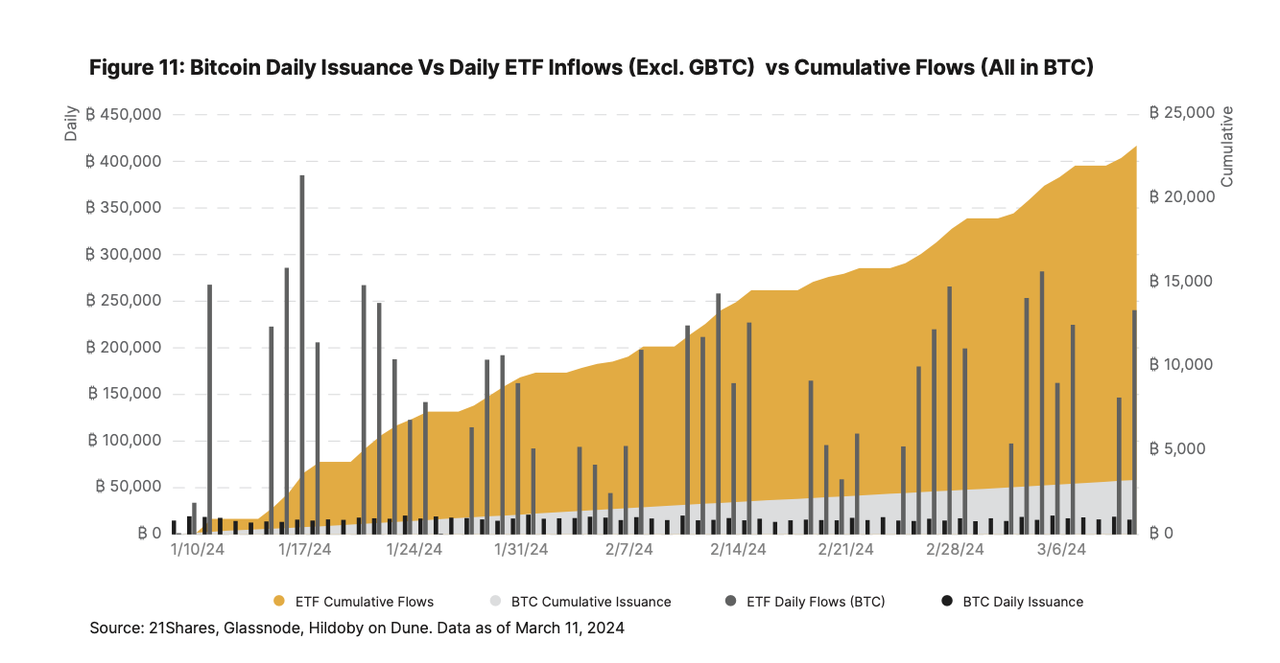
As Bitcoin continues to rise, interest from U.S. spot ETFs has grown substantially, drawing over $10 billion in net inflows so far. The 14-day average inflow is about 2,500 BTC (~$150 million), triple the daily newly mined supply (900 BTC), and will be nearly 5.5 times higher post-halving (450 BTC).
As shown below, ETFs now hold over 400,000 BTC—exceeding Bitcoin’s annual post-halving issuance (~164,000 BTC). Furthermore, according to Glassnode’s average of highly liquid and liquid assets, plus short-term holder supply and exchange balances, current demand already covers about 4.5% of Bitcoin’s available supply, totaling approximately 4.7 million BTC.
Additionally, the U.S. ETF market, worth $7 trillion, is four times larger than Europe’s. Prior to ETF approval, 77% of asset managers were unwilling to invest in Bitcoin. In the U.S., registered investment advisors manage around $114 trillion in assets and are required to wait 90 days after a new product launch before investing. Therefore, even a 1% allocation to Bitcoin would trigger massive inflows, doubling its market cap and tightening supply further.
Currently, banks like Wells Fargo and Merrill Lynch are already offering spot Bitcoin ETFs to select wealth management clients, while Morgan Stanley is reportedly evaluating Bitcoin funds for its brokerage platform. Cetera is among the first wealth management firms to formally adopt Bitcoin ETF policies, signaling a new wave of institutional demand.
Supply Side: Declining Liquidity
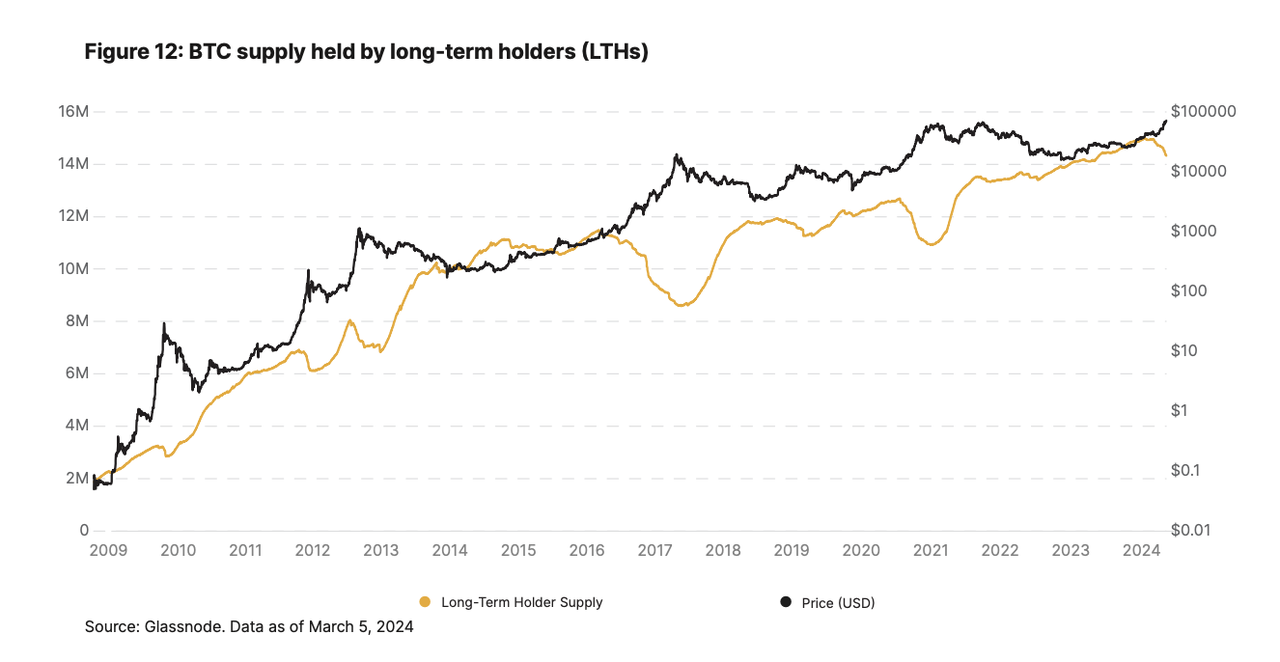
Investors holding Bitcoin for over 155 days demonstrate strong conviction. Long-term holder supply peaked at an all-time high of 14.9 million BTC in December, then declined to around 14.29 million BTC today—representing nearly 70% of total supply.
-
Similar to 2017/18 and 2020/21, long-term holders have gradually taken profits at elevated levels since ETF approval.
-
Despite the 4% decline in long-term holdings (from 14.9M to 14.29M BTC), short-term holder supply surged from ~2.3M to 3.07M BTC—a 33%+ increase. This balance between groups typically emerges in early bull markets post-halving but is now appearing earlier due to exogenous ETF demand, neutralizing market forces.
-
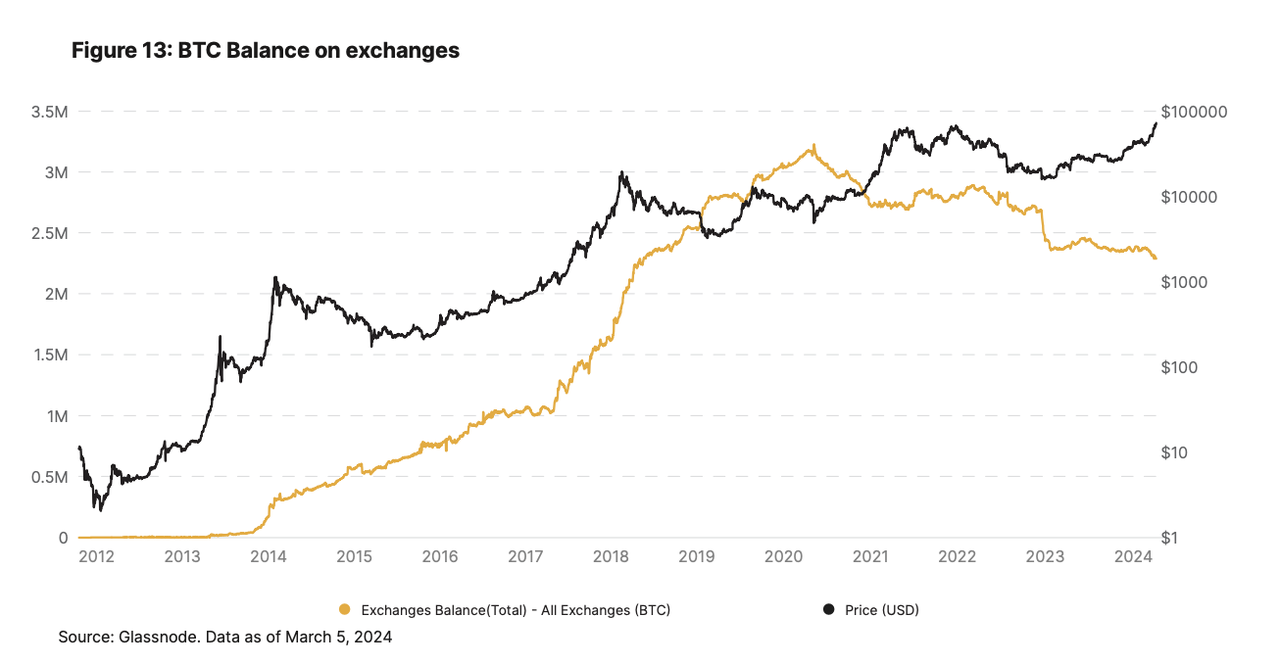
Under these conditions, exchange balances have dropped to a five-year low of 2.3 million BTC, underscoring rapidly declining supply liquidity.
-
If this trend continues, Bitcoin’s supply side will become increasingly illiquid, laying the foundation for tight supply conditions and a potential parabolic bull run.
On-Chain Changes Before Halving
Market-Value-to-Realized-Value Ratio (MVRV - Z-Score)
The Market-Value-to-Realized-Value (MVRV) ratio evaluates Bitcoin’s valuation by comparing its current market cap to its realized value. Realized value represents the total cost basis of all circulating BTC based on last movement prices—essentially the average acquisition price. The Z-score standardizes MVRV by measuring how many standard deviations the current value is from the historical mean. If market value significantly exceeds realized value, it signals overvaluation—a historical top indicator—and vice versa.
Bitcoin’s current MVRV Z-score is around 3, sharply lower than the ~6 seen in February 2021. However, compared to prior halvings, Bitcoin shows slight deviation—specifically in substantial price gains. The past 30-day average MVRV is 2.4, versus a 1.07 average across the previous three cycles at the same stage. This suggests recent investor momentum chasing, as realized price reflects the last transaction price of each BTC. Although MVRV is relatively high versus history, it still indicates we may be in the early faith-building phase of a bull market—especially since ETF approval may have pulled forward price action previously tied only to sentiment and halving narratives.
Net Unrealized Profit/Loss (NUPL)
A similar pattern emerges with Net Unrealized Profit/Loss (NUPL), which measures profitability by comparing current market value to original purchase prices—a strong market sentiment gauge where 0 indicates extreme fear and 1 indicates extreme greed.
Currently, NUPL averages 0.6, showing Bitcoin hasn’t reached peak greed—unlike the 0.7 average seen when BTC rose to $60,000 between February and March 2021.
However, comparing Bitcoin’s current average NUPL (0.6) to pre-halving periods (two months prior) in previous cycles (average 0.42) reveals growing bullish sentiment. This supports our view that ETF inflows are preempting post-halving expectations. If one strictly follows historical patterns, Bitcoin could consolidate in the coming weeks.
From on-chain data, this cycle is already behaving differently—and possibly shifted leftward in timing.
Halving Aligns With Favorable Market Structure
While 2024 is Bitcoin’s “halving year,” it coincides with several other tailwinds, creating a compelling mix of supply-demand dynamics:
-
Improving macro environment: The Federal Reserve has held rates steady in its last two meetings. According to the CME FedWatch tool, markets assign a 39% probability of at least one rate cut by June 2024, and 51.9% by December 2024. However, mixed inflation data maintains uncertainty around timing.
-
ETF buying pressure: Approval of U.S. spot Bitcoin ETFs is structurally favorable. Since launch, they’ve drawn over $10 billion in net inflows and now hold over 400,000 BTC—more than 240% above the annual post-halving issuance rate.
-
Long-term holders draining liquidity: If halving-induced supply reduction weren’t enough, long-term holders (investors who haven’t moved BTC in at least 155 days) held a stable ~14.29 million BTC as of March 15, 2024—about 70% of circulating supply.
-
New ATH, but whales remain calm: Despite remarkable gains since ETF launch, whales holding over 1,000 BTC have not sold during strength. Even at $60,000—a level where whales sold heavily in March and October 2021 before BTC peaked—investor confidence remains strong, suggesting belief in further upside. As of March 1, 99.6% of circulating supply was in profit, yet sentiment remains bullish.
-
In summary, considering all factors, the largest crypto asset appears fundamentally bullish. We conclude this cycle may indeed be slightly different. While investors should remain cautious—Bitcoin remains relatively volatile and subject to pullbacks—the conditions favor entry into a new bull market.
After the Halving
It’s often said Bitcoin only has store-of-value utility, but post-halving, Bitcoin continues to evolve with renewed vitality.
Fundamentally, innovations like Ordinals and BRC-20 tokens are expected to drive additional demand and expand use cases. This is crucial because it ensures miners can rely on transaction fees for sustainability as block rewards continue to decline toward 2140. Due to Bitcoin’s limited block size, rising transaction demand increases fees.
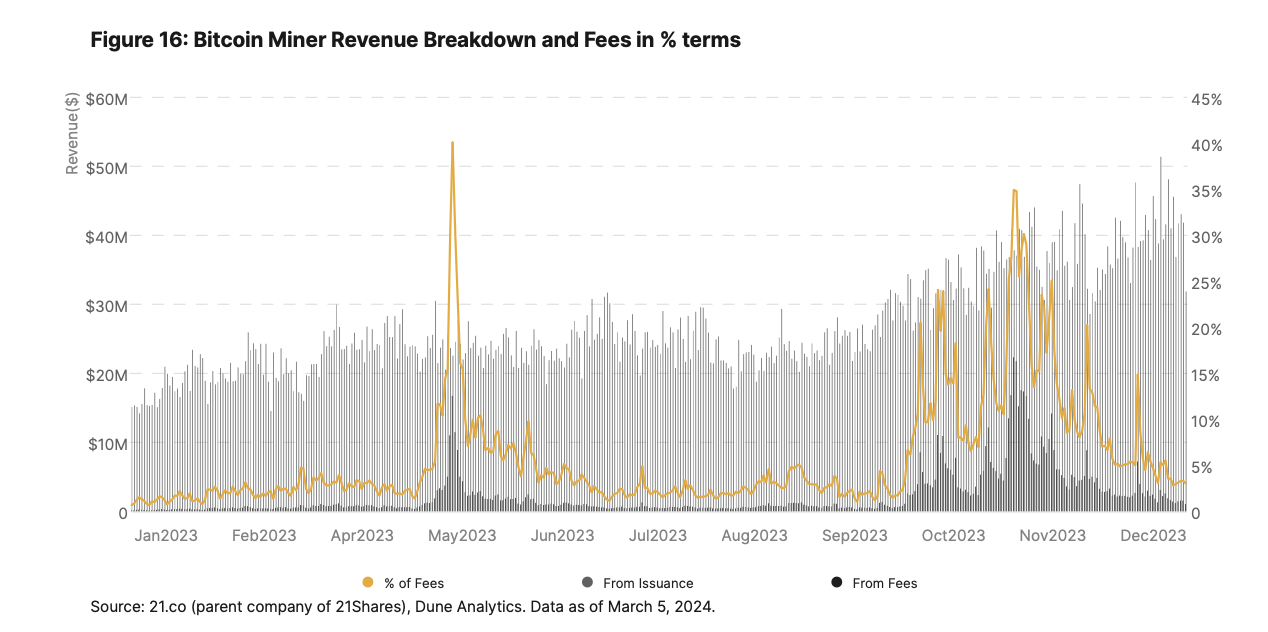
In 2023, miners' fee revenue increased from ~0.73% of total income at the start of the year to over 30% by December, with daily fees occasionally exceeding $15 million. Rising fees may impact small transactions and accelerate adoption of Layer 2 solutions like the Lightning Network and Stacks.

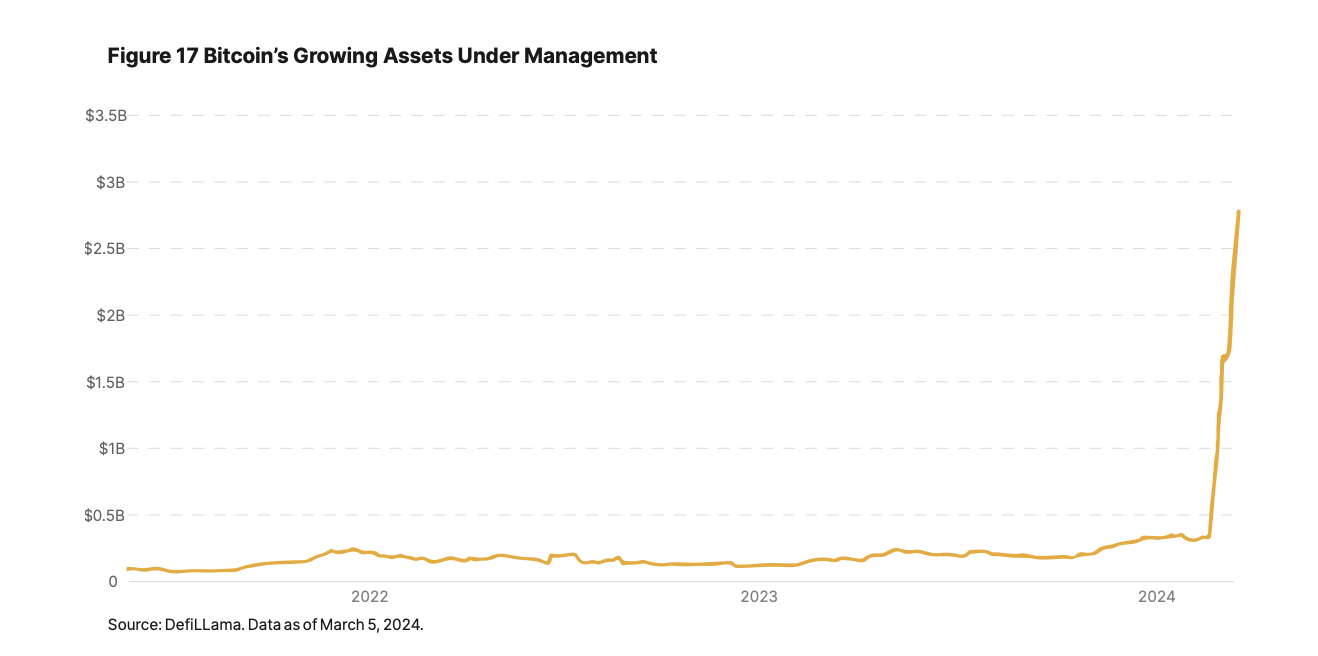
However, Bitcoin scaling has also attracted attention. Just as early Ethereum Layer 2 solutions (Arbitrum, Optimism, Polygon, etc.) emerged, projects focused on Bitcoin scaling are now advancing, introducing various scaling frameworks based on Optimistic Rollups and zkRollups. While their long-term success remains uncertain, they could unlock greater utility for Bitcoin and even enable Ethereum-scale growth. Notably, led by two new L2s, Bitcoin’s TVL surged sevenfold in March to $2.7 billion, ranking it among the top six networks. Finally, from December 2023 to February 2024, Bitcoin captured 33% of NFT trading volume—$2.76 billion—second only to Ethereum’s $3.99 billion and ahead of Solana’s $1.2 billion, demonstrating the massive impact of Ordinals on the Bitcoin network.
Join TechFlow official community to stay tuned
Telegram:https://t.me/TechFlowDaily
X (Twitter):https://x.com/TechFlowPost
X (Twitter) EN:https://x.com/BlockFlow_News