

Bitcoin Ordinals by the Numbers: Contributing 23% of Transaction Fees, Popular BRC-20 Tokens Up Over 400% on Average
TechFlow Selected TechFlow Selected
Bitcoin Ordinals by the Numbers: Contributing 23% of Transaction Fees, Popular BRC-20 Tokens Up Over 400% on Average
How is the market trading situation? What impact does on-chain activity have on the ecosystem, including mining and the application layer?
By Carol, PANews
At the end of 2023, Bitcoin Ordinals regained market attention. According to data from CRYPTOSLAM, in November, the trading volume of Bitcoin Ordinals (inscriptions) reached approximately $376 million, surpassing Ethereum NFTs by 8.05% during the same period. This gap widened further in December (as of December 10), reaching 18.75%. However, unlike earlier this year, this resurgence has been driven not only by inscriptions but also by the emergence of BRC-20 tokens. According to CoinGecko, ORDI, currently the largest BRC-20 token by market cap, surged 180.07% between December 2 and December 6 alone. Other BRC-20 tokens also experienced broad price increases.
The renewed popularity of Ordinals highlights the potential for explosive growth within Bitcoin's ecosystem. So where do inscriptions (Inscriptions) and tokens (BRC-20) built on the Ordinals protocol stand today? How is market activity evolving? And what impact are on-chain activities having on sectors like mining and applications? PAData, the data journalism column under PANews, conducted a comprehensive analysis of on-chain and market data related to Ordinals and found:
-
Since November, total transaction counts for Ordinals have reached approximately 9.748 million, with cumulative transaction fees amounting to about 1,263.54 BTC. However, on-chain transaction volumes for BRC-20 tokens show a declining trend, possibly due to increasing trading activity shifting toward centralized exchanges.
-
Floor prices of popular Bitcoin NFTs have risen an average of 311.73% over the past month. Yet, performance varies significantly across projects—Flipped Frogs, Bitcoin Frogs, and Van Gogh’s painting saw the highest gains, all exceeding 1,500%.
-
The Bitcoin NFT market exhibits high concentration and low liquidity for most assets. Van Gogh’s painting and Bitcoin Frogs together accounted for 73.51% of total trading volume over the past month. Among top projects, fewer than 50% of individual inscriptions achieved three or more public trades. The liquidity of individual inscriptions is somewhat tied to overall market sentiment; when the broader market performs well, more inscriptions get traded.
-
Since November, the average price increase among popular BRC-20 tokens reached 446.74%. BISO led the rally with a surge of 1,690.76%, followed by PIZA and ORDI at 1,168.14% and 913.10%, respectively.
-
The BRC-20 market is highly concentrated both in terms of traded assets and reliance on single trading platforms. On average, 97.45% of daily trading volume comes from ORDI alone. For 18 out of 20 popular tokens, over 50% of daily trading volume occurs on just one exchange. UniSat and Gate.io serve as primary markets for multiple major BRC-20 tokens.
-
Since November, daily transaction fees have accounted for an average of 12.49% of miners’ total revenue, while Ordinals-related fees made up 23.20% of total transaction fees. Although Ordinals have boosted miner income, they have not yet become the dominant source of revenue.
01. Ordinals On-Chain Activity Since November: Over 9.74 Million Transactions and More Than 1,263 BTC in Fees
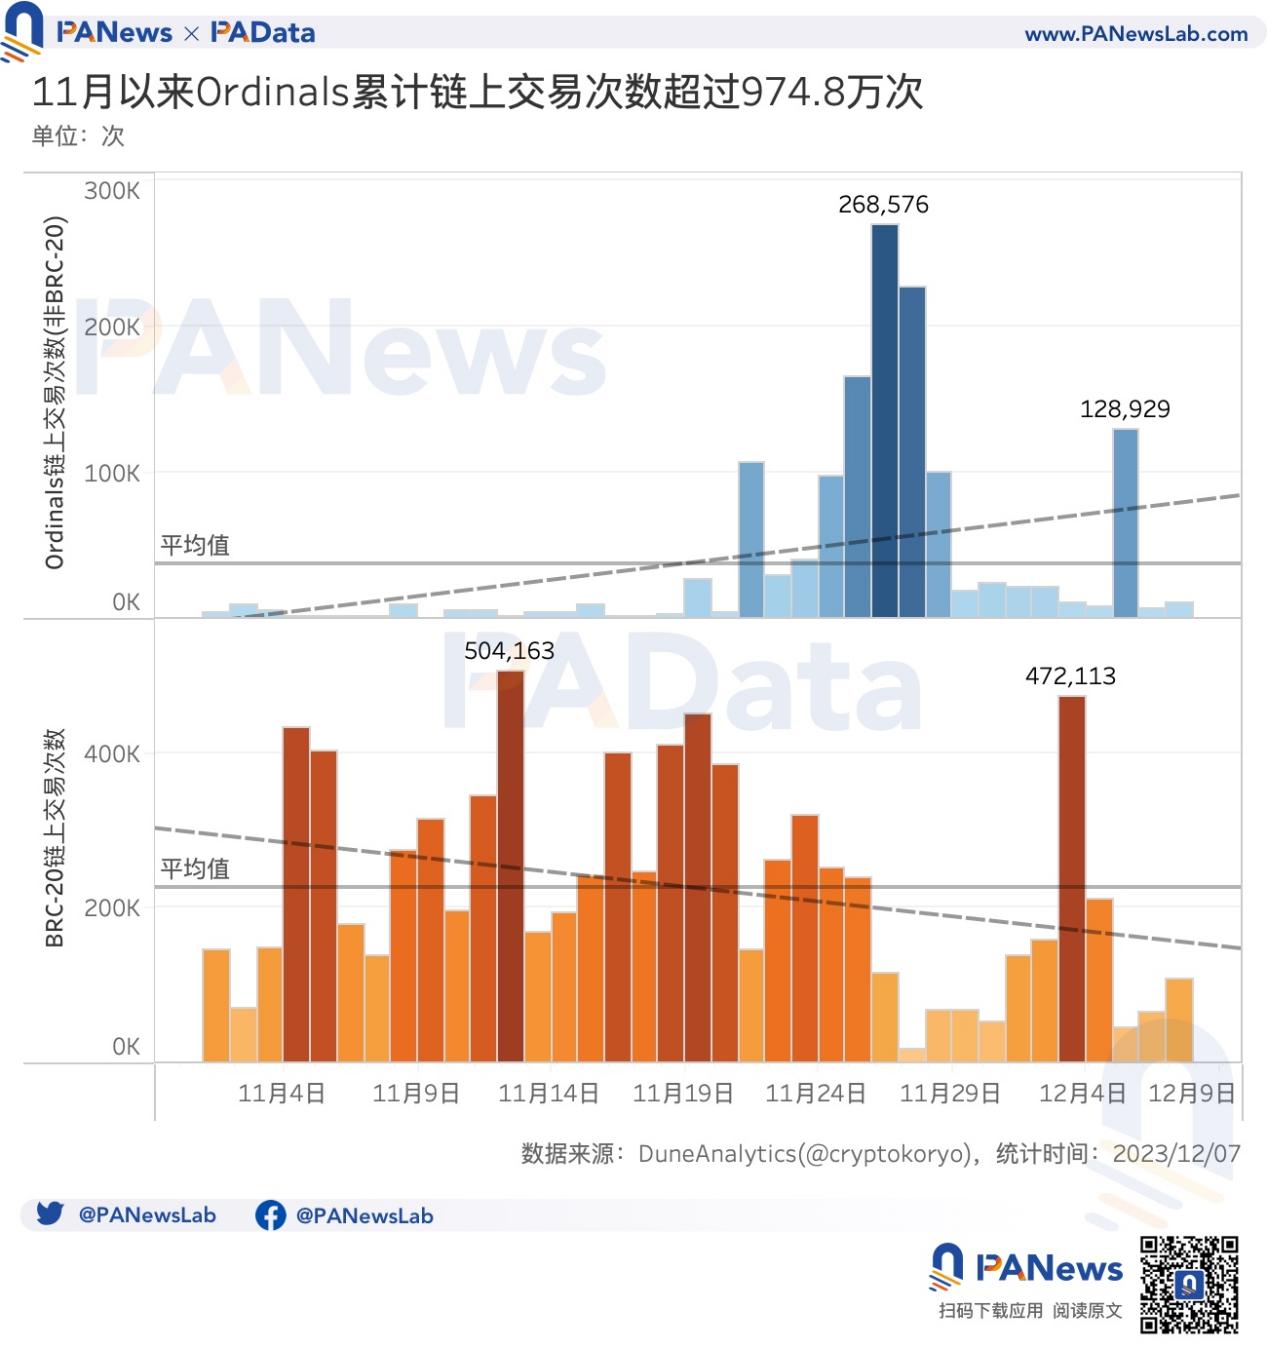
Since November, on-chain activity for Ordinals has been highly active. As of December 7, total transaction count for Ordinals reached approximately 9.748 million. Of these, non-BRC-20 Ordinals transactions totaled 1.378 million, averaging 37,300 per day, showing a clear upward trend. A peak occurred between November 24 and 28, with a high of 268,600 transactions in a single day.
During the same period, BRC-20 transactions totaled 8.37 million, averaging 226,200 per day, though displaying a downward trend. From November 4 to 25, there was a prolonged period of high activity, peaking at 504,200 transactions in one day. The decline in BRC-20 on-chain transaction volume suggests that trading may increasingly be moving to centralized exchanges.
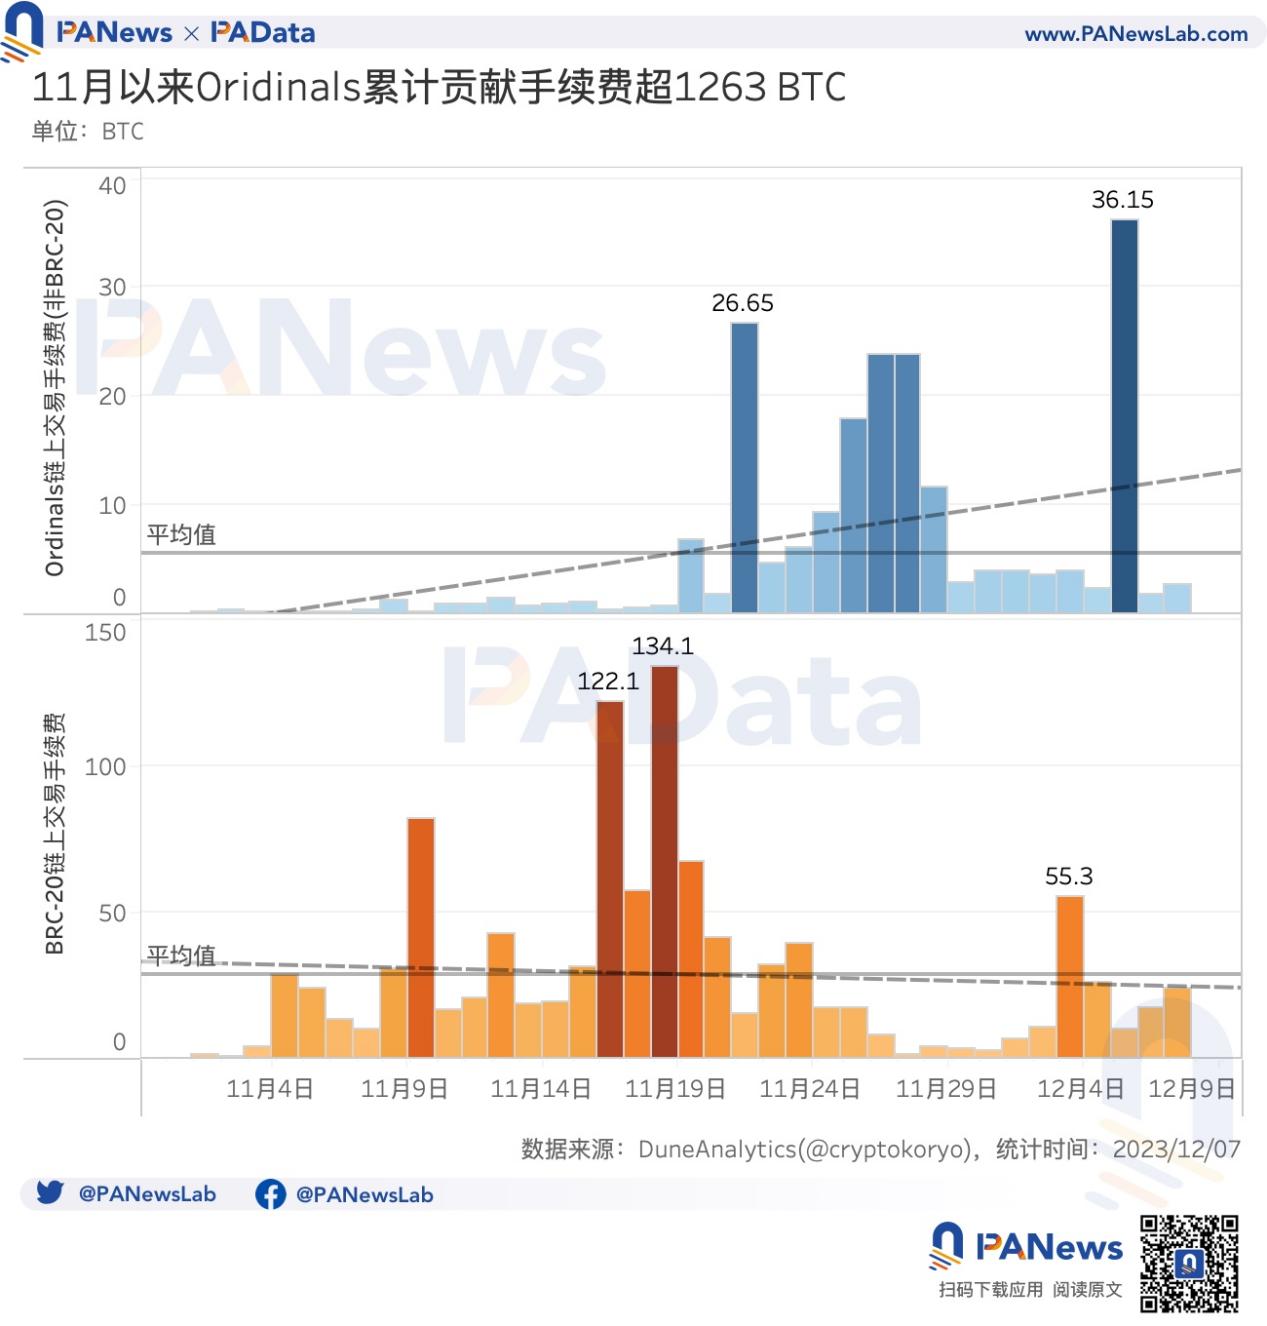
The surge in transaction volume has generated significant fee revenue. Since November, total transaction fees for Ordinals have amounted to around 1,263.54 BTC. Non-BRC-20 Ordinals fees totaled approximately 240.27 BTC, averaging 5.52 BTC per day, following a similar rising trend as transaction volume. The recent peak occurred on December 5, with fees reaching about 36.15 BTC.
For BRC-20 tokens, cumulative transaction fees since November reached approximately 1,059.26 BTC, averaging 28.6 BTC per day, remaining relatively stable with a slight downward trend. Daily fees exceeded 100 BTC twice recently, peaking at 134.1 BTC.
02. Floor Prices of Popular Bitcoin NFTs Up 311% on Average; Fewer Than 50% of Projects Traded Publicly Three Times or More
Inscriptions represent a key branch of the Ordinals ecosystem. They first gained prominence in March after Twelvefold’s high-profile auction. These image-based inscriptions are often referred to as Bitcoin NFTs. Research firm Galaxy Digital believes this could evolve into a massive market. After nearly a year of development, what does the current state of the Bitcoin NFT market look like?
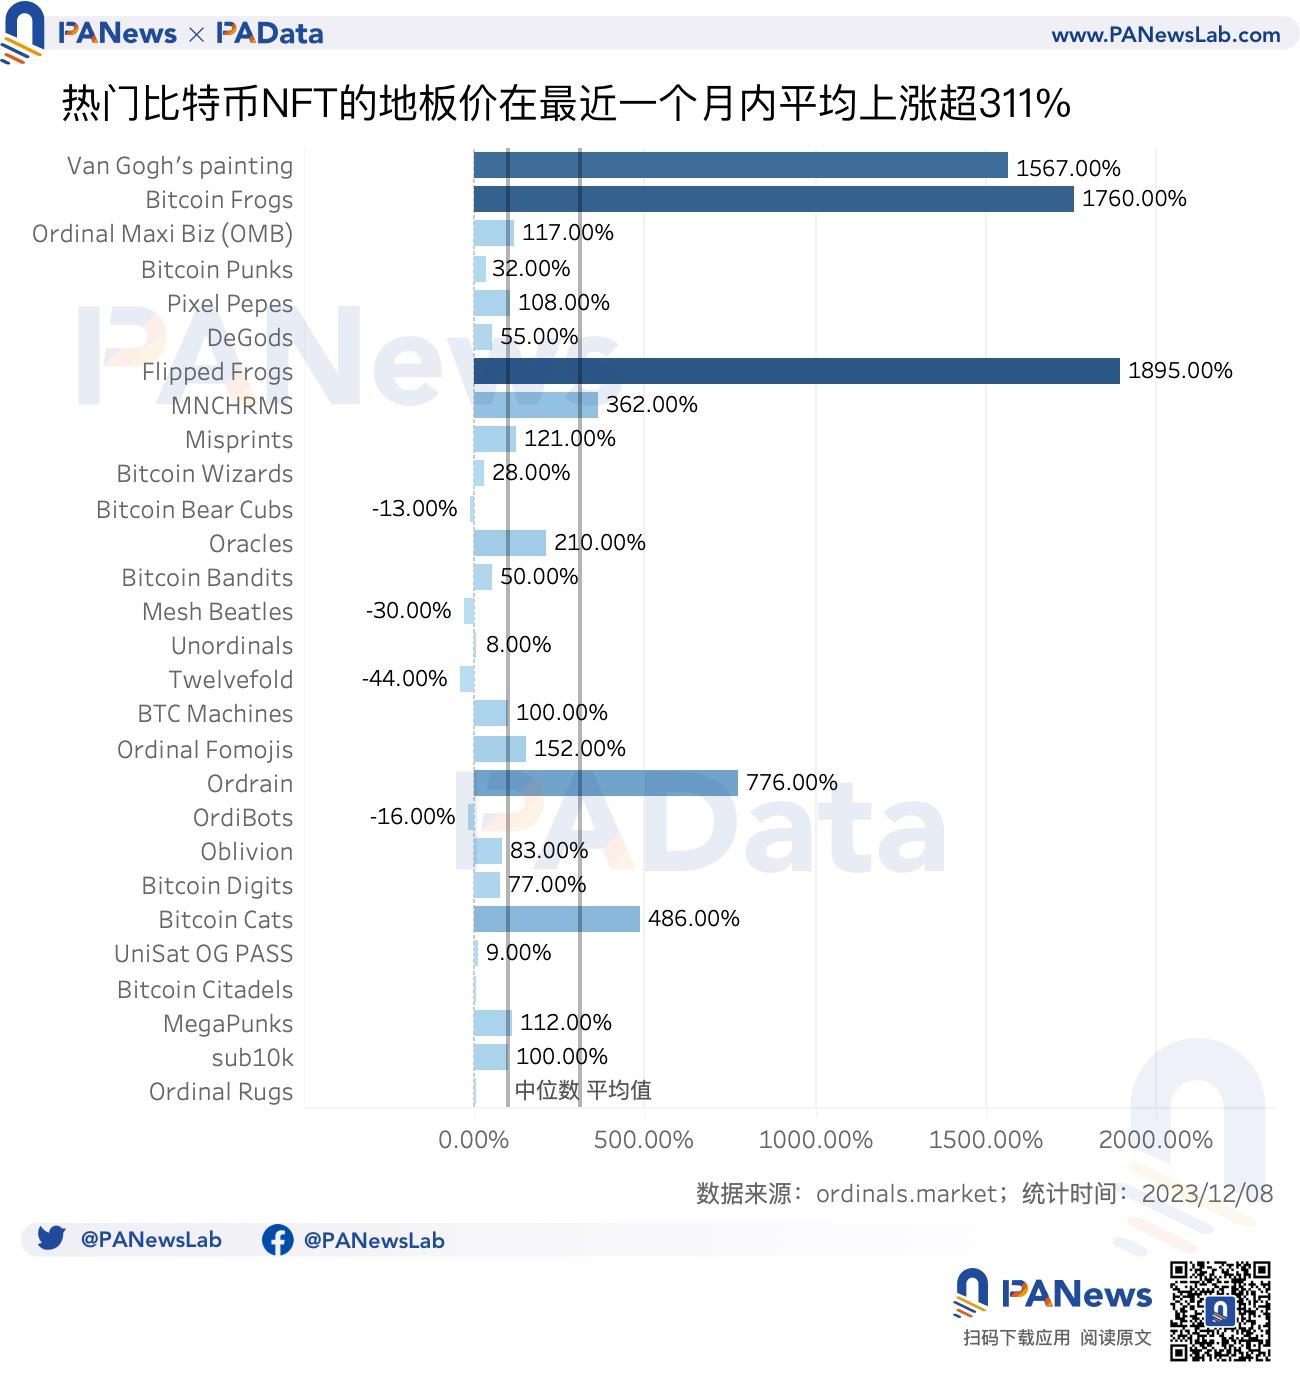
Using the top 30 most actively traded inscriptions on ordinals.market over the past month as our sample, we find that their floor prices rose an average of 311.73% in the last 30 days. However, performance varied widely: Flipped Frogs, Bitcoin Frogs, and Van Gogh’s painting each gained over 1,500%; meanwhile, Twelvefold, Mesh Beatles, OrdiBots, and Bitcoin Bear Cubs declined by more than 10%.
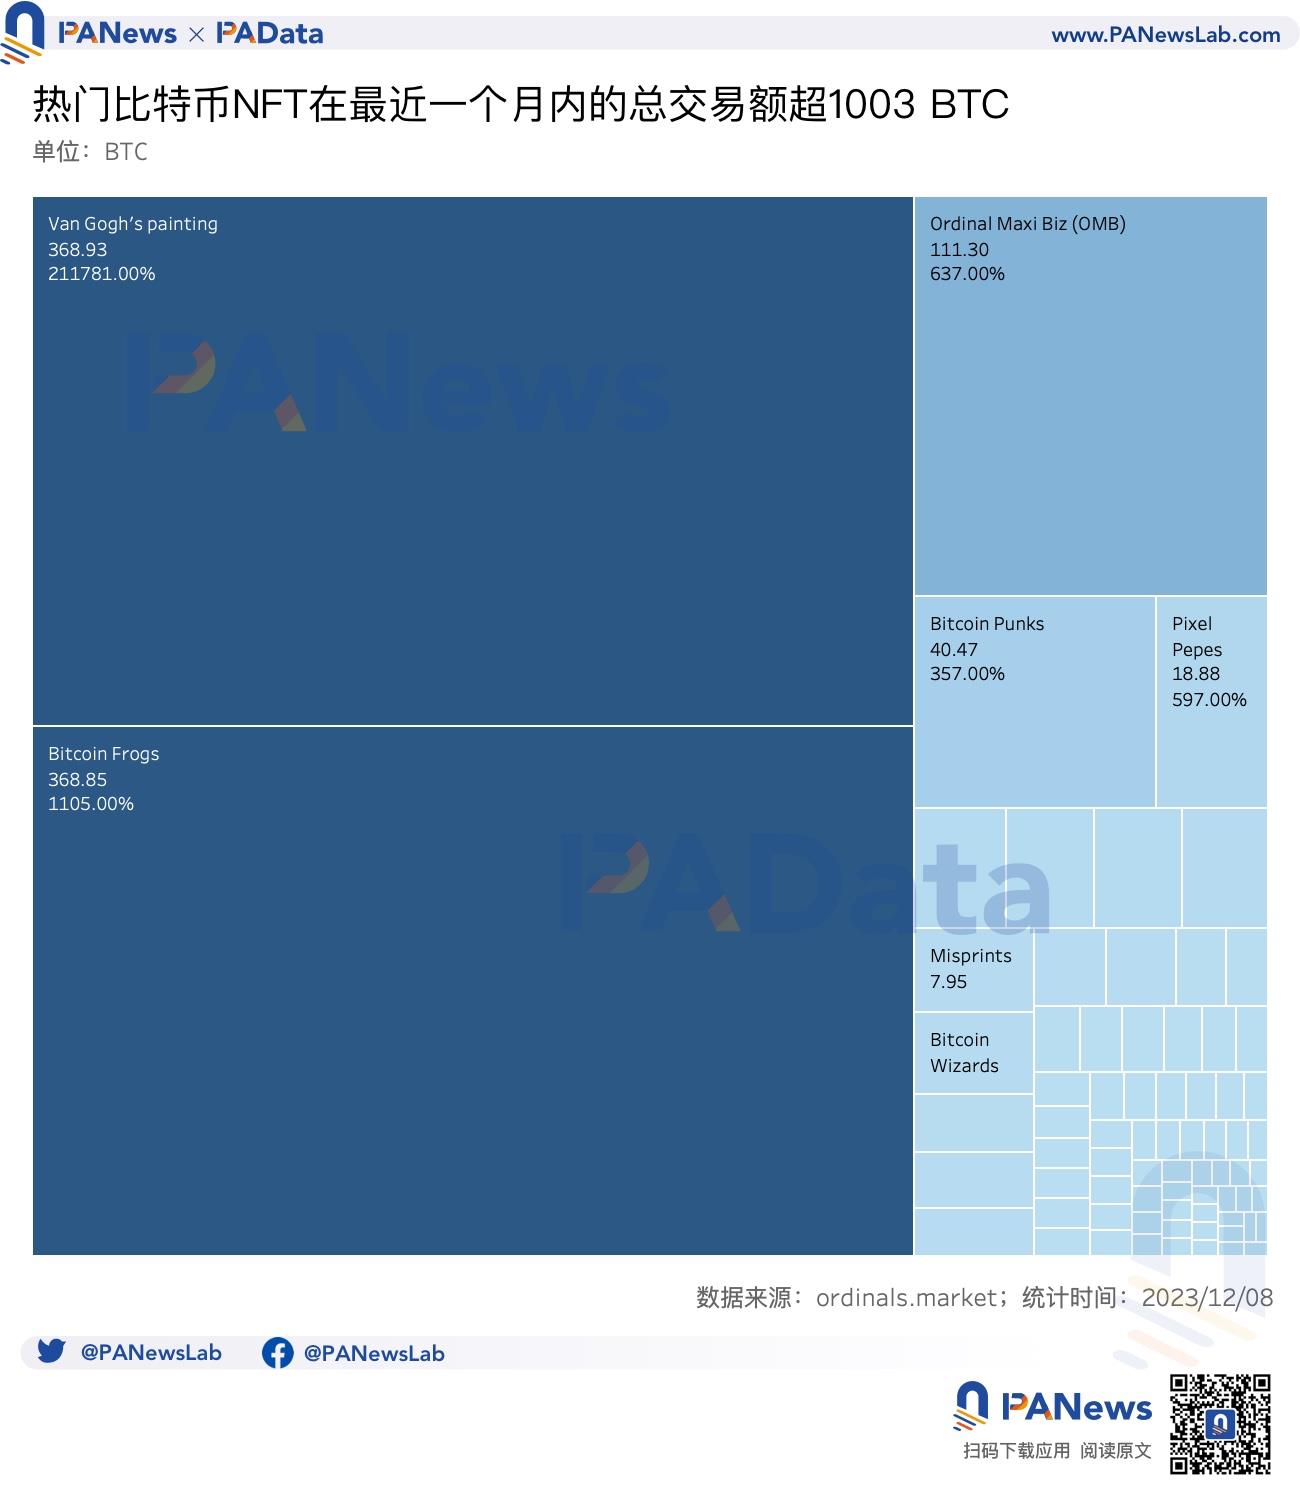
As of December 8, total trading volume for these 30 top inscriptions reached approximately 1,003.66 BTC. A notable feature is extreme concentration: Van Gogh’s painting and Bitcoin Frogs contributed 368.93 BTC and 368.85 BTC respectively, together accounting for 73.51% of total volume. Beyond them, OMB surpassed 100 BTC, Bitcoin Punks exceeded 40 BTC, Pixel Pepes passed 15 BTC, and six other projects each recorded over 5 BTC in volume.
In terms of volume growth, Van Gogh’s painting led with a staggering 211,781% increase. MNCHRMS followed with 25,983%. SATS, Bitcoin Pandas, Ordrain, Battle of BTC, and Honey Badgers all posted gains above 5,000%.
To further analyze investment returns, PAData randomly selected 100 inscriptions (10 from each of the top 10 projects by trading volume) to assess their return rates per public trade. "Public trade" here refers only to sales on open markets such as OKX and Magic Eden, excluding transfers. Additionally, all samples included at least two public trades to evaluate consecutive turnover returns.
Results revealed a second key characteristic: most inscription assets exhibit low liquidity. Among top projects, fewer than 50% of inscriptions achieved three or more public trades, and only 15% reached five or more.
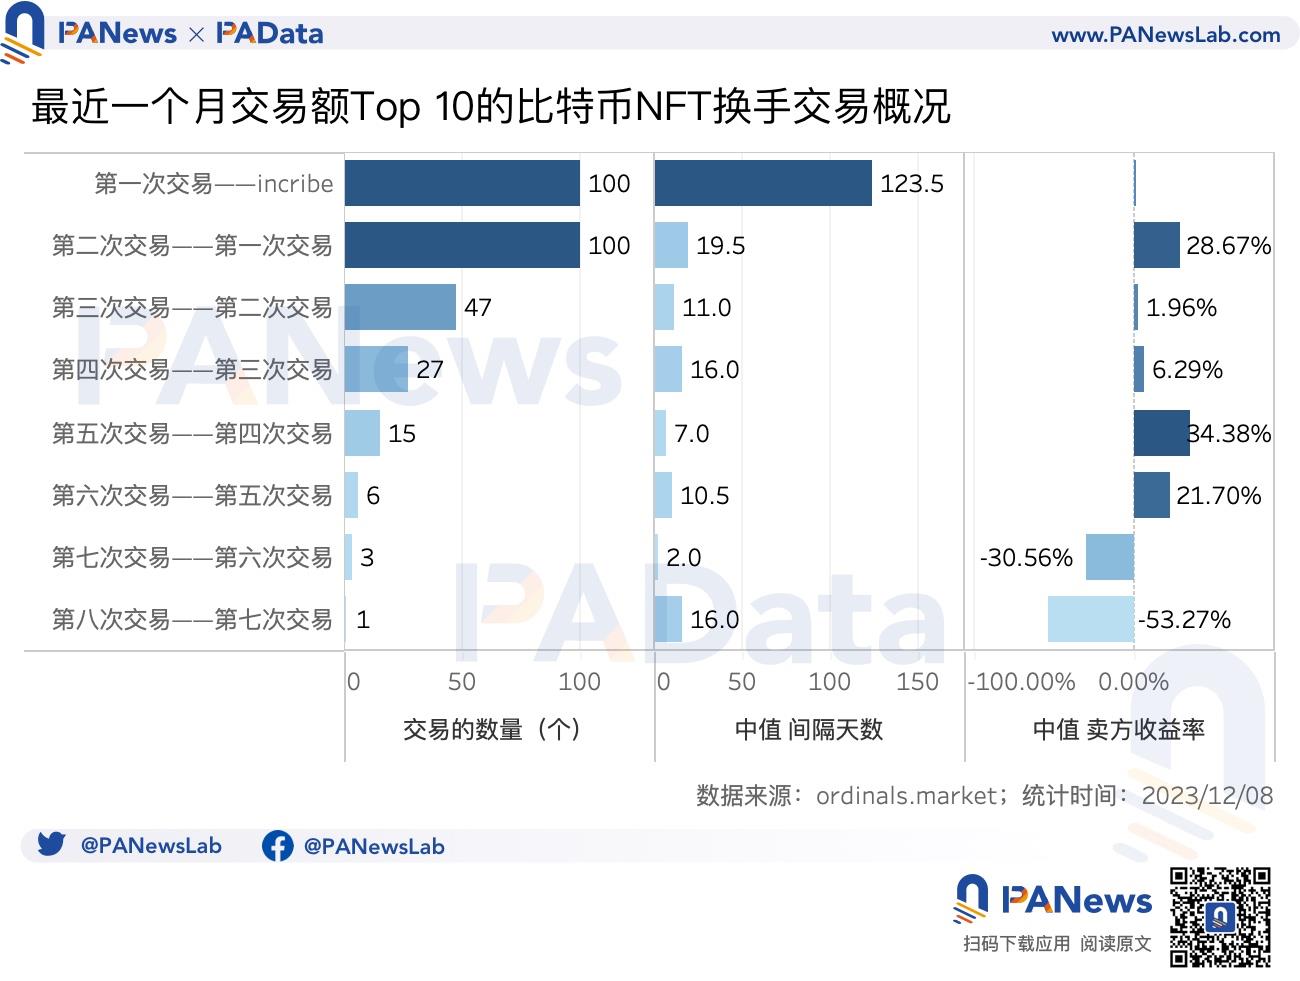
Given large variations in holding periods and returns across assets, medians (50th percentile) were used to measure overall averages. On average, the first public trade occurred 123.5 days after inscription—much longer than subsequent trades. This is largely because some inscriptions created in February weren’t traded publicly until November, significantly extending the initial interval. This indirectly shows that individual inscription liquidity is influenced by overall market热度—when the broader market heats up, more inscriptions get traded.
Additionally, average intervals between the first four public trades exceeded 10 days, whereas intervals after the fifth trade generally dropped below 10 days.
In terms of average returns, the fifth public trade yielded the highest return at 34.38%, followed by the second and sixth trades at 28.67% and 21.70%, respectively. Seventh and eighth trades showed negative average returns.
In reality, actual returns fluctuate dramatically. The same inscription might generate substantial profit in one trade and suffer heavy losses in the next. To illustrate, consider Van Gogh's painting#132 (Inscription #394638) from our random sample: it sold for just 0.11 BTC in its first public trade. After several turnovers, the price rose to 22 BTC by the fifth trade. One day later, it reached 36 BTC in the sixth trade—a 63.64% gain—but then plunged to 25 BTC fifteen days later in the seventh trade, resulting in a -30.56% return.
This raises a new question: would shorter holding periods and faster trades improve returns?
Overall, removing extreme outliers above 2,000% returns, a general observation (not statistically correlated) emerges: as holding time increases, returns tend to decrease. When analyzing specific trade rounds, another pattern appears: in the second, third, and fourth trades, longer intervals correlate with higher returns; in the fifth, sixth, and seventh trades, longer intervals lead to lower returns. However, sample sizes for sixth and seventh trades are small, so this trend requires further validation.
03. Top BRC-20 Tokens Up 446% on Average; 97% of Volume Comes From ORDI
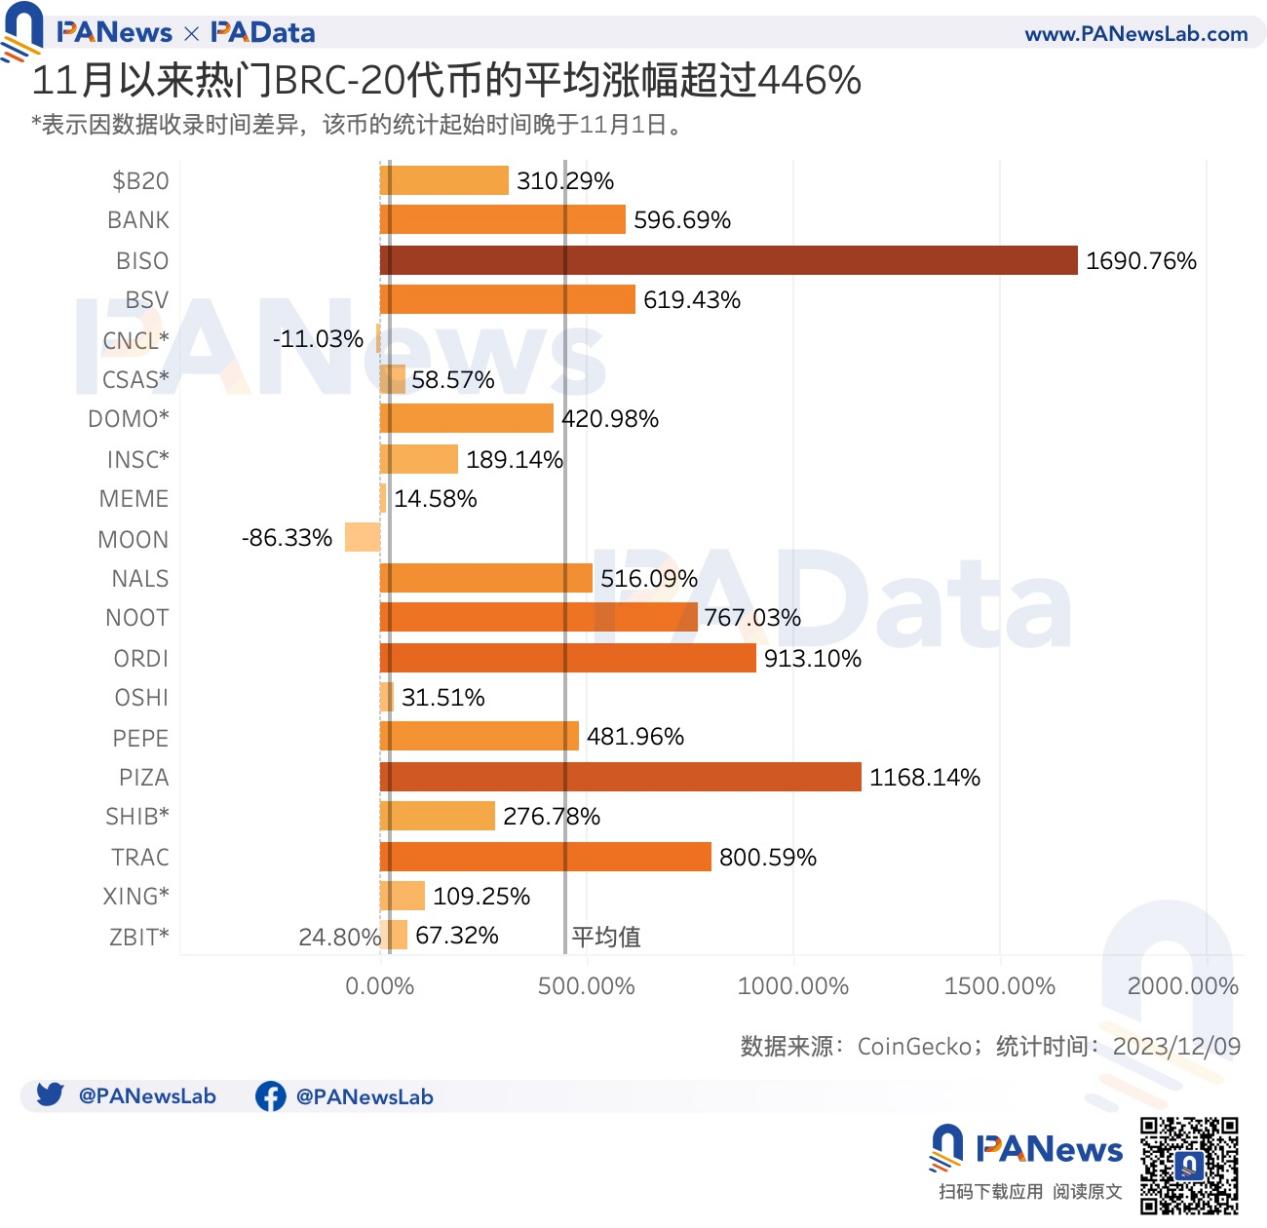
The recent boom in Ordinals has also been fueled by strong BRC-20 market performance. Using the top 20 BRC-20 tokens by market cap on CoinGecko as our sample, we find that since November, average price gains among popular tokens reached 446.74%. Like inscriptions, however, performance varied sharply. BISO led with a 1,690.76% surge, followed by PIZA and ORDI at 1,168.14% and 913.10%, respectively. Four other tokens gained over 500%. Conversely, CNCL and MOON posted negative returns.
Over the same period, BTC appreciated by 24.80%. Only three of the 20 tokens underperformed BTC. Overall, BRC-20 returns significantly outpaced the broader market.
Analyzing daily trading volume since November reveals another key feature: similar to the inscription market, BRC-20 trading is highly concentrated—97.45% of volume comes from ORDI. DOMO and TRAC follow with 0.76% and 0.62%, respectively. All others account for less than 0.5%, with 12 tokens contributing less than 0.01% each.
According to static data from December 9, UniSat and Gate.io dominate as primary trading venues (top three markets by trading volume share) for multiple popular BRC-20 tokens, each monopolizing four major assets. Binance and OKX are the main platforms for ORDI, capturing 52.40% and 27.40% of its trading volume, respectively.
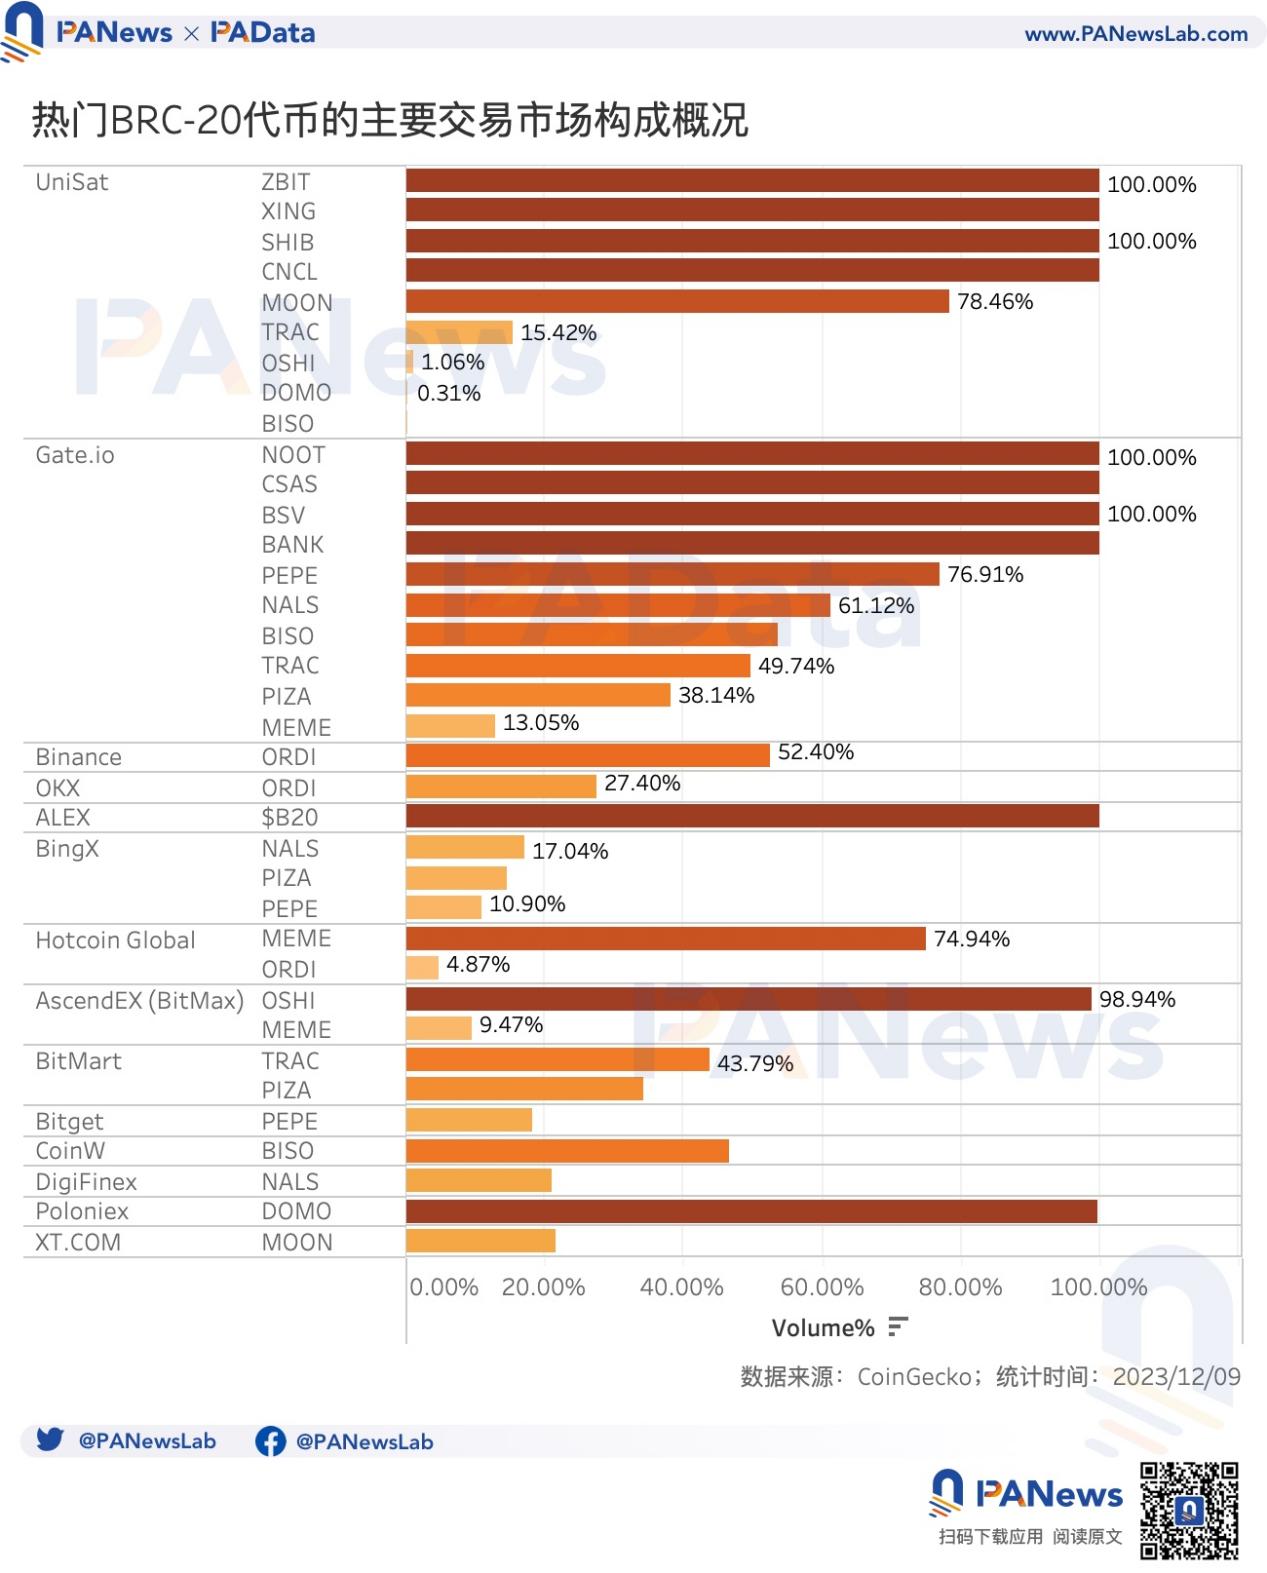
In short, most BRC-20 tokens rely heavily on a single exchange. For 18 of the 20 top tokens, over 50% of trading volume occurs on just one platform.
04. 23% of Daily Transaction Fees Come From Ordinals; Bitcoin’s TVL Rises Nearly 37%
The rise of Ordinals has sparked debate. On December 6, Bitcoin core developer Luke Dashjr posted on X claiming that inscriptions exploit a vulnerability in Bitcoin Core to flood the blockchain with spam, urging future updates to fix it.
As previously analyzed by PAData, Glassnode data shows increasing UTXO bloat this year, particularly since March—new UTXOs have surged in number without meaningful growth in total value. Meanwhile, COINMETRICS data indicates that average Bitcoin block size has remained consistently above 3.95 MB, nearly hitting the 4 MB limit.
Yet, Ordinals bring benefits too. First, miner revenues have clearly increased. Since November, total miner revenue reached 40,100 BTC (~$1.512 billion), including 5,191.30 BTC (~$198 million) in transaction fees.
Looking at the share of daily transaction fees in total revenue (in BTC terms), the ratio has trended upward since November, averaging 12.49%, with a peak of 25.80%. However, Ordinals do not account for most of these fees. On average, Ordinals-related fees made up 23.20% of total fees, peaking at 42.55% on a single day.
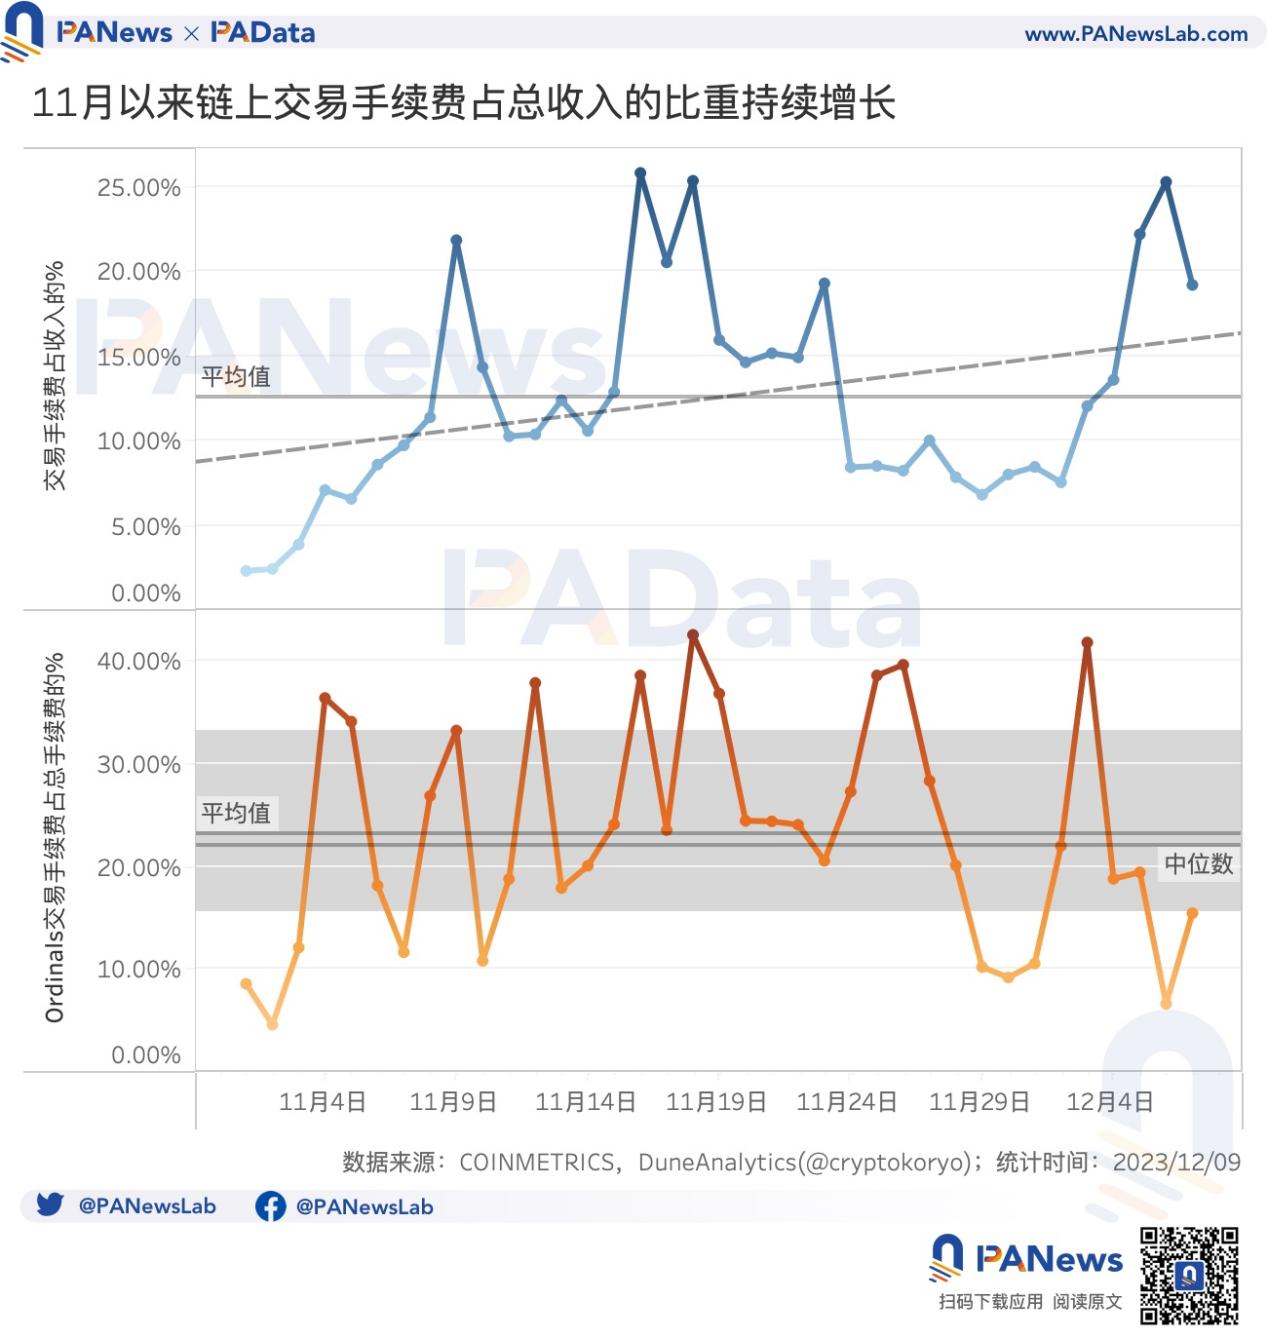
This means that although Ordinals represent the current narrative hotspot and have boosted miner income, due to BRC-20 trading migrating to centralized exchanges and limited liquidity in inscription markets, Ordinals have not yet become the dominant driver of miner revenue.
Second, the development of Ordinals is seen as beneficial for expanding Bitcoin’s ecosystem, potentially laying the groundwork for replicating Ethereum-style growth. Some even argue that Bitcoin and Ethereum ecosystems are inversely related, with the next cycle focusing on Bitcoin-native innovation.
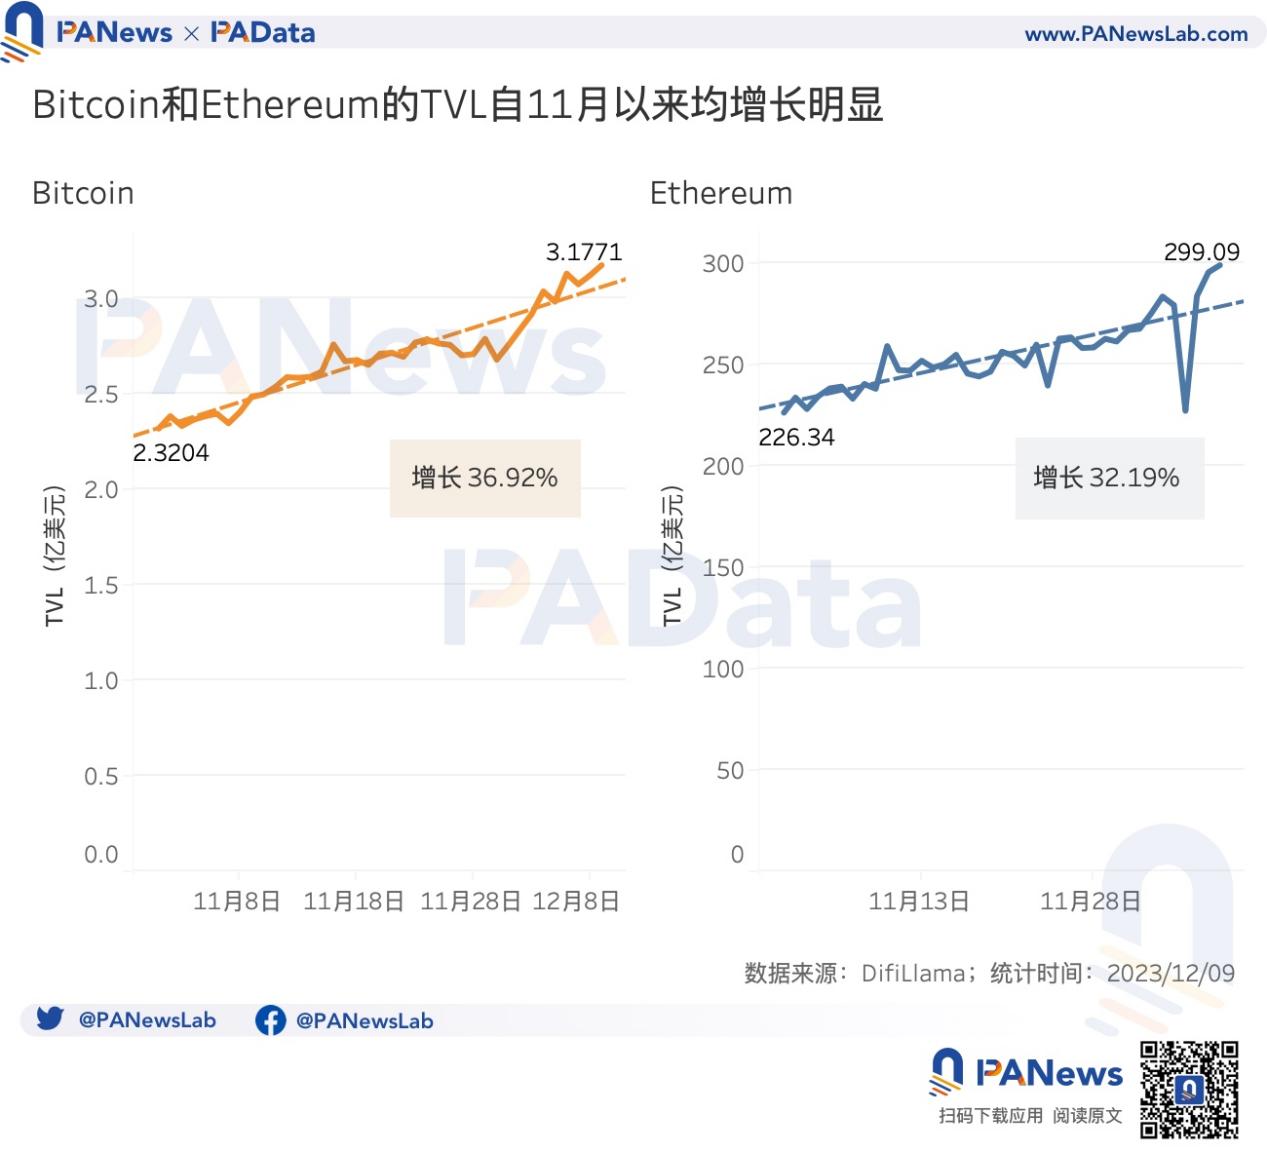
Data shows that on December 9, Bitcoin’s DeFi TVL stood at $318 million, up 36.92% from early November—an impressive rise. However, Ethereum’s DeFi TVL also grew during the same period, reaching $29.909 billion. There is currently no clear evidence supporting the view of zero-sum competition between the two ecosystems. Instead, a more likely scenario is that growth in Bitcoin’s ecosystem could drive broader adoption of decentralized applications and strengthen cross-chain connectivity.
Join TechFlow official community to stay tuned
Telegram:https://t.me/TechFlowDaily
X (Twitter):https://x.com/TechFlowPost
X (Twitter) EN:https://x.com/BlockFlow_News


