Fireblocks Research 2022-2023 Annual Report: Global Blockchain Industry Landscape and Trends
TechFlow Selected TechFlow Selected
Fireblocks Research 2022-2023 Annual Report: Global Blockchain Industry Landscape and Trends
In 2022, the Federal Reserve continued raising interest rates, leading to a global liquidity contraction, and the crypto industry entered a deep bear market.
Abstract
In 2022, the Federal Reserve's continuous interest rate hikes caused a global tightening of liquidity, plunging the crypto industry into a deep bear market. This year, the total market capitalization of crypto assets shrank by over $2.2 trillion, and the business scale of CEFI institutions declined approximately 71.4%. The industry suffered severe blows after consecutive events including the Terra collapse, the bankruptcies of 3AC and FTX, with major institutions such as BlockFi and Genesis facing bankruptcy or liquidation crises. However, development within the industry has not stopped: total investment in the primary market exceeded $27.7 billion; Ethereum ushered in a new PoS era, Layer2 solutions rapidly advanced; X2E revitalized new business models for GameFi. This report comprehensively analyzes the gains and losses across seven domains—market trends, data, investments, regions, applications, technology, and regulation—to provide forecasts and recommendations for the industry’s evolution in 2023.
We developed a Crypto Regional Development Index based on four dimensions: crypto population penetration rate, CEX traffic, DeFi traffic, and web search popularity. The United States, Vietnam, and Russia rank in the top three. In 2022, the global crypto user base reached approximately 320 million, with over 40% from Asia. New user growth dropped from 194 million in 2021 to just 25 million. U.S., South Korea, and Russian CEX exchanges recorded the highest visit volumes, collectively accounting for over 22%. The U.S. leads in DeFi market share, with its protocol traffic six times that of Brazil, the second-largest. South America, South Africa, and the Middle East show the highest public interest in crypto. Southeast Asia's crypto population reached 46 million, second only to North America. In South America and Africa, cryptocurrencies are primarily used for payments and value storage, with over one-third of citizens routinely using stablecoins.
Infrastructure continues focusing on performance optimization, while service-level infrastructure becomes increasingly comprehensive. Ethereum Layer2 projects flourish. New public chains gain rapid development via "modular" technical routes. Storage technologies diversify, with steady gradual increases in capacity and utilization. As an application-layer and DID infrastructure, domain names exhibit explosive growth. Numerous cross-chain bridges exist, but their security and interoperability still have room for improvement. In mining, Bitcoin mining faces challenges, while Ethereum moves toward a new era of staking-as-a-service.
On the application front, DeFi's total TVL across all chains dropped over 70% from historical highs. Leverage was cleared out, and yields declined. The NFT market started strong but weakened significantly, with total market cap down about 42% and active trading users decreasing approximately 88.9%. NFTfi projects have emerged as the next growth frontier. GameFi and Metaverse showed highlights but insufficient progress overall.
Regarding regulations, globally over 42 sovereign nations and regions implemented 105 regulatory measures and guidelines for the crypto sector this year. Positive policies accounted for 36%, a significant increase compared to last year. Comprehensive regulatory frameworks are now on national agendas, with tighter oversight of CEXs and potential inclusion of on-chain monitoring.
The bear market persists. We propose four valuable market bottom indicators and offer advice on avoiding bear market traps and protecting assets.
Finally, we forecast several directions for industry development in 2023:
(1) Market bottoms likely form early in 2023;
(2) Web2 social giants like Twitter will continue integrating into Web3, fostering new SocialFi models;
(3) Layer2 ecosystems will explode in 2023;
(4) ZK acceleration networks begin emerging;
(5) Dapp Chains will enter a period of rapid development;
(6) Real demand for on-chain storage grows quickly, driving substantive advancement in the storage sector;
(7) On-chain regulation intensifies, potentially threatening some protocols;
(8) More countries will adopt cryptocurrencies for payments or authorize them as legal tender.
Authors
Huobi Research Institute
Flora Li, Stefanie Wei, Barry Jiang, Nolan Liu, Johnny Louey, Siyu Chen, Andy Hoo, Mingwang Zheng, Jimmy Qi, Lucio Lyu
Contributor: nansen.ai
1. Cryptocurrency Industry Under Global Economic Conditions
1.1 Global Macro: Inflation, Rate Hikes, and Declines
If summarizing the key thread of the global macro market in 2022, it inevitably centers on global inflation and the subsequent monetary tightening. These forces set the tone for the broader economic symphony, affecting every corner of the global economy—including the cryptocurrency market. Moreover, given today’s rare macroeconomic environment over recent decades, macro factors outweighed internal industry dynamics such as regulation, new technologies, and emerging sectors as the dominant influence on crypto markets this year. Below, we analyze the global macro landscape through two lenses: inflation and monetary tightening.
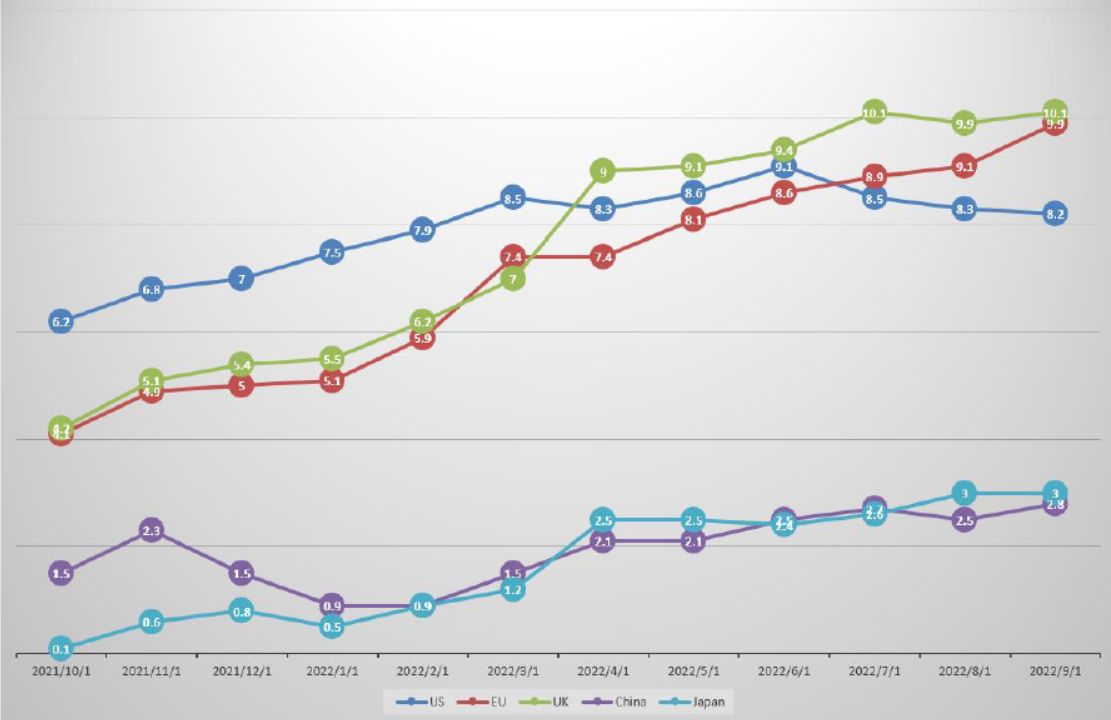
The above chart shows CPI year-on-year data from October 2021 to September 2022 for major economies—the U.S., Eurozone, China, Japan, and the UK. Over the past year, inflation rose across these major economies. Except for China, other countries currently face inflation levels at multi-decade highs. To combat this, central banks in high-inflation nations generally tightened monetary policy via rate hikes and QE tapering, aiming to curb demand and lower inflation.
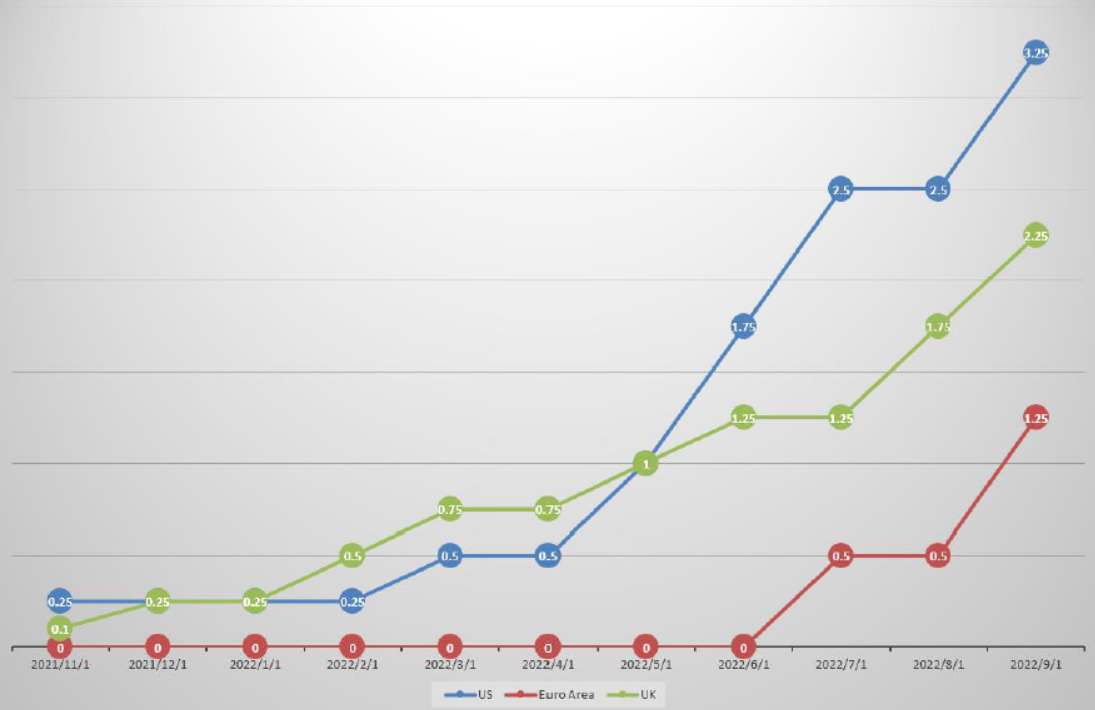
The above chart displays benchmark interest rate trends from late 2021 to date for the U.S., Eurozone, and the UK. The current global rate-hiking cycle is notable for its speed and intensity. For example, the U.S. Federal Reserve raised rates to 2.5% over eight months—compared to nearly two years during the previous hiking cycle. Such aggressive rate hikes exerted tremendous downward pressure on global risk asset prices, leaving cryptocurrencies no exception.
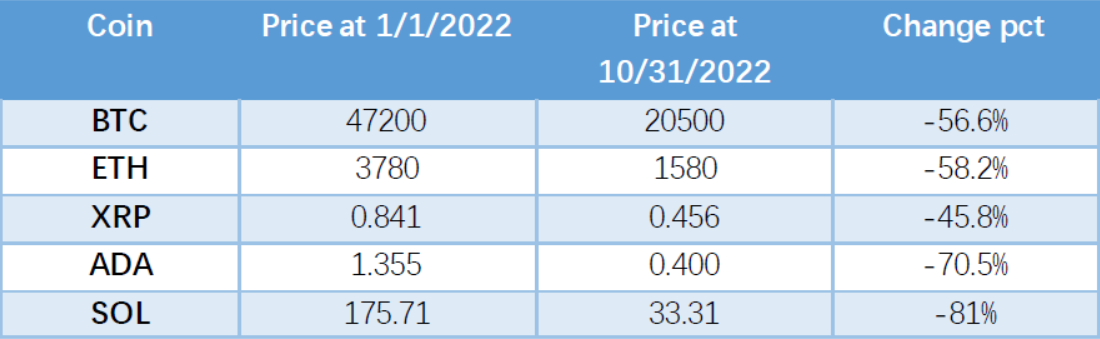
The table above shows year-to-date price changes for top-market-cap cryptocurrencies. Amid tightening monetary conditions, all digital assets, regardless of sector, suffered sharp declines. Despite historic events such as Terra's collapse and the Ethereum merge occurring this year, these either resulted from deteriorating macro conditions or failed to reverse the prevailing downtrend. Thus, the defining themes of 2022’s macro environment were inflation, rate hikes, and falling prices.
1.2 Crypto: A Year of Receding Tides
2022 marked a prolonged downturn for the cryptocurrency market, burdened by external financial panic and compounded by a chain reaction of internal failures, ultimately reducing total market capitalization by $2 trillion.
1.2.1 Market Trends: From Bull to Bear, Then Deep Bear
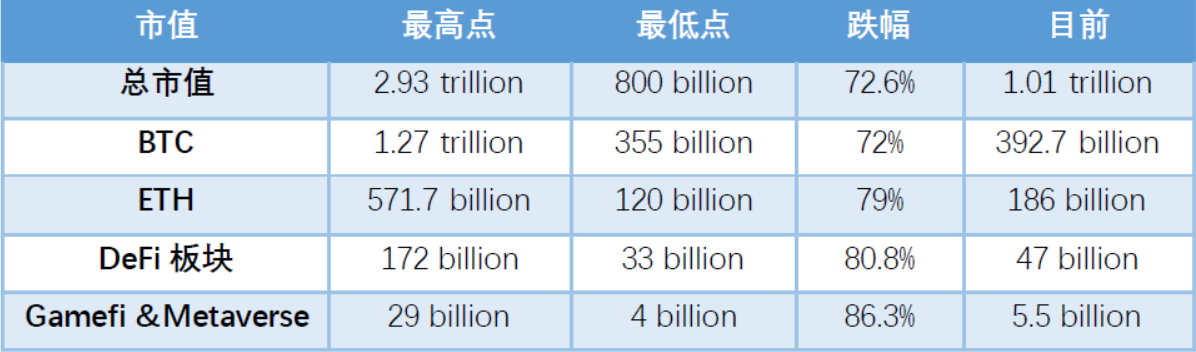
During the bear market, BTC and ETH maintained relatively strong positions, experiencing smaller drawdowns despite their high market caps. While DeFi and GameFi sectors saw total market caps fall between 80–90%, individual asset drops were often greater. Total market cap decreases were partially offset by continuous additions of new assets, which filled gaps left by declining values. Assets popular during bull runs cooled rapidly, many dropping over 90% or more.
200-Week SMA Indicator
For mainstream assets like BTC, observing over a decade of historical data reveals that the 200-week SMA indicator effectively identifies BTC's bottom range.
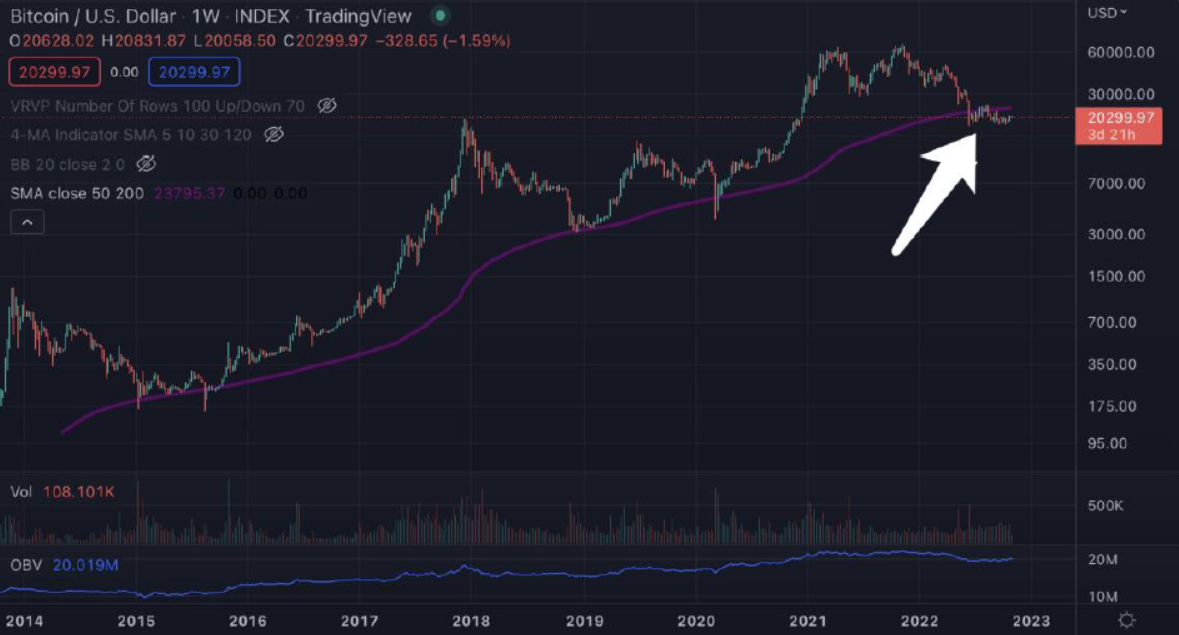
Since BTC lacked sufficient data before mid-2014, the indicator starts from then. Historically, price briefly dipped below the indicator twice in 2015, touched it in 2019, and fell below during the March 2020 crash—all followed by quick rebounds. However, BTC has remained below the indicator since June 2022, briefly rising above in August before falling back. It now oscillates long-term beneath the threshold. According to this metric, BTC has fallen below and sustained a prolonged low—a first in history—signaling an unprecedented deep bear market.
1.2.2 Applications: Innovation Amidst Downturn
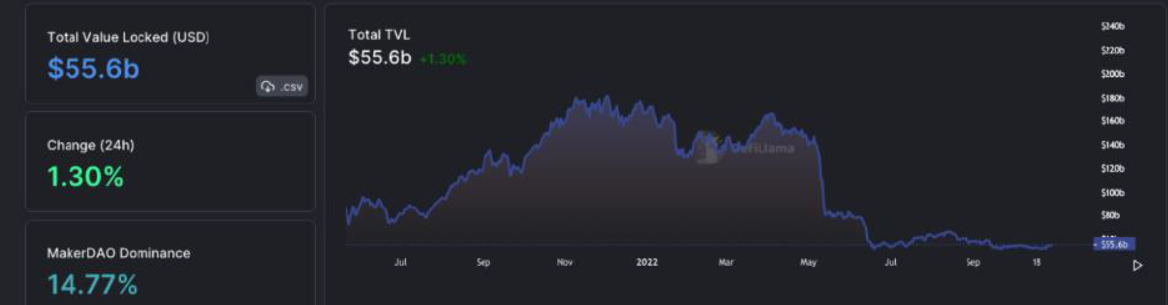
According to DefiLlama data, DeFi Total TVL declined from $171 billion in January 2022 to a low of $50 billion by October. By end-October, it had recovered slightly to around $55 billion. Following Terra's failure, DeFi TVL experienced two sharp drops, confirming and accelerating the bear market phase.
The chart below shows the value of outstanding debt in lending protocols—currently around $4 billion USD, down 84% from last year's peak of $25 billion. Reduced demand for leverage among on-chain users led to decreased transaction activity, a clear characteristic of this bear market.
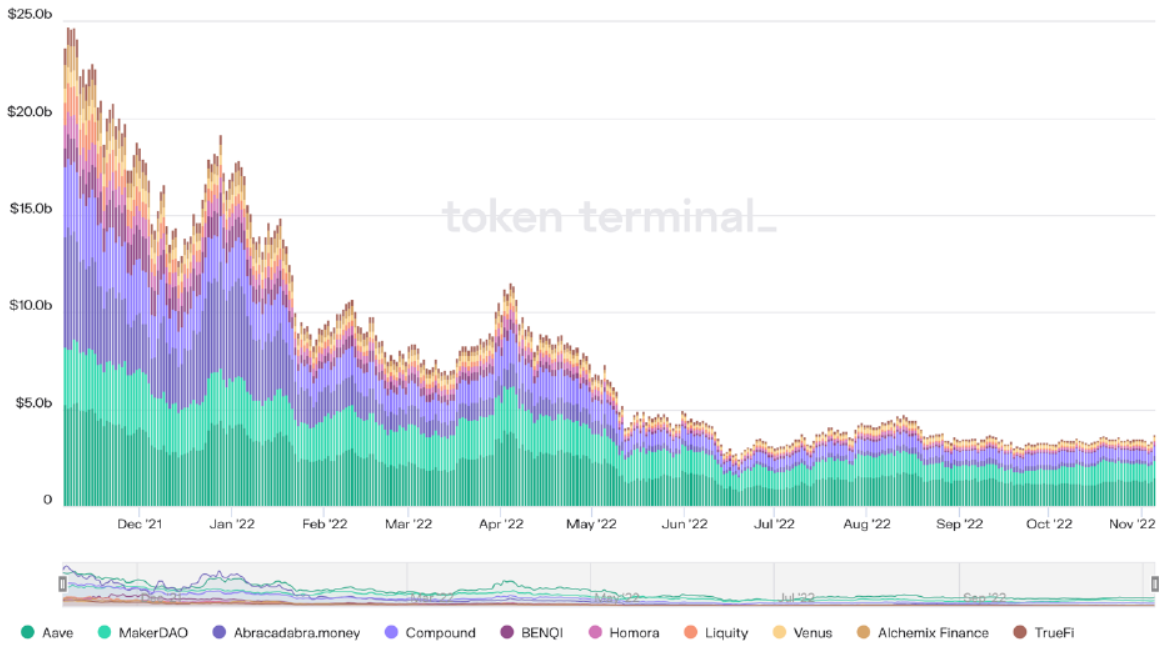
ETH remains the dominant DeFi platform. During the 2020 bull run, protocol explosions drove both token prices and yields upward, attracting massive inflows and increasing liquidity. But as the market declined in 2022, prices and yields fell simultaneously. Liquidity drained, triggering capital flight and worsening sentiment. Currently, even stablecoin deposit yields on major lending platforms are lower than U.S. Treasury returns. Recently, multiple protocols faced hacker attacks and incidents like Terra's collapse, prompting risk-averse investors to withdraw funds.
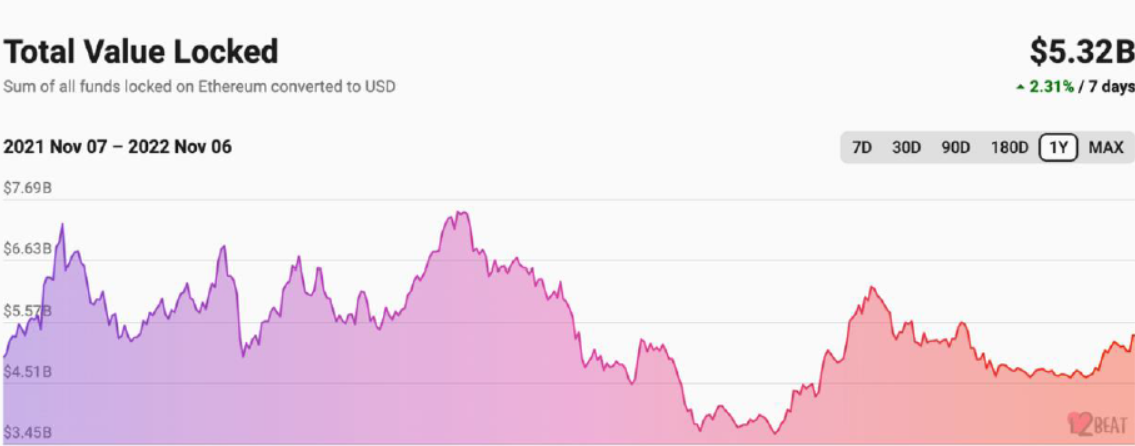
Under these conditions, Layer2 public chains gained momentum, enabling secondary development of DeFi ecosystems. Faster speeds and cheaper costs reduce entry barriers for retail users, making Layer2 an ideal time for expansion.
Observing Layer2 TVL, it peaked at $7.5 billion in April 2022, then fell to $3.7 billion by July. Unlike other ecosystems, Layer2 began recovering afterward, reaching approximately $5.32 billion. This resurgence stems from maturing technology, native token launches, and real-world application rollouts. Many Layer2 teams launched incentives such as pre-airdrop campaigns and token distributions. With continued advancements in Layer2 scaling, more innovative use cases and projects will emerge.
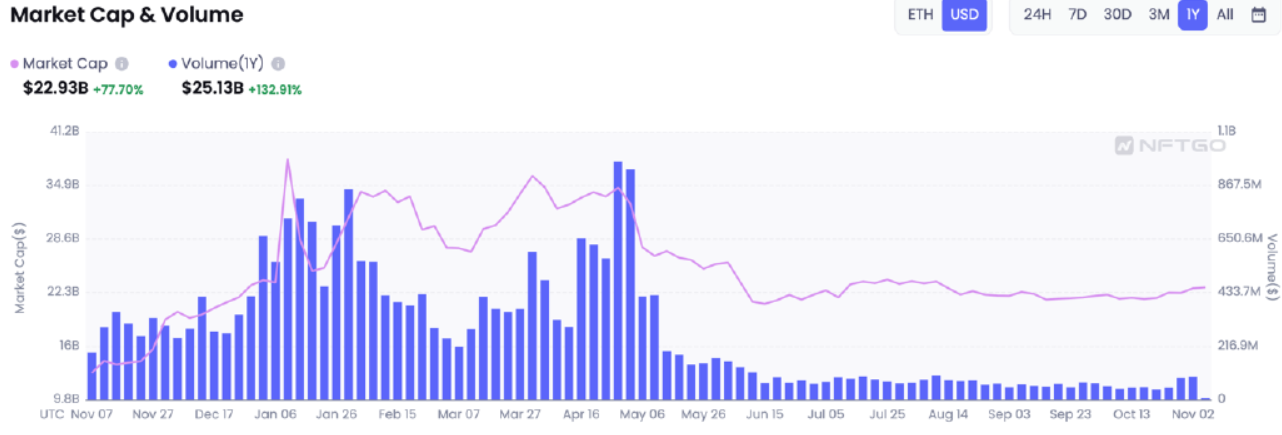
As market enthusiasm waned, NFT trading also stagnated. A brief volume spike occurred in May due to the “Otherdeeds for Otherside” (also known as Bored Ape land) sale, which generated FOMO. Meanwhile, the total NFT market cap dropped roughly 50%. Priced mainly in crypto terms, NFT valuations inevitably declined amid ETH volatility. NFT market cap fell from ~$35 billion to ~$21 billion—a 40% drop. However, because ongoing new NFT issuances continuously replenish the market, the decline wasn't as steep as ETH’s, simultaneously attracting non-NFT users.
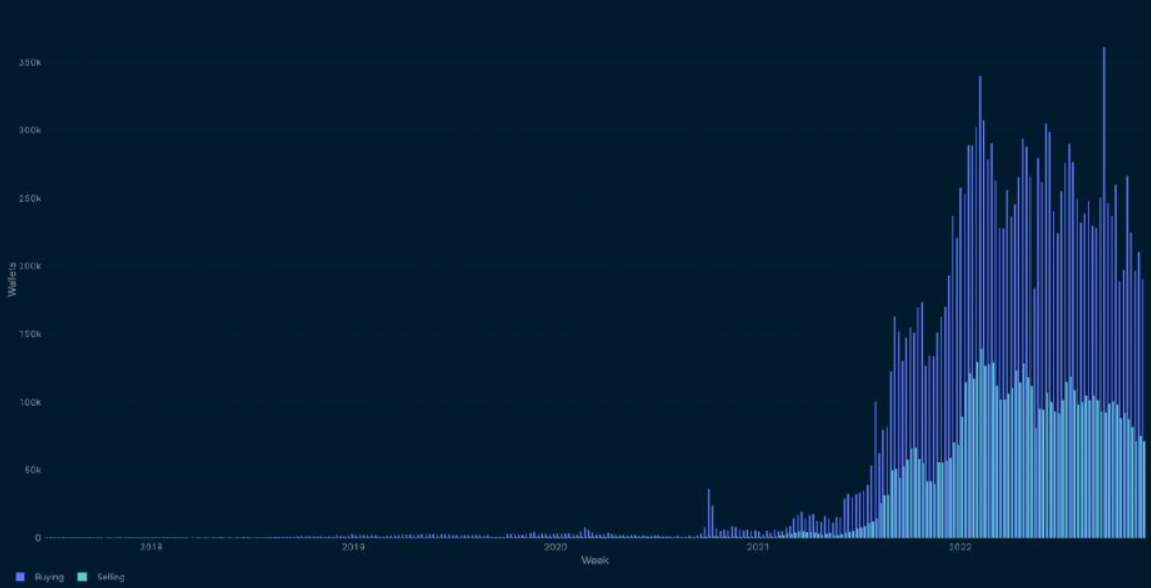
Despite the NFT market slump—with daily average trading volume now only 15% or less of bull market peaks—the number of wallets holding NFTs continues growing steadily, adding ~80k weekly (see chart). User numbers rise, new products launch, yet total NFT market cap slowly declines—a sign of bubble deflation. NFT prices are becoming rational, while ownership spreads widely, indicating healthy market development.
1.2.3 Investments: Seeking New Hope in a Bear Market
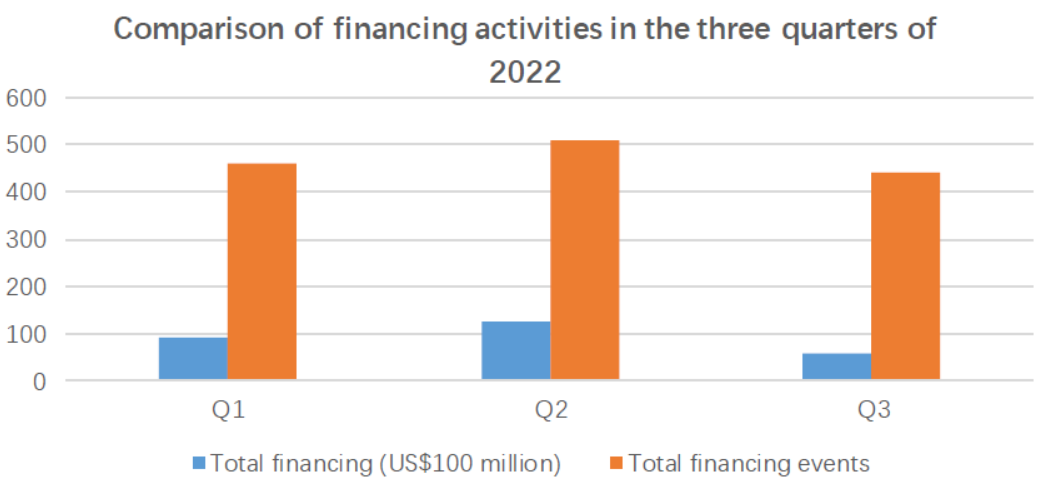
With crypto secondary markets underperforming, the primary market also struggled. According to Odaily Planet News' incomplete statistics, disclosed global crypto financing totaled $5.841 billion in Q3 2022 across 442 deals (excluding fund raises and M&A), distributed as follows: Infrastructure (20), Technology Providers (50), Financial Service Providers (49), Applications (246), and Other Service Providers (77). Application-focused projects received the most funding ($2.605 billion).
Based on publicly available information reported by Odaily and PANews, Q2 2022 saw 511 global crypto investment deals totaling $12.71 billion. Among these, 28 transactions exceeded $100 million. In Q1, there were 461 deals worth $9.2 billion. Both quarterly totals and amounts declined significantly compared to earlier in the year:
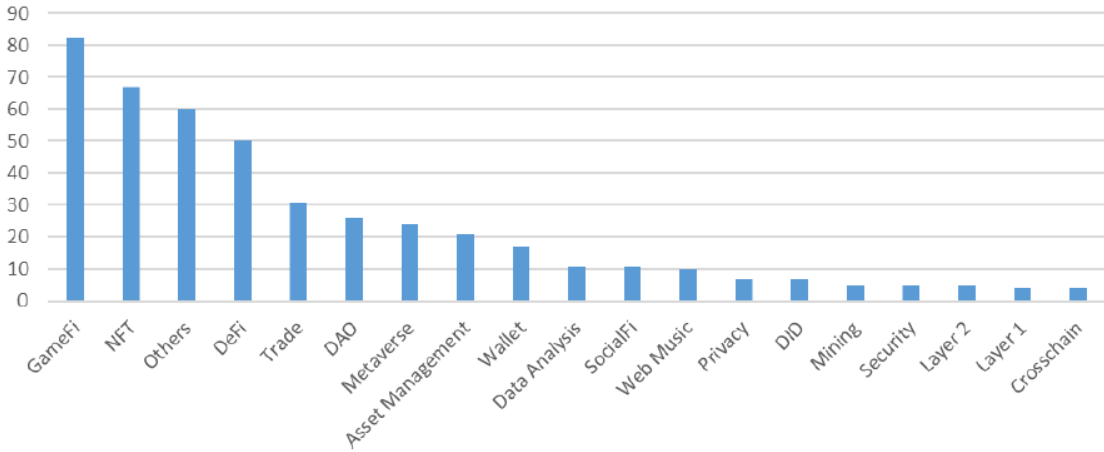
In Q2, global crypto investors favored GameFi and NFT. Projects related to gaming and its infrastructure secured 82 financings—the most in any category, representing 16% of total deals. GameFi funding reached $2.996 billion, accounting for 23.5% of total industry funding.
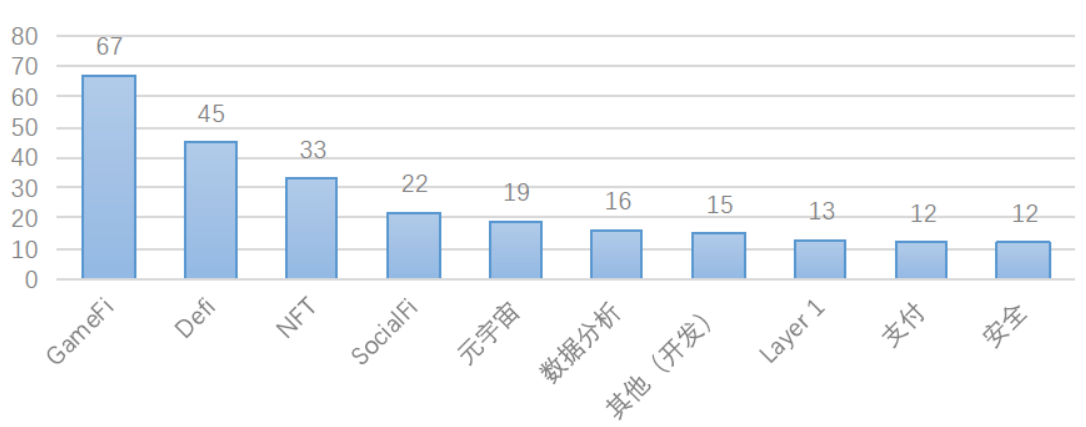
This investor focus on GameFi continued into Q3, where GameFi attracted $963 million—16.4% of total funding—through 67 deals (15% of total). These included blockchain game developers, guilds, and X2E-based games.
L1 projects performed well in Q3. Though only 13 L1 deals (3% of total), they raised $625 million—the second-highest amount after GameFi. Standout examples include Sui and Aptos, two Move-language public chains claiming Libra’s legacy. They emphasize enhanced L1 security, scalability, and large-scale network performance improvements. High-valued fundraising drew widespread attention, fueling a wave of new projects.
Prolonged bear market conditions forced many institutions to shut down, while others collapsed due to contagion effects. Most crypto investors shifted from bull market strategies, strengthening project vetting. Even so, exceptional projects stood out. Based on Huobi Research’s public survey results, institutional priorities fall into two main categories: infrastructure and applications. Infrastructure received the most mentions, particularly around ZK and new public chains. Middleware, data, oracles, and DID-related fields clearly belong to infrastructure. Top application areas include DeFi, GameFi, and social. Although DeFi has cooled recently, it remains the top long-term favorite.
[1 See Huobi Research report “20 Investment Institutions Reveal Where Future Opportunities Lie”]
2. Crypto Market Regional Analysis
2.1 Regional Market Traffic Analysis
After 14 years of development, crypto assets represented by BTC have spread globally, evolving rapidly from isolated pockets into broad adoption. To assess regional crypto market maturity, we evaluate penetration and development speed using four metrics:
(1) Crypto Population Size and Penetration: Crypto penetration rate refers to the proportion of crypto users within a country’s total population, directly reflecting crypto adoption levels.
(2) CEX Traffic[2]: Centralized exchanges are vital components of the crypto market. Easy to use, they often serve as gateways for newcomers, concentrating most users and liquidity. We selected the top 100 CEXs based on user activity, depth, trading volume, and reliability.
(3) DeFi Traffic[3]: DeFi grew rapidly over the past two years. With innovations like AMM and yield farming, it attracted vast capital and engaged seasoned users. Analyzing DeFi protocols helps understand distribution patterns of expert crypto users. We analyzed ~300 leading DeFi projects across various blockchains based on TVL, trading volume, and DAU.
(4) Keyword Popularity: Web search interest reflects broader public engagement with the crypto space.
[2] Targeted CEXs include Binance, Coinbase, FTX, Kraken, Kucoin, Huobi Global, Gate.io, Bitfinex, Bitstamp, Coincheck, Gemini, Bybit, MEXC, Bithumb, OKX, Poloniex, etc.; traffic data sourced from SimilarWeb.
[3] Selected DeFi targets include MakerDAO, Lido, Curve, AAVE, Uniswap, Convex Finance, Justlend, Pancakeswap, Compound Finance, Instadapp, Balancer, Sushiswap, GMX, Yearn.finance, Synthetix, dYdX, etc.; traffic data from SimilarWeb.
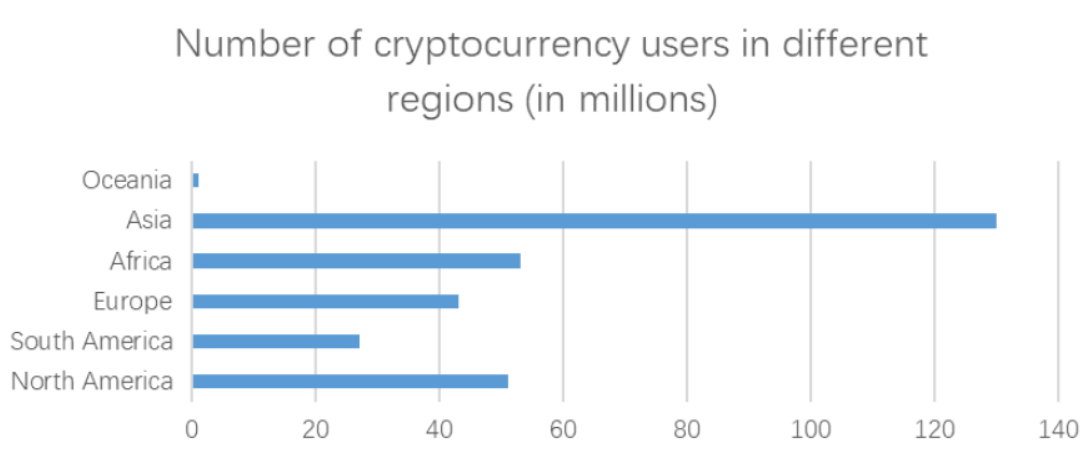
2.1.1 Slowing Global Crypto User Growth, Asia Accounts for Over 40%
The following chart illustrates verified global crypto user counts, compiled from exchange registrations, wallet data, and various service providers.
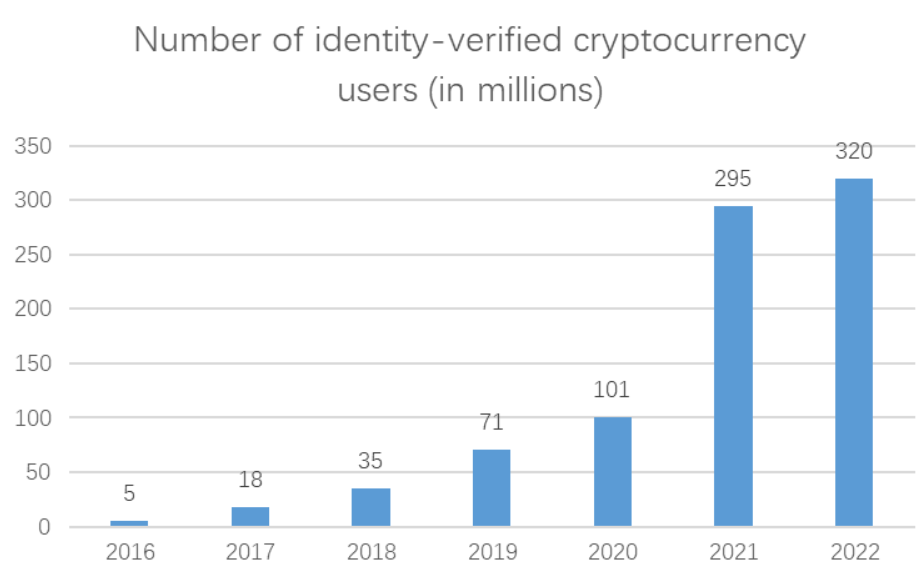
From 2018 to 2020, the global crypto market was nascent, with slow user growth. Afterward, vibrant ecosystem developments sparked exponential growth. As shown, 2021 saw the highest growth rate and absolute increase—driven partly by institutional entries and NFT mania igniting broader interest. Entering 2022, despite the global economy nearing recession, the falling crypto market displayed surprising resilience. Globally, the number of crypto users continued net positive growth. By November 2022, global crypto users totaled ~320 million (penetration ~4.3%). Asian users comprised the largest share (~40%)
2.1.2 U.S., South Korea, Russia Lead CEX Traffic Rankings
Our data shows CEX market size declined sharply in 2022 compared to 2021. Specifically, total crypto market cap dropped ~66% over the past year, spot trading volume fell ~27%, and unique visitors decreased 24%. These figures indicate declining monthly visit volumes to centralized exchanges from both desktop and mobile users, consistent with the market entering a deep bear phase. Falling prices and shrinking assets reduced existing users’ trading interest.
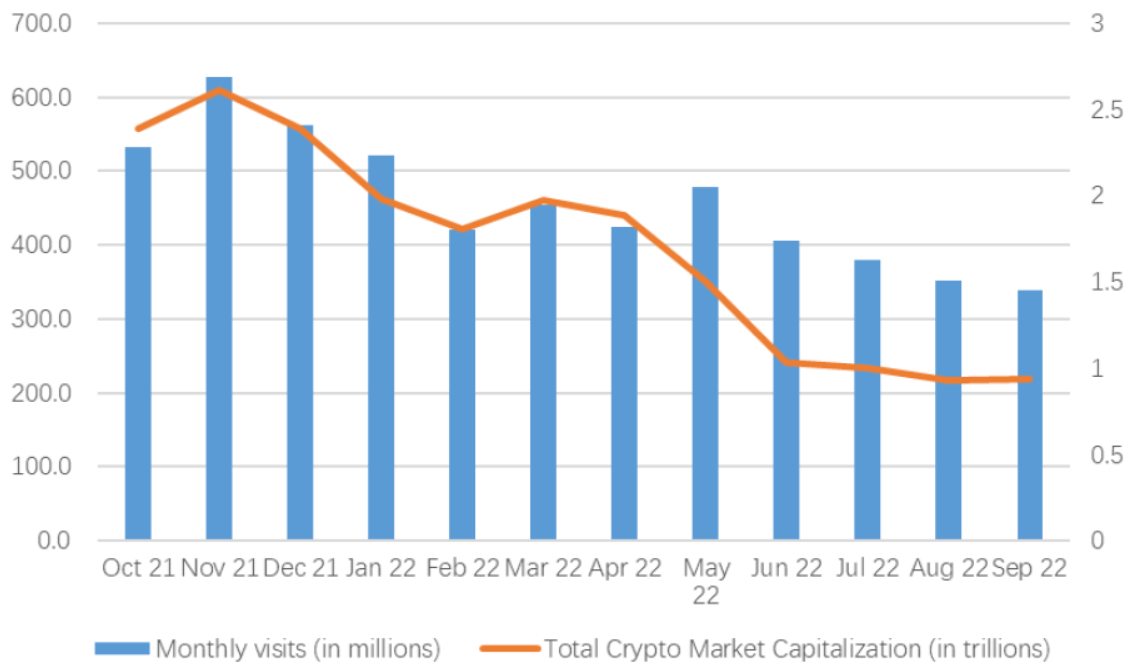
The chart above shows the relationship between major CEX monthly traffic and total crypto market cap over the past year. Their correlation coefficient is 90.8%, indicating strong positive correlation. Two points deserve note. First, slight divergence occurred in May 2022—possibly due to black swan events like the LUNA crash, forcing users to sell or buy aggressively, temporarily boosting exchange traffic. Second, although exchange traffic declined, its decrease was far smaller than the drop in market cap. This suggests substantial existing users remain actively engaged.
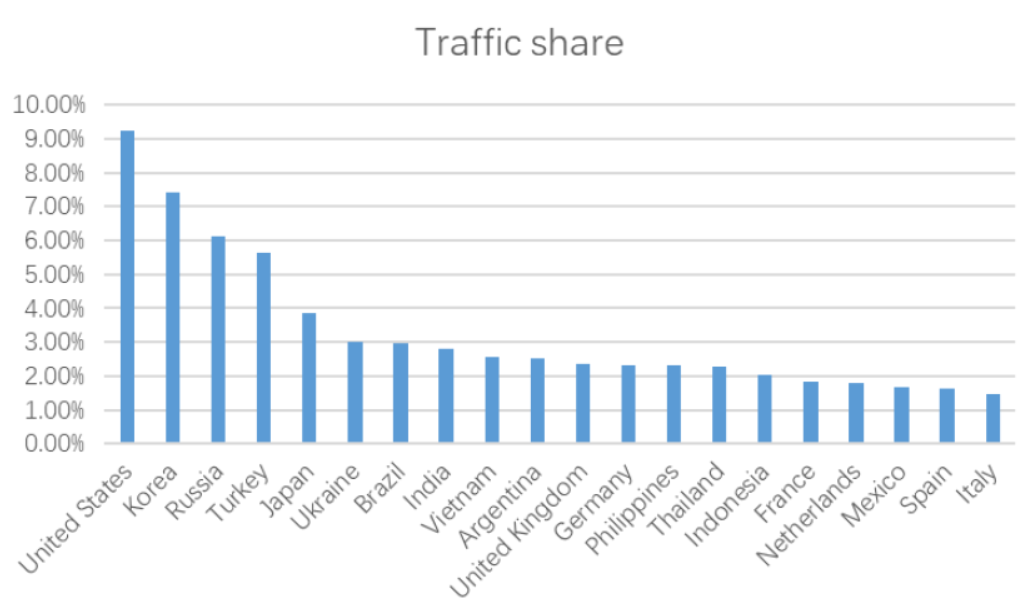
Among CEX traffic shares, the U.S. leads due to sheer user base and market size. South Korea, Russia, Turkey, and Japan follow with 7.4%, 6.1%, 5.6%, and 3.8% respectively. Leading countries generally have friendlier crypto policies. In South Korea and Japan, high unemployment and housing prices combined with rigid class structures push youth toward crypto investing as a path to wealth. Russia’s sanctions prompted adoption of freer financial systems. Turkey suffers chronic high inflation, making crypto an effective substitute currency.
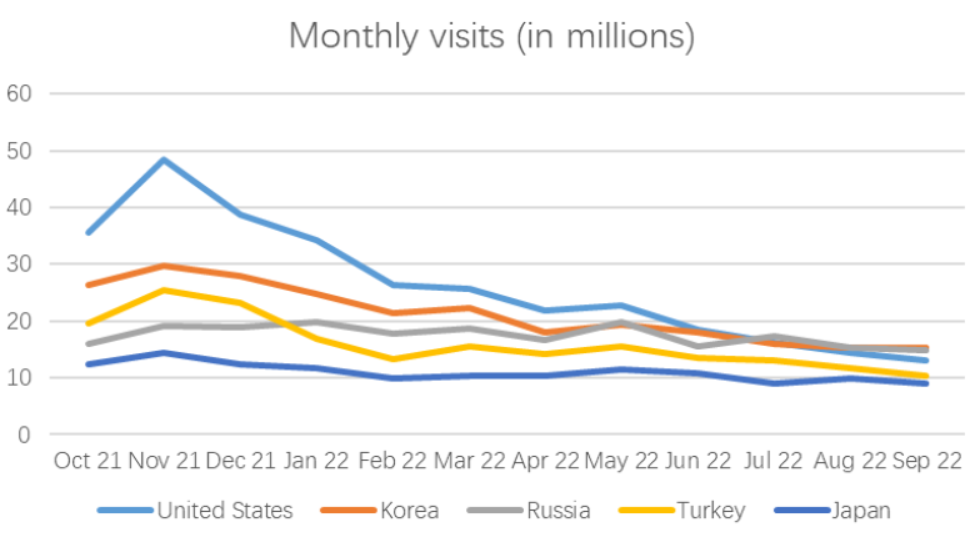
The graph above shows monthly visitor trends for the top five countries. Decline rates were: U.S. (72.9%), South Korea (48.6%), Russia (25.6%), Turkey (59.6%), and Japan (38.6%). The U.S. saw the sharpest drop, largely due to macroeconomic pressures—Fed rate hikes altered risk preferences. Russia declined least—global sanctions made borderless crypto useful as a supplementary payment and trade channel.
2.1.3 U.S. Dominates DeFi Users
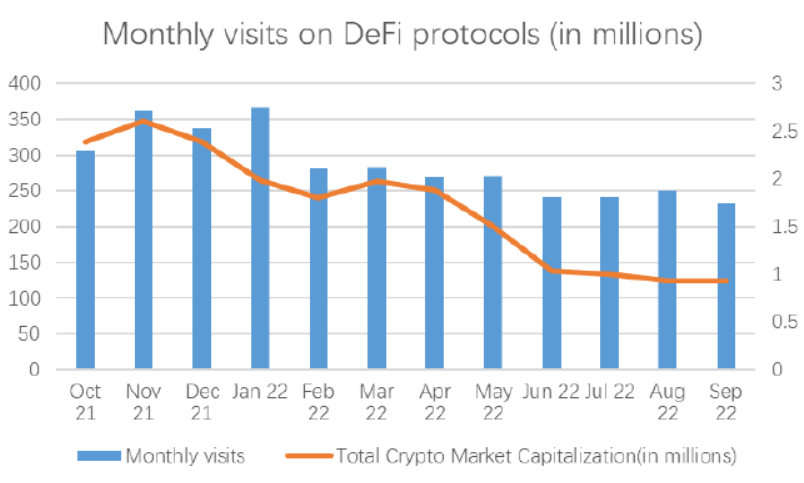
Globally, independent DeFi user numbers increased modestly over the past year. Despite repeated hacks, de-pegging, and attack incidents, DeFi’s long-term value and core functions kept users confident and optimistic about future recovery. Thus, we believe DeFi fundamentals remain relatively healthy.
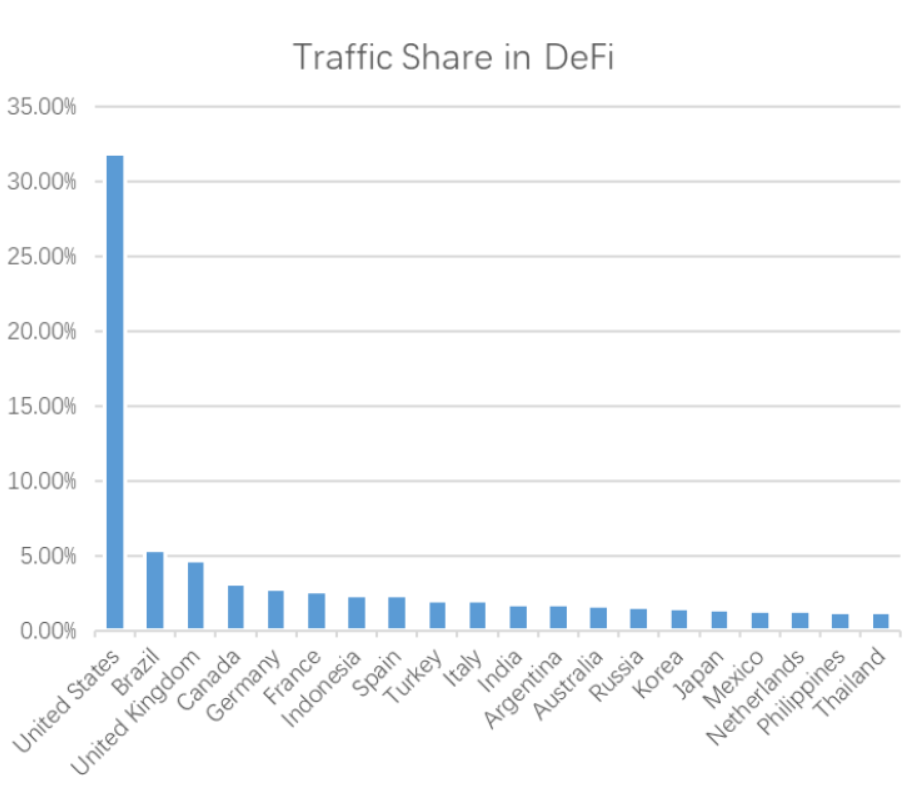
By region, the U.S. dominates DeFi market share (31.8%), far ahead of others—linked to DeFi's origins in the U.S. Recent pro-crypto shifts attracted talent and capital, drawing startups to tech hubs like Silicon Valley and New York. Unlike CEX traffic, developed Western nations lead in DeFi usage due to higher financial literacy and sophisticated investor bases. Brazil ranks second, benefiting from being Latin America’s largest crypto market. Some banks and investment firms now offer crypto-linked services, including QR Capital and Hashdex launching DeFi ETFs, aiding普及.
2.1.4 “NFT” Emerges as the Top Global Crypto Topic
We collected major crypto-related keywords over the past year, selecting the five most frequent terms (unordered) to visualize regional interest distribution.
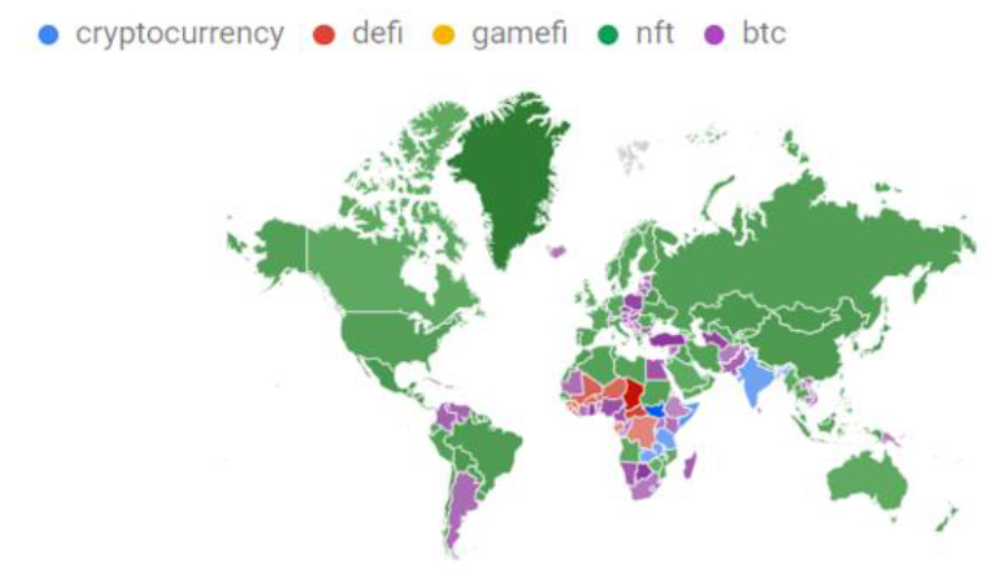
Keyword analysis shows “BTC,” “DeFi,” and “Cryptocurrency” dominate in South America, South Africa, and the Middle East—regions with weak financial infrastructure and persistent high inflation, where crypto serves as excellent alternatives for payments and value storage. Surprisingly, “NFT” achieved near-universal reach. Its ability to integrate with sports, art, entertainment, culture, and gaming enabled crossover appeal. Combined with unique community cultures and wealth effects, NFTs sparked a global craze.
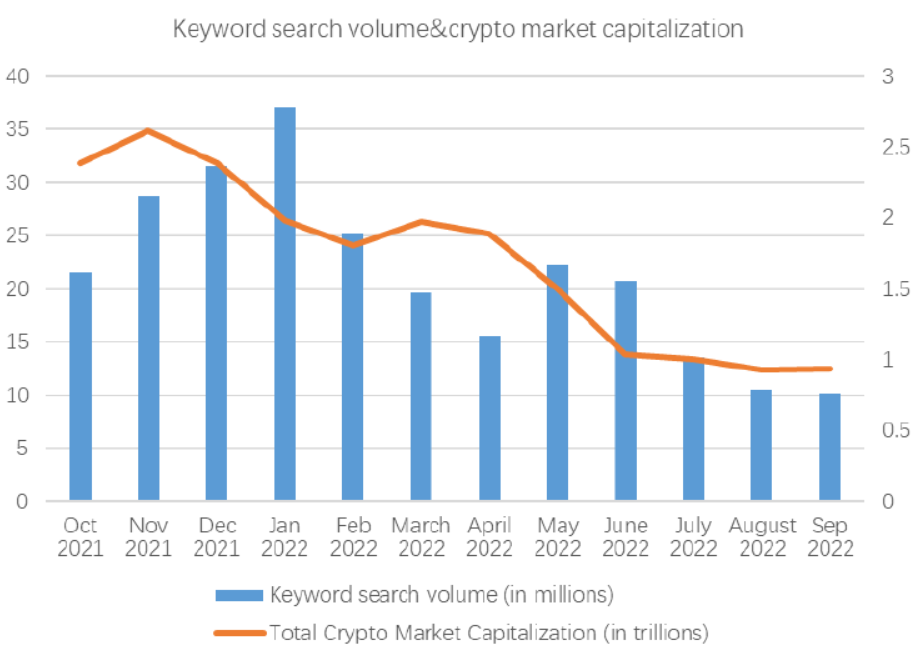
The chart above shows search volumes for major crypto topics over the past 15 months, reflecting public interest. NFT's 2021 boom brought crypto mainstream attention, pushing keywords onto internet trend charts. In 2022, as the overall market declined, industry interest faded. Back-to-back incidents in Q1 and Q2 further dampened fragile sentiment. After limited hot events ended in late 2022, global crypto interest entered relative silence. Because negative news attracts readers, search peaks often coincide with rapid price drops and bad headlines. Yet over longer periods, public interest has halved.
2.2 Regional Market Industrial Analysis
2.2.1 North America: DeFi Innovation Hub
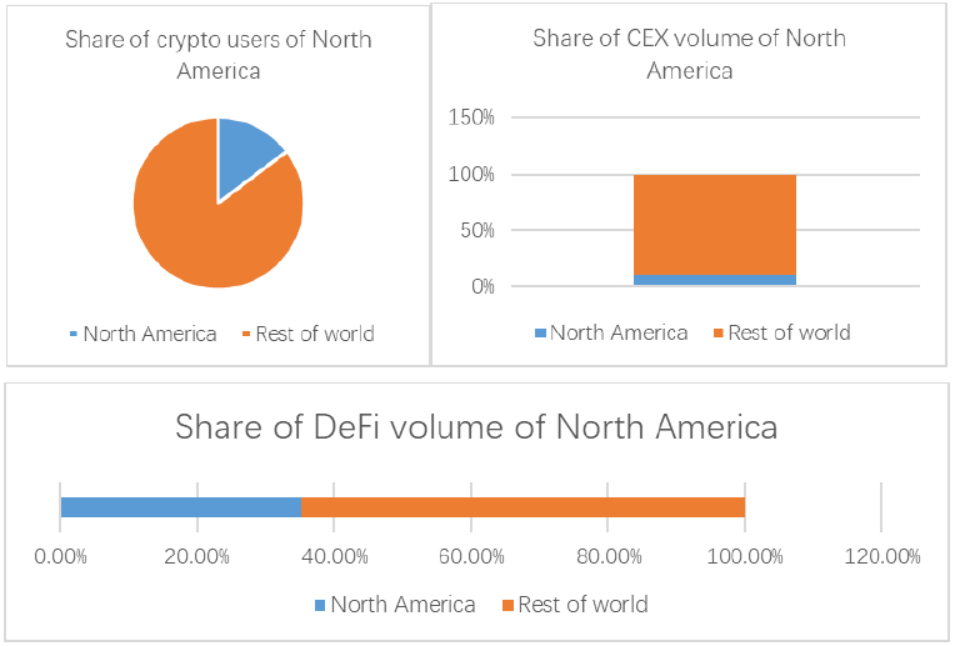
North America plays a crucial role in the global crypto market, hosting ~47 million users (14.7% of global crypto population). As one of the world’s most developed economies, the region maintains an active crypto scene. DeFi activity here is especially strong. Below, we analyze the U.S., a key North American nation.
●United States: Barometer of the Crypto Market
Over recent years, American attitudes toward crypto evolved noticeably. Growing awareness drives wider participation. Our listed metrics confirm the U.S.’s leading position across dimensions.
Currently, the U.S. hosts ~46 million crypto users (13.7% of population), contributing 9.2% of CEX and 31.8% of DeFi traffic. On U.S.-based CEXs, BTC is the preferred asset, followed by ETH, DOGE, ADA, and others. Notably, the U.S. leads globally with ~$1.5 billion in BTC trading volume. These leading data explain why crypto price movements often correlate strongly with U.S. risk markets—especially since 2022, when crypto trends closely followed Fed policy. Additionally
Join TechFlow official community to stay tuned
Telegram:https://t.me/TechFlowDaily
X (Twitter):https://x.com/TechFlowPost
X (Twitter) EN:https://x.com/BlockFlow_News