Three-Year Bull Market: A Comprehensive Review of 21 Leading Public Blockchains
TechFlow Selected TechFlow Selected
Three-Year Bull Market: A Comprehensive Review of 21 Leading Public Blockchains
Ethereum's tremendous success has made public blockchain platforms with smart contract capabilities the holy grail pursued by capital.
 Navigating Web3 tides with focused insights
Picking up from our previous article, "Analyzing 5 Million Data Points from Crypto's Three-Year Bull Market," LUCIDA analyzed the overall macro performance of the crypto market over the past three years.
In this article, LUCIDA collaborates with research partners from SnapFingers DAO to review the "public blockchain" landscape.
Introduction
Ethereum’s immense success has made smart contract blockchains the holy grail pursued by capital. Currently, Ethereum remains the largest and most important platform among smart contract blockchains. However, due to low performance and high fees, many applications are unsuitable for running on Ethereum.
New blockchains have captured these overflow demands from Ethereum through superior performance and lower costs. Particularly during the 2021 bull market, numerous applications emerged, leading to successive explosions in new blockchain ecosystems—from BSC to Polygon, then Solana, along with significant growth in Avalanche, Fantom, and Terra. As Vitalik Buterin stated on Twitter, “The future will be multi-chain,” and perhaps this bull cycle’s pattern of blockchain growth offers some insight into the future “multi-chain” landscape.
1. Public Blockchain Market Performance During the 2020–2022 Bull Market
Public blockchains are the infrastructure and most critical component of the cryptocurrency market. The public blockchains discussed in this article include smart contract platforms and cross-chain platforms, totaling 21 chains. In addition to Ethereum, other selected samples and classifications are as follows. Sample selection criteria: top 100 by market cap, having established their own ecosystem, and possessing a certain level of attention.
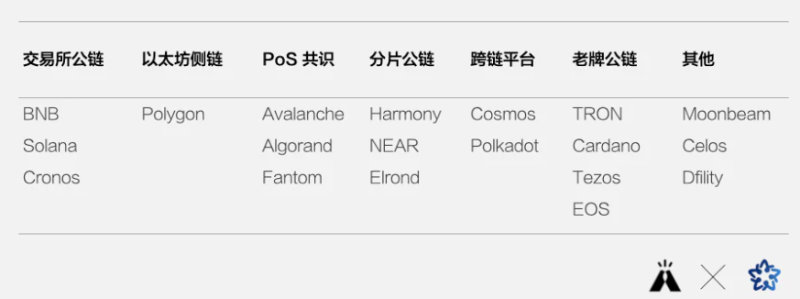
The 21 public blockchain sample set studied in this article
For subsequent analysis, we also conducted data cleaning and preprocessing.
1.1 Construction of the Public Blockchain Price Index
The price movements of the 21 blockchains vary widely and inconsistently. To make it easier to observe the overall sector performance, we created a weighted blockchain index (Chain_Index). The specific algorithm for the blockchain index (Chain_Index) is as follows:
Daily blockchain index price = ∑ Daily closing price of constituent assets × Daily weighting coefficient of constituent asset
Daily weighting coefficient = Average daily trading volume of the asset over the past 30 days / ∑ Average daily trading volumes of all sample assets over the past 30 days
To facilitate observation of the overall status of the blockchain sector, we visualized the blockchain index prices using a logarithmic scale on the axes.
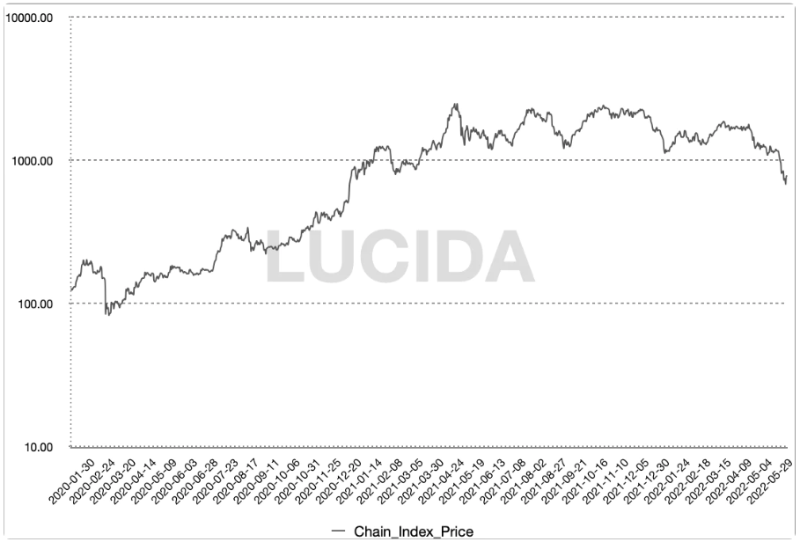
LUCIDA Blockchain Price Index
1.2 The Blockchain Sector Delivered Superior Excess Returns and Risk-Adjusted Returns During the Bull Market
-
During this bull market, the maximum increase of the blockchain index was 3013%, with the lowest point occurring on March 16, 2020—right after the March 12 crash—and the highest point reached on May 11, 2021.
-
The maximum drawdown of the blockchain index was 36.4%, occurring between February 18, 2021, and February 28, 2021.
-
The bear market maximum decline of the blockchain index (as of data collection date June 20, 2022) was 72.5%.
If we compare the blockchain index’s maximum gain, maximum drawdown, and bear market decline against Bitcoin’s performance during the same period, we find that the blockchain sector as a whole delivered better risk-adjusted returns than Bitcoin. Moreover, so far, the blockchain sector has not shown signs of overselling during the bear market, meaning its defensive characteristics are no worse than Bitcoin’s. (However, if the bear market continues, there remains a possibility of further downside correction in blockchain assets.)
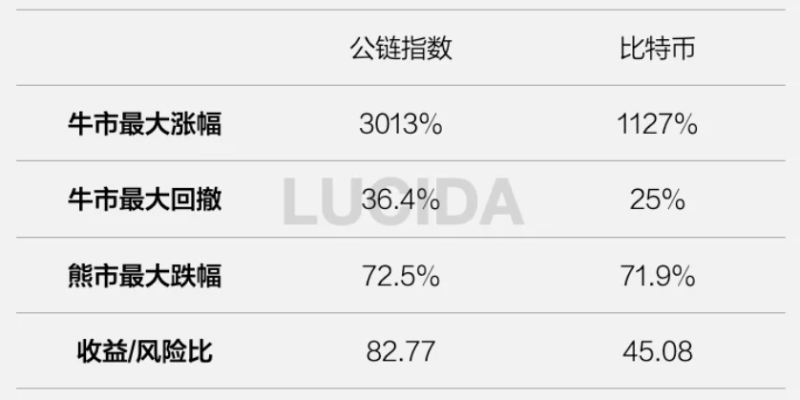
Comparison between Blockchain Index and Bitcoin
1.3 Significant Divergence in Maximum Gains Across Blockchains: Some Achieved Thousandfold Gains, Others Peaked at Launch
Next, LUCIDA conducts individual data analysis on these 21 blockchains.
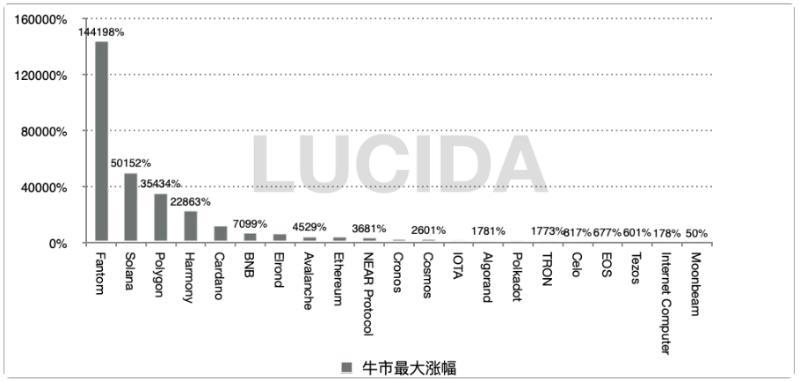
Bar chart showing maximum bull market gains across 21 blockchains
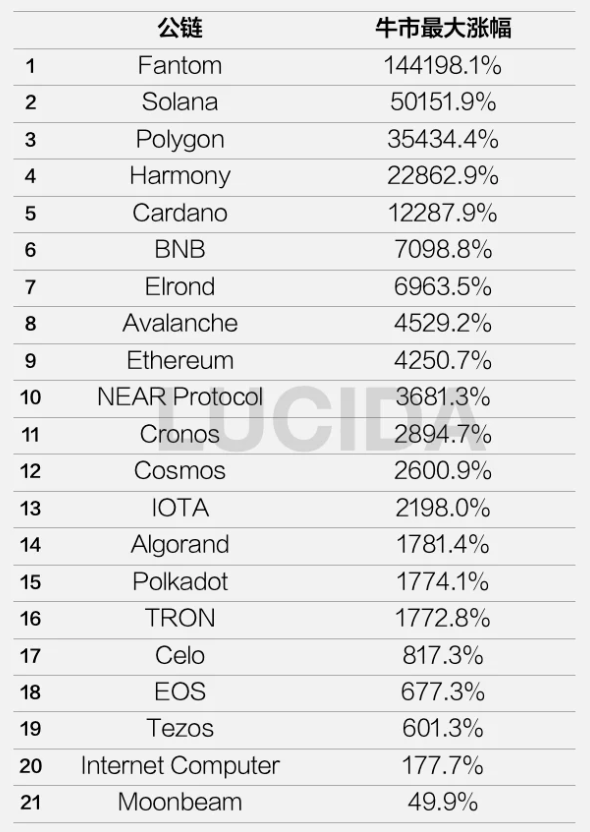
Maximum bull market gains across 21 blockchains
Let’s first examine returns.
The above chart shows the maximum gains achieved by each of the 21 blockchains during the bull market. First place goes to Fantom (FTM), reaching 144,198%, followed by Solana with a maximum gain of 50,152%.
LUCIDA also found that the distribution of maximum gains within the blockchain sector is highly dispersed:
-
First tier (100x+): Fantom 144,198%, Solana 50,151%, Polygon 35,434%, Harmony 22,862%, Cardano 12,287%
-
Second tier: Represented by Binance, Avalanche, and Ethereum, with maximum gains under 100x.
-
Third tier: Represented by Internet Computer and Moonbeam, which peaked at launch.
Therefore, LUCIDA believes investing in blockchains requires careful selection; otherwise, investors may easily get trapped in deep losses.
1.4 Maximum Drawdown Across Blockchains Was Around 60%, Lasting Two Months; BNB Was the Most Resilient
Having discussed return distributions, let’s now turn to risk aspects.
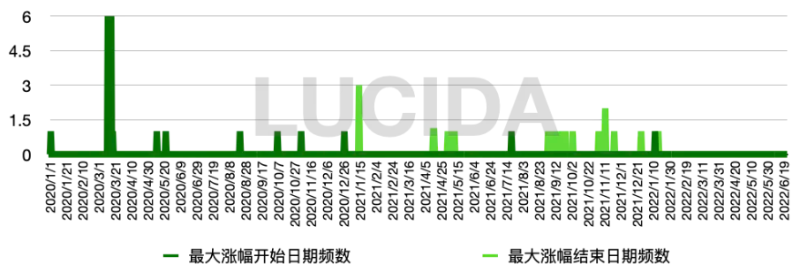
The green chart below shows the timing distribution of maximum gains across the 21 blockchains: the majority began rising between March and August 2020 and gradually peaked between September and December 2021, with an average uptrend lasting 467 days.
The red chart below shows the timing distribution of maximum drawdowns: most blockchains experienced their deepest declines between February and May 2021, stabilizing and rebounding between June and August 2021, with an average drawdown period of 69 days and an average drawdown magnitude of 59.9%.
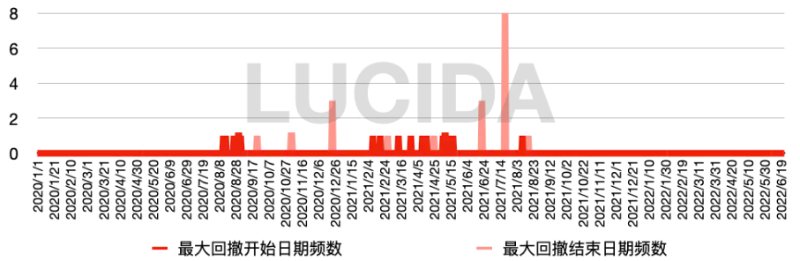
Notably, BNB had a maximum drawdown of only 36.9%, recovering all losses within just 9 days, making it the most resilient blockchain during the bull market.
2. Development Landscape of the Public Blockchain Sector During the 2020–2022 Bull Market
After reviewing the overall sector performance, LUCIDA now examines the internal competitive landscape. Within the blockchain sector, Ethereum stands undisputed as the leader, consistently maintaining over 50% market share. However, when dissecting the sector by TVL (Total Value Locked) share and market cap share, interesting patterns emerge.
Starting in February 2021, Ethereum’s TVL share suddenly declined, while BNB Chain rose rapidly, driving down Ethereum’s dominance alongside Polygon, Solana, Tron, and Avalanche.
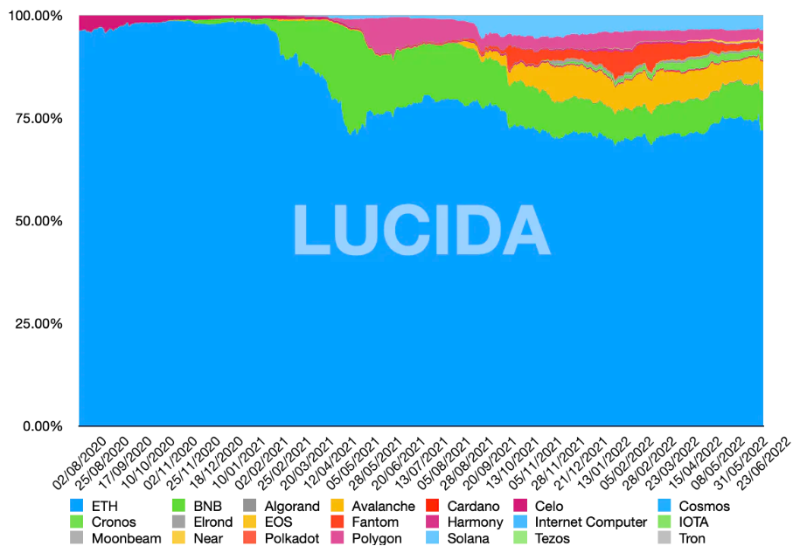
Stacked area chart showing TVL share across major blockchains
From a market cap perspective, Ethereum’s share also dropped sharply starting in February 2021.
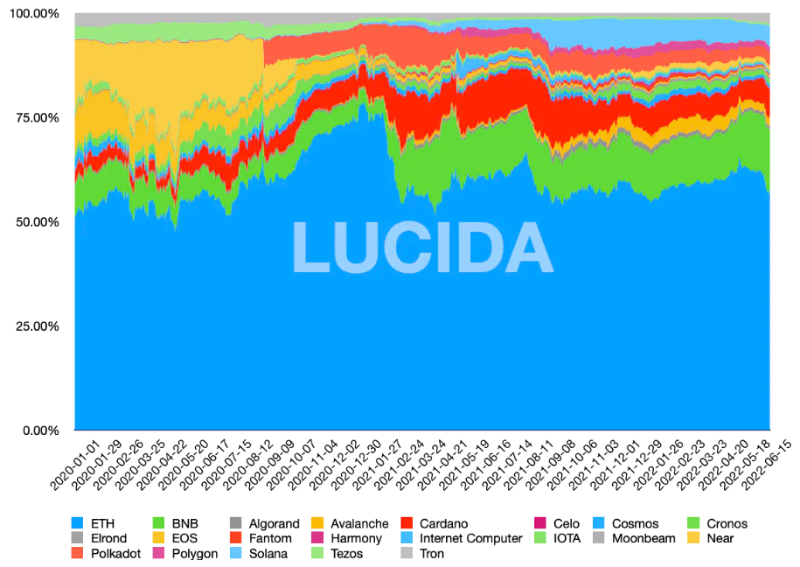
Stacked area chart showing market cap share across major blockchains
Note: Data sourced from DefiLlama. The platform does not provide TVL data for Internet Computer, IOTA, or Polkadot, and TVL data only begins from August 2020. This slightly affects quantitative calculations of TVL share but should not impact qualitative analysis in this text.
3. Drivers Behind the 2021 Bull Market Blockchain Explosion
3.1 DeFi Overcrowded Ethereum
After the DeFi Summer in June 2020, interaction demand on Ethereum surged dramatically, causing gas fees to skyrocket. Compound’s introduction of liquidity mining ignited the DeFi space. In July, yield farming with food-themed tokens swept across the crypto world, and high yields fully energized the entire crypto community. Although these high yields were unsustainable, DeFi rose again in Q4 after one cycle of maturation. By year-end, not only did many new projects launch, but existing top-tier projects also became more active.
Alongside DeFi’s boom, Ethereum’s daily gas fees surged from $447,000 to $49.55 million—an over 100-fold increase between June 2020 and February 2021—with DeFi transactions accounting for the largest and fastest-growing share.
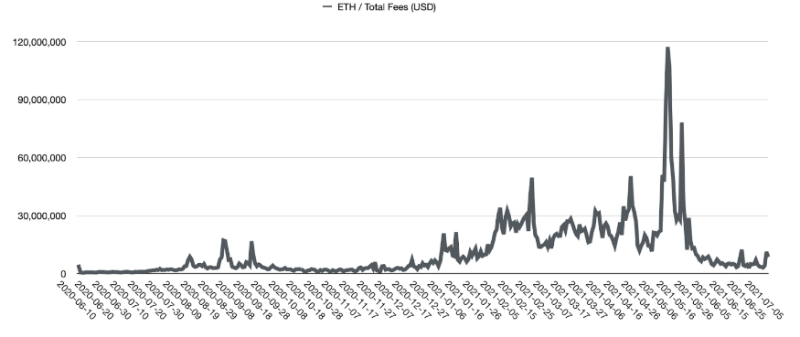
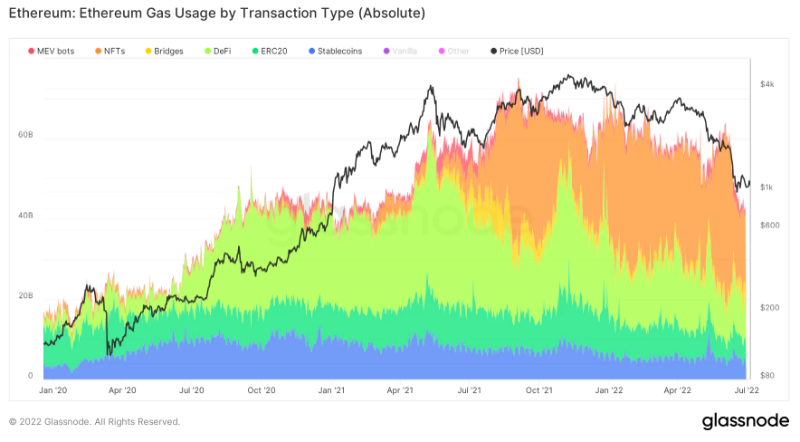
Gas fee breakdown by use case
3.2 BSC First Captured the Opportunity in the Blockchain Race
With Ethereum gas fees remaining stubbornly high and DeFi wealth creation raging, massive unmet demand created an opening for new blockchains. The first to seize this opportunity was BSC (later renamed BNB Chain), officially launched in September 2020. Subsequently, Binance announced a $100 million seed fund to support DeFi projects and developers on the BNB Chain, further enabling synergy between CeFi and DeFi ecosystems. On February 2, 2021, just five months after launch, BNB Chain hit a milestone—1 million unique addresses. On February 9, BNB Chain surpassed Ethereum in daily transactions, recording over 1.6 million compared to Ethereum’s 1.32 million.
By being EVM-compatible, BNB Chain absorbed overflow demand from Ethereum. It also empowered its ecosystem by using BNB tokens for project launches (IEO). In February 2021, the explosive growth of DeFi on BNB Chain and the rising price of BNB formed a mutually reinforcing positive feedback loop.
3.3 Polygon, Fantom, Harmony, Avalanche, and Others Used Incentive Mechanisms to Drive Growth
Subsequently, Polygon’s breakout in April–May also leveraged EVM compatibility. Unlike BNB Chain, which used BNB token utility for ecosystem empowerment, Polygon launched a $150 million incentive fund in late April, including a $40 million liquidity mining program that directly attracted top Ethereum DeFi protocols like Aave. Within two months, Polygon’s TVL increased up to 68 times.
Ecosystem incentives became the standard playbook for subsequent blockchains seeking growth. From September to October 2021, Fantom, Harmony, Avalanche ($180 million), Celo, and NEAR successively rolled out incentive programs. Some chains chose EVM compatibility—such as BNB Chain, Polygon, and Fantom—since this allowed easier migration of Ethereum-based developers and protocols.
3.4 Solana’s “Light Tech, Heavy Ecosystem” Strategy Enabled a Sudden Overtake
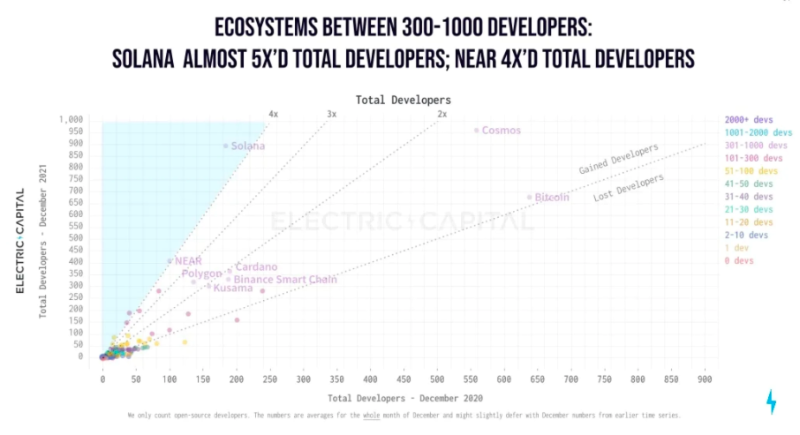
Solana ranks among the top performers in blockchain token gains, thanks to its strategy of prioritizing ecosystem development over complex technology. Compared to well-known PoS chains like Avalanche and Algorand, Solana adopted a relatively centralized technical approach, significantly reducing implementation difficulty and allowing rapid deployment to meet market needs. To boost ecosystem vitality, the Solana team and its investors implemented various incentive measures—introducing liquidity mining, subsidizing developers, hosting hackathons, and providing grant funding.
As shown in the chart below, Solana attracted a large number of developers. In 2021, both the number and growth rate of developers in the Solana ecosystem ranked among the highest.
3.5 NFTs Reignited Demand for Blockchains
From the second half of 2020 to the first quarter of 2021, NFTs were the biggest source of demand for blockchains.
In Q2 2021, NFTs took over from DeFi as the second major application domain generating substantial transaction demand. With celebrities joining in, NFTs began to go viral beyond niche circles, attracting numerous investors and projects. The scale of NFT trading continued to expand. As the leading blockchain, Ethereum held an absolute advantage in capital, developer count, and ecosystem size, thus hosting the most NFT projects. At the same time, NFT sectors on other blockchains also grew rapidly. For example, Solana’s NFT trading volume even rose逆势 during a market downturn in May 2021. It is now the second-largest NFT ecosystem after Ethereum.
3.6 Specific Reasons Behind the Blockchain Rotation Logic
Thus, we can say this bull market’s blockchain explosion was driven by application-layer prosperity and Ethereum’s scalability limitations. The logic behind blockchain rotation can be summarized into several key reasons:
-
DeFi’s popularity caused prohibitively high gas fees and congestion on Ethereum—a situation that persisted into 2021—while the sequential rise of NFTs and GameFi kept pressure on blockchain scalability.
-
During the bull market, the huge demand from various applications enabled blockchains with faster tech deployment and strong financial backing to seize early advantages and attract diverse applications into their ecosystems.
-
Different blockchains have varying resource endowments. Even when applying the common formula of “EVM compatibility/cross-chain bridge + ecosystem incentives,” specific strategies differ: BNB Chain and Solana empower via platform tokens, while Polygon attracts top-tier Ethereum DeFi protocols.
-
EVM compatibility allows quicker access to Ethereum’s achievements, including forked protocols and developers.
3.7 Cosmos and Polkadot’s High Technical Difficulty and Slow Deployment Limited Their Gains
A counterexample is Cosmos and Polkadot, which did not benefit much from this bull market. Their challenges stem from high technical complexity, slow real-world deployment, poor compatibility with Ethereum, and reliance on separate cross-chain bridges to connect with Ethereum.
LUCIDA believes this explains why, in the earlier section “1.3 Maximum Gains Across Blockchains,” Cosmos and Polkadot ranked only 12th and 15th in terms of peak gains.
4. Moats of Public Blockchains
After one full bull cycle, new blockchains have attracted developers and users and built their own infrastructure and application ecosystems. As V God said, the future will be multi-chain. So what moats have these blockchains built post-bull run?
4.1 Ethereum
Ethereum ranks second in cryptocurrency market capitalization, with a long-term market share between 17% and 22%, making it profoundly significant to the entire crypto market. According to the “Q1 2022 Ethereum Ecosystem Report,” Ethereum hosts 4,011 stable-running DApps and over 7,220 smart contracts.
Ethereum possesses the strongest moat among blockchains, featuring high decentralization and security, a large user base, and abundant developers. Its infrastructure is mature (wallets, oracles, developer tools), offering diverse applications and creating strong network effects. It serves as fertile ground for innovation and has consistently led trends in blockchain applications:
-
(2017–2018) At the end of 2015, Ethereum introduced the ERC20 standard, which directly fueled the 2017 ICO-driven bull market. In 2017, the issuance of smart contracts expanded the technological boundaries of blockchain, bringing it into mainstream awareness. During this cycle, Ethereum’s second-place market cap was solidified, boosting valuations across other smart contract platforms and infrastructure sectors. Within the ETH ecosystem, DApp numbers exploded, and NFTs, blockchain games, and fork coins showed clear upward momentum, establishing ETH as a benchmark for altcoins.
-
(2020–2021) In this cycle, total crypto market cap peaked at $3 trillion, with Ethereum processing over $3.6 trillion in transaction value. Ethereum’s market share rose from around 11% at the start of 2021 to about 20%. Key themes included DeFi (DEX, AMM, liquidity mining, collateralized lending), NFTs, memes, GameFi, and the metaverse.
-
(2021–Q1 2022) In this smaller market cycle, beyond the continuation of NFT and DeFi trends, market re-evaluation of blockchain valuation logic pushed up blockchain prices.
Throughout these cycles, only 10%–20% of projects survive bear markets and grow into blue-chip assets and essential infrastructure in the next cycle.
Despite the multi-chain trend diluting Ethereum’s share of Total Value Locked (TVL), the rollout of Layer 2 scaling solutions has been pivotal. While new blockchains分流 Ethereum’s developers, users, and applications, Ethereum itself improved via the EIP-1559 upgrade, reducing gas volatility and ETH issuance rate, paving the way for multiple L2 protocols such as Optimism, Arbitrum, and dYdX.
4.2 Binance Smart Chain
BSC officially launched in September 2020. Shortly after BSC’s TVL surpassed $15 billion in Q2 2021, it more than doubled to $35 billion within ten days, driven by sharp increases in BNB and its derivative products (like CAKE and XVS).
After the May 19 crypto market crash, BSC became the most frequently targeted platform for hackers, suffering six consecutive attacks, primarily via flash loans, with generally large losses, significantly impacting its token price in the short term. A series of negative events—including the Venus liquidation incident losing $200 million and the PancakeBunny flash loan attack worth $45 million—quickly erased the euphoria from record highs. Rising exploit incidents eroded user confidence, triggering sharp drops in token price and TVL. From March to September 2021, BSC maintained an average TVL market share of around 15%.
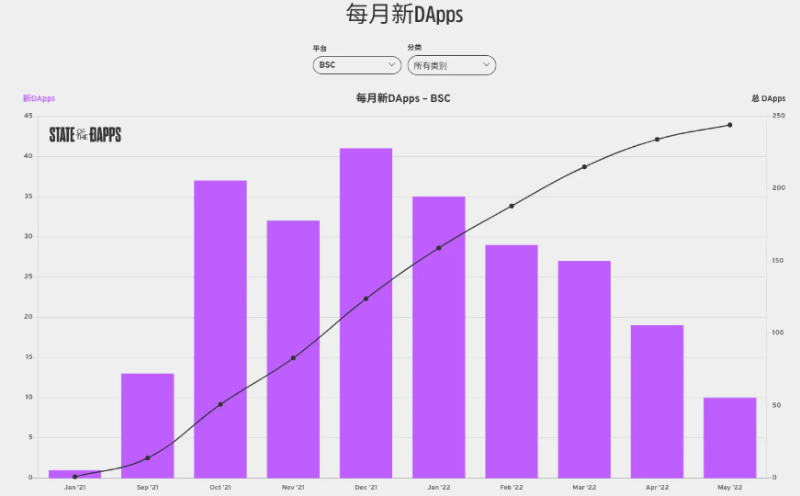
BNB Chain’s strengths lie in its vast user base and strong support from Binance in funding, technology, and human resources. Its weaknesses include high network centralization and heavy dependence on Ethereum’s developer community.
4.3 Solana
Solana’s mainnet beta launched in March 2020. To date, nearly 2,700 projects operate on Solana, spanning eight major categories—DeFi, wallets, NFTs, infrastructure, decentralized gaming—and fifteen subcategories including stablecoins, DEXs, and derivatives.
Solana has developed a relatively complete NFT ecosystem foundation, including project tools and marketplaces. Magic Eden is a Solana-based NFT marketplace. Choosing Solana’s non-EVM architecture during early development reflected confidence in its high-performance advantages, with a strategic focus on the gaming vertical. Today, it accounts for over 97% of Solana’s entire NFT trading volume. Notably, Opensea previously supported only Ethereum but began supporting Solana in April this year; however, the vast majority of trades for its flagship project Okay Bears still occur on Magic Eden.
Due to relatively low network fee revenue, unless dApp activity and usage increase or fees rise, Solana may struggle to sustain a cash-flow-based valuation model. Like BNB Chain, Solana’s network is highly centralized. As user scale expands, ongoing instability in the Solana network has become evident, including multiple outages and halted block production. From last year to this year, Solana suffered repeated extended outages. Amid recurring incidents, doubts have grown about whether Solana’s innovative mechanisms truly solve the “impossible trinity,” or merely prioritize “efficiency” at the expense of “security.”
5. Conclusion
Blockchain tokens have demonstrated explosive upside potential along with strong resilience, making them a crucial segment in asset allocation. From this bull market’s blockchain rotation, despite Ethereum’s first-mover advantage, the competitive landscape remains unsettled. Whether through ecosystem incentives, better connectivity to Ethereum, or introducing breakout applications, blockchains can quickly capture market share. Blockchains that prematurely priced in expectations before official launch or ecosystem breakout performed relatively poorly, indicating that blockchain growth is fundamentally demand-driven.
This bull market saw blockchains benefit from the explosion of DeFi and NFT applications and Ethereum’s capacity constraints—those offering performance and financial support for new applications grew rapidly. This logic may shift slightly in the next cycle, as market consolidation means durable, high-quality applications that survive bull and bear markets will dominate, benefiting their underlying blockchains accordingly.
Authors and References
Lisa Yao@SnapFiners DAO, Aoao@SnapFingers DAO, LiHui@LUCIDA, George@LUCIDA, ZnQ_626@LUCIDA
Cross-Comparison of 6 Blockchains from 6 Perspectives, 2021 Blockchain Sector Review, 2021–2022 Blockchain Trends Report, 2020–2021 Report, Electric Capital 2021 Developer Report
About LUCIDA
LUCIDA is a crypto-focused quantitative hedge fund headquartered in the Cayman Islands. It entered the crypto market in April 2018, focusing on secondary market investments, primarily employing strategies such as CTA, statistical arbitrage, and options and other derivatives. It also provides asset management services to high-net-worth clients and periodically publishes in-depth research reports.
About SnapFingers DAO
SnapFingers DAO is an organization dedicated to researching frontier blockchain sectors, aiming to attract researchers and community contributors from diverse fields through incentive models, forming an influence loop from research to dissemination, ultimately realizing the vision of snapping fingers in the blockchain world.
Join TechFlow official community to stay tuned
Telegram:https://t.me/TechFlowDaily
X (Twitter):https://x.com/TechFlowPost
X (Twitter) EN:https://x.com/BlockFlow_News