Consumer confidence has hit bottom, and macroeconomic correlations have simultaneously collapsed—how much longer can the U.S. stock market’s solo rally last?
TechFlow Selected TechFlow Selected
Consumer confidence has hit bottom, and macroeconomic correlations have simultaneously collapsed—how much longer can the U.S. stock market’s solo rally last?
The S&P 500 continues to hit new highs, driven by AI and semiconductors.
 Navigating Web3 tides with focused insights
By: Li Jia
Source: WallStreetCN
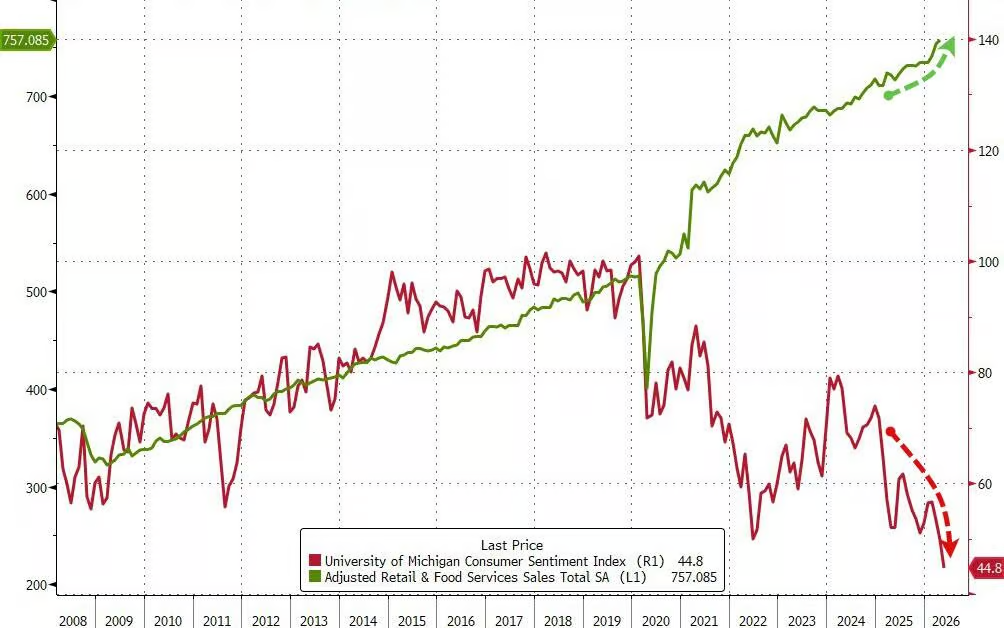
U.S. equities are currently exhibiting a rare divergence: on one hand, consumer confidence has slumped to a historic low and macro asset correlations have completely broken down; on the other, major indices continue hitting new all-time highs, propelled by AI- and semiconductor-related rallies. What truly concerns the market is no longer whether the rally can persist—but how long this highly concentrated AI-driven rally can withstand shocks from oil prices, interest rates, and overcrowded positions.
Buoyed by rising expectations of U.S.-Iran negotiations and a surge in the semiconductor sector, U.S. equities hit another record high on Tuesday. The Nasdaq-100 Index broke above 30,000 for the first time, while the S&P 500 rose approximately 0.5%. Meanwhile, falling oil prices pushed U.S. Treasury yields lower, and a stronger dollar weighed on gold and Bitcoin.
Semiconductors remain the core driver of this rally. Following UBS’s significant upward revision of Micron Technology’s price target, trading sentiment around memory chips surged rapidly—the semiconductor sector has gained roughly 14% over the past five days. Notably, NVIDIA has begun underperforming the broader semiconductor index, indicating capital rotation from mega-cap leaders toward higher-beta names within the sector.
Nelson Armbrust, a Goldman Sachs trader, warns that correlations between the S&P 500 and key macro assets—including interest rates, gold, the VIX, and oil prices—have all deviated sharply from their 20-year historical averages and entered extreme territory. “One side of the market will eventually have to give,” he says. “The U.S. equity indices do not fully reflect the underlying reality of the market.”
AI Remains the Core Narrative—but Drivers Are Rotating
The strongest current driver in the equity market is semiconductors—particularly memory chips. Pete Callahan, a Goldman Sachs trader, notes that the semiconductor index has outperformed NVIDIA by approximately 16.5 percentage points over the past five trading days—the largest five-day outperformance of the SOX index versus NVIDIA since 2018.
Notably, this rally is not being driven broadly by large-cap tech stocks. Overall performance among mega-cap tech names remains relatively weak, and NVIDIA has slightly lagged—indicating capital is rotating from AI leaders into more leveraged semiconductor sub-sectors. Memory-chip-related names surged at the open: the DRAM ETF recorded a single-day nominal trading volume of roughly $3 billion, and Goldman’s Meme-Stocks basket also posted strong gains.
AI remains the dominant market narrative. AI semiconductors, agentic AI, and AI data center stocks led the gains. Goldman notes that the day’s momentum factor strength was almost entirely driven by long-side activity—and the top-performing stocks over the past 12 months continued to significantly outperform.
Meanwhile, options markets are beginning to show increasingly extreme structural signals. SpotGamma data shows aggressive negative delta flows in 0-DTE options—primarily driven by short call selling—while the combination of “rising volatility alongside rising spot prices” persists. This suggests the current rally is not a typical low-volatility risk-on expansion but is instead increasingly driven by positioning squeezes and options market structure.
Consumer Confidence Hits Bottom—but Behavior and Sentiment Diverge
Chris Hussey, a Goldman Sachs trader, points out that many are asking: Why are U.S. equity indices repeatedly hitting new highs even as consumer confidence metrics slump to historic lows? His explanation is that what consumers “feel” differs markedly from what they actually “do”—in other words, sentiment may be pessimistic, but consumption behavior has not deteriorated in tandem.
Fiscal stimulus continues supporting household cash flow. Hussey notes that tax relief provisions from last July’s budget bill are improving household balance sheets and partially offsetting pressure from rising gasoline prices.
U.S. macro data also shows clear divergence: the Chicago Fed National Activity Index rebounded sharply; the Conference Board’s Consumer Confidence Index came in above expectations; and the Dallas Fed Manufacturing Index held up solidly. In contrast, the S&P CoreLogic Case-Shiller Home Price Index weakened, and the Philadelphia Fed Manufacturing Index missed expectations. Overall, U.S. economic data remains “modestly better than expected.”
This explains the current market paradox: extremely low consumer sentiment coexists with no clear deterioration in hard economic data or actual consumption behavior. However, the AAII Bull-Bear Spread remains negative—suggesting investor sentiment has not genuinely turned optimistic despite record-high equity indices.
Macro Correlations Break Down, Negative Gamma Intensifies: Goldman Warns of Structural Fractures in U.S. Equities
Nelson Armbrust, a Goldman Sachs trader, warns again that U.S. equity indices do not fully reflect the underlying reality of the market. Correlations between the S&P 500 and major macro assets have broadly diverged from long-term averages: its correlation with interest rates stands at a 10-year low; its correlation with gold has risen to a 10-year high; its correlation with the VIX has reached a two-year high; and its correlation with oil prices has fallen to a 10-year low.
All of these levels are exceptionally rare across a 20-year historical horizon. In other words, although U.S. equities continue rising, their traditional linkages with interest rates, volatility, commodities, and safe-haven assets are breaking down. For investors relying on historical correlations for asset allocation, hedging, and risk budgeting, this signals declining model stability.
At the same time, gamma has turned negative. Under negative gamma conditions, markets become more sensitive to price moves—and the ongoing state of “rising spot prices alongside rising volatility” confirms this is not a typical low-volatility, one-way bull market, but rather one increasingly driven by positioning and options structure.
Goldman’s HF Trend Monitor shows hedge funds’ current allocation to the momentum factor has risen to the 90th percentile; semiconductor exposure has hit a record 10%; and software exposure has dropped to its lowest level since 2019. Such crowded positioning implies the rally may continue upward in the near term on chasing momentum, but any reversal could trigger sharper corrections.
How Far Can U.S. Equities Go? Three Constraints Will Decide
The first constraint stems from oil prices. Diplomatic progress can quickly compress geopolitical risk premiums—but it cannot instantly restore buffer capacity in shipping, insurance, refining, or real-world supply chains. So long as uncertainty persists around the Strait of Hormuz and prospects for a U.S.-Iran ceasefire, oil prices may oscillate repeatedly between optimistic expectations and tail-risk scenarios.
The second constraint comes from semiconductor positioning. The current U.S. equity rally is becoming increasingly reliant on AI and semiconductors—especially memory chips and momentum-long strategies. If capital continues flowing into this direction, indices may sustain strength—but the more crowded the positioning becomes, the more sensitive the market grows to earnings, guidance, or funding-flow shifts. Even minor disappointments could be rapidly amplified.
The third constraint lies in the breakdown of correlations. Simultaneous deviations of the S&P 500’s correlations with interest rates, gold, the VIX, and oil prices from their long-term averages mean this rally does not signal broad-based macro risk alleviation. More precisely, it reflects the combined effect of declining geopolitical risk premiums, falling U.S. Treasury yields, AI-semiconductor momentum, and positioning squeezes.
Thus, U.S. equities’ “solo celebration” may continue—but its stability is eroding. The critical question is no longer whether indices can reach new highs, but which variables will force a repricing of this trade logic: Will oil prices rebound? Will interest rates rise again? Will semiconductor momentum fade? And when will those distorted correlations reassert themselves?
Join TechFlow official community to stay tuned
Telegram:https://t.me/TechFlowDaily
X (Twitter):https://x.com/TechFlowPost
X (Twitter) EN:https://x.com/BlockFlow_News