

U.S. Small-Cap Stock Index Hits All-Time High—An Overlooked Crypto Cycle Signal?
TechFlow Selected TechFlow Selected
U.S. Small-Cap Stock Index Hits All-Time High—An Overlooked Crypto Cycle Signal?
The Russell 2000 hitting a new high indicates that the market is willing to allocate money into higher-risk assets.
By TechFlow
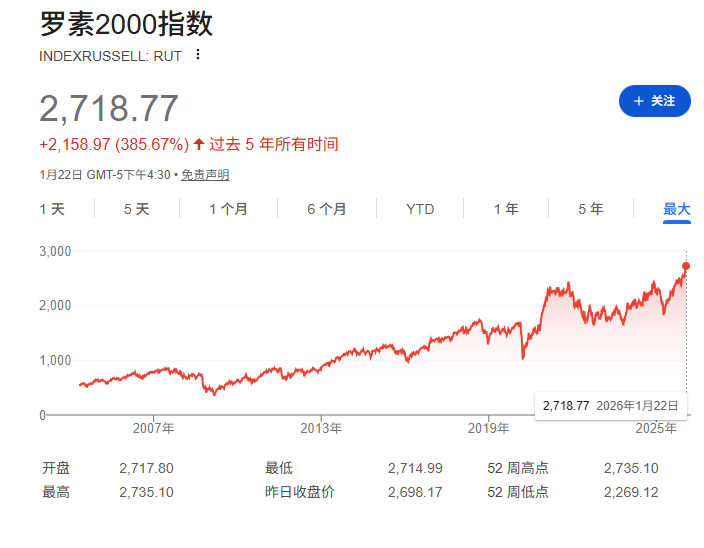
In the first three weeks of 2026, the Russell 2000 Index rose 9%, breaking above 2,700.
This U.S. small-cap index had traded sideways for three years after peaking at the end of 2021. It only broke above that prior high in November last year—and has now entered a “price discovery” phase, with no historical resistance levels left to reference.
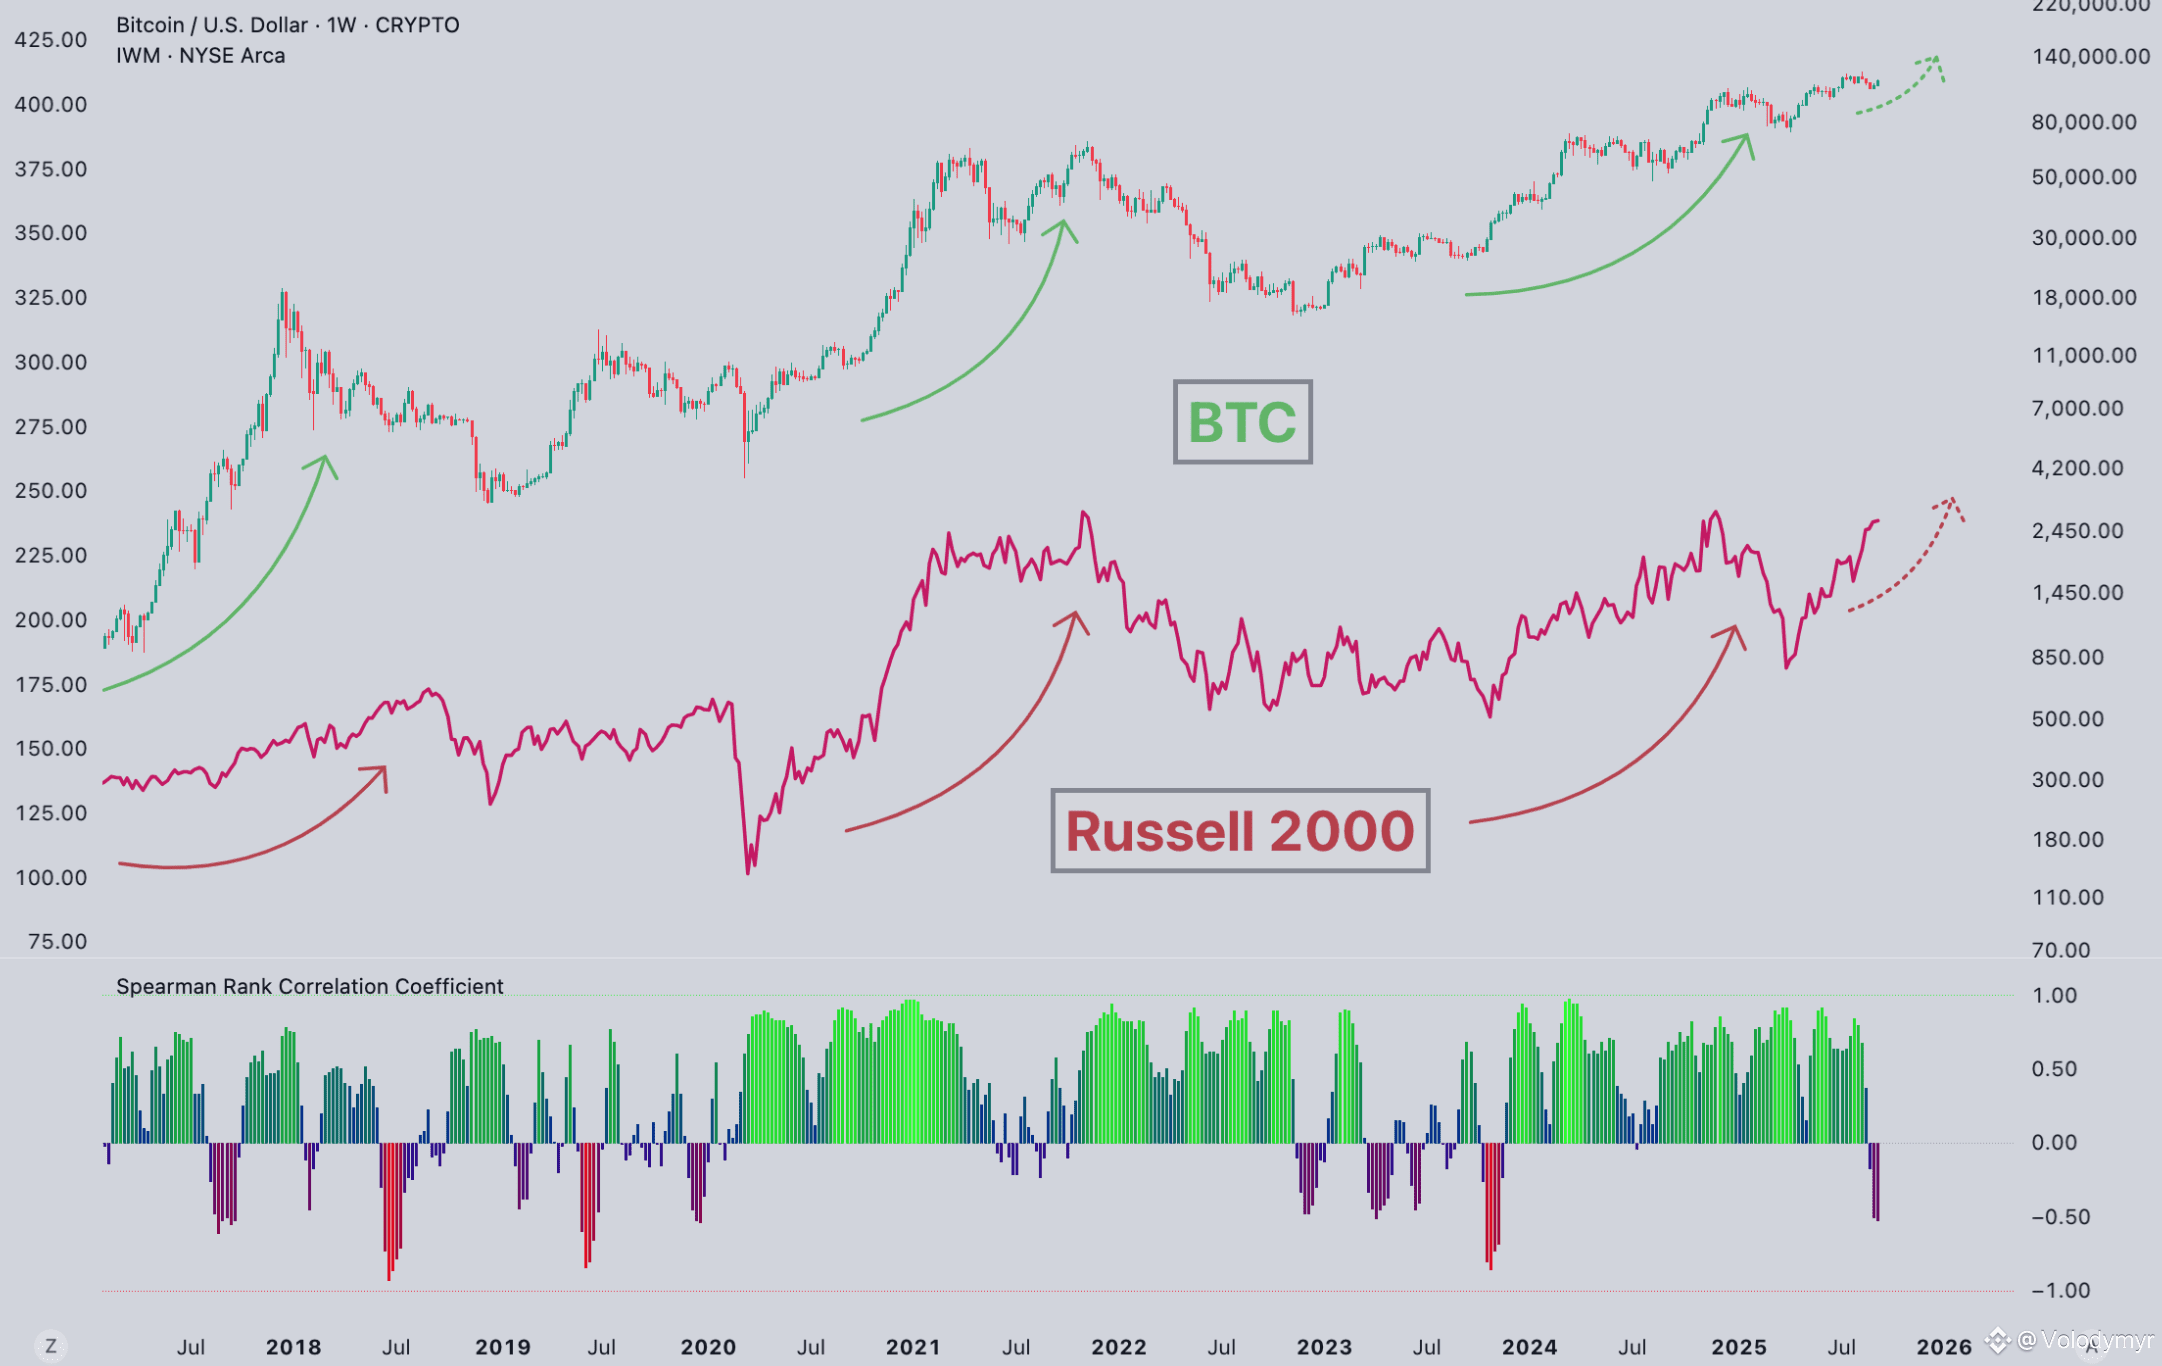
Recently, I came across a view suggesting that when the Russell 2000 broke out in 2016 and again in 2020, Bitcoin (BTC) also launched bull markets—both times perfectly aligned. Now that it’s broken out again, could crypto follow suit?
A quick data check shows this does resemble a leading indicator—at least historically, it has held true.
The Russell 2000 tracks the 2,000 smallest publicly traded U.S. companies by market capitalization, with a median market cap just over $1 billion. Unlike mega-cap S&P 500 names like Apple and Microsoft, these smaller firms share one key trait: they rely primarily on bank loans—not bond issuance—for financing.
When interest rates rise, their funding costs feel the pressure first; when rates fall, they benefit earliest.
That’s why traders often treat the Russell 2000 as a “risk sentiment thermometer. When it hits new highs, it signals that investors are willing to allocate capital toward higher-risk assets.
There’s another layer to this logic. Small-cap businesses are heavily U.S.-focused—unlike Apple or Microsoft, which operate globally. So the Russell 2000’s performance reflects, to some extent, the “felt temperature” of the domestic U.S. economy.
In 2016 and 2020, the small-cap index broke out twice—and BTC took off both times
First, the data.

In 2016, the Fed’s hiking cycle was nearing its end, and Trump’s election raised expectations of corporate tax cuts—boosting risk appetite. BTC had just undergone its halving, so supply contraction coincided with rising demand, fueling the 2017 mania.
The 2020 breakout was even more dramatic. The pandemic created a massive market dislocation, prompting the Fed to unleash full-scale quantitative easing and push rates to rock-bottom levels. Institutions entered crypto en masse for the first time—MicroStrategy and Tesla began large-scale BTC purchases—and price surged from ~$10,000 to $69,000.
The timing of both Russell 2000 breakouts and BTC bull runs indeed lined up closely.
Yet there are only two historical instances.
Looking back to November 2024, the Russell 2000 first breached its 2021 pre-high—but BTC was already trading near $100,000.
Since the April 2024 halving, BTC has risen from $63,000 to roughly $90,000—a ~50% gain. That sounds solid—yet it pales next to the ~5x and ~27x gains seen during the same post-halving periods in the prior two cycles.
Possible explanations:
First, institutional participation has dampened volatility. After spot Bitcoin ETFs were approved in January 2024, heavyweights like BlackRock and Fidelity entered the market—ETFs alone absorbed hundreds of billions of dollars. Institutional capital doesn’t chase momentum like retail; it smooths out volatility. The upside? Drawdowns are less severe. The downside? You won’t see vertical rallies like in 2017.
Second, the marginal impact of halvings is diminishing. Following the fourth halving, BTC’s annual inflation rate dropped from 1.7% to 0.85%. Though that’s a 50% cut, 94% of all BTC has already been mined. Newly minted supply exerts ever-diminishing dilutive pressure on the existing stock—meaning each halving delivers a weaker “supply shock” than the last.
Third, BTC had already broken its prior all-time high in March 2024—before the halving. This was unprecedented. ETF anticipation front-loaded demand, meaning much of the bullish catalyst was already priced in by the time the halving actually occurred.
Coincidence—or driven by the same liquidity logic?
How can the Russell 2000—a U.S. small-cap equity index—and BTC—an asset class rooted in cryptography—move in tandem?
My interpretation is that both respond sensitively to the same macro signals.
When the Fed signals monetary easing, capital flows outward along the risk curve: first into Treasuries, then blue-chip equities, then small caps—and finally into high-beta assets like crypto.
A Russell 2000 breakout essentially lights a green light mid-chain.
A JPMorgan study last year found BTC correlates most strongly with small-cap tech stocks within the Russell 2000. Why? Because crypto projects depend heavily on VC funding, and blockchain innovation is concentrated among startups—not large tech incumbents. Put simply, investors buying small-cap stocks and those buying crypto share similar risk appetites.
Still, I hesitate to treat this as causal. With only two data points, statistical significance is lacking.
Moreover, BTC’s own halving cycle was a major driver in both 2016 and 2020—the Russell 2000 breakout may have merely been a concurrent macro signal, not a leading one.
Another intriguing observation: while the Russell 2000 is rising, money is flowing out.
In 2025, the Russell 2000 gained over 40%—yet U.S. small-cap ETFs saw nearly $20 billion in net outflows for the year. That stands in stark contrast to past bull markets, where rising indices typically attracted inflows.
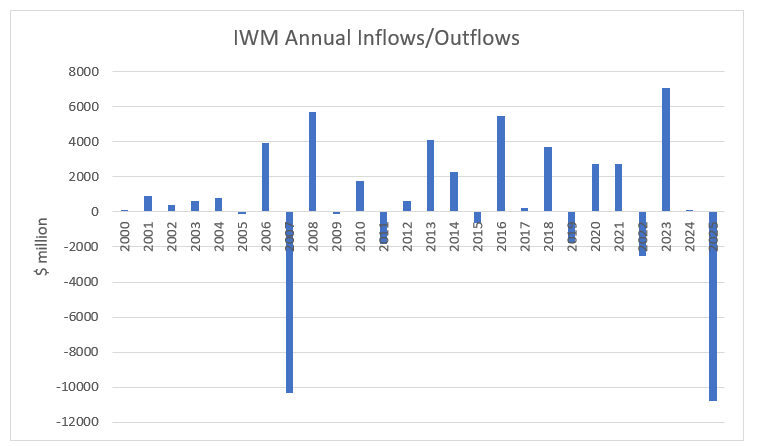
(Source: etf.com)
Another data point: roughly 40% of Russell 2000 companies reported negative earnings in Q3 2025—approaching a historical high. That figure has more than doubled since 2007.
So we have an index hitting new highs amid deteriorating fundamentals—and capital exiting. How to explain it? One possibility is that a handful of stocks are driving the index higher; another is passive fund rebalancing. Either way, the narrative of “returning risk appetite” loses credibility.
Lately, if you’ve been following macro or broader finance content, you’ll notice increasing chatter among investment-focused video creators and crypto Twitter users about the Russell 2000 breakout as a “leading indicator” for BTC rallies.
Yes—the Russell 2000 breakout did precede the 2016 and 2020 crypto bull markets, and it’s happening again. As an observational window, it holds value. But my view is clear: don’t treat it as a trading signal.
Two data points cannot establish causality—and this cycle differs from prior ones in several key ways: ETFs have reshaped capital structure, institutions have suppressed volatility, and halving effects are waning. Past scripts won’t replay verbatim.
Whether the “resonance” between the Russell 2000 and BTC will hold up may only become clear once this cycle concludes.
Note:
Data sources: Yahoo Finance, TradingEconomics, JPMorgan Research, BeInCrypto. As of January 2026.
Join TechFlow official community to stay tuned
Telegram:https://t.me/TechFlowDaily
X (Twitter):https://x.com/TechFlowPost
X (Twitter) EN:https://x.com/BlockFlow_News


