

ARK's 2026 Outlook: An Upgraded "Reaganomics," a Continued Golden Age for U.S. Stocks, and a Strong Dollar Suppressing Gold
TechFlow Selected TechFlow Selected
ARK's 2026 Outlook: An Upgraded "Reaganomics," a Continued Golden Age for U.S. Stocks, and a Strong Dollar Suppressing Gold
Cathie Wood predicts that the U.S. will enter an "enhanced Reaganomics" era over the next three years, driven by a technological revolution that boosts productivity, keeps inflation under control, strengthens the dollar, and enables positive stock market returns despite high valuations.
ARK Invest founder Cathie Wood ("Cathie") released a macro outlook in her latest 2026 New Year Letter to Investors, likening the next three years to "Reaganomics on steroids."
She指出 that with deregulation, tax cuts, sound monetary policy, and the convergence of transformative technologies, the U.S. stock market is poised for another "golden era," while an impending surge in the dollar could bring gold's rally to an end.
Specifically, Cathie Wood believes that despite sustained real GDP growth over the past three years, the underlying U.S. economy has experienced a rolling recession and is now in a "coiled spring" state, primed for a strong rebound in the coming years.
She emphasized that with David Sacks appointed as the first AI and crypto "czar" to lead deregulation efforts, and corporate effective tax rates moving toward 10%, U.S. economic growth will gain substantial policy tailwinds.
On the macro front, Wood forecasts that productivity-driven prosperity will further contain inflation—even potentially turning it negative.
She expects nominal U.S. GDP growth to remain in the 6% to 8% range over the next few years, driven primarily by productivity gains rather than inflation.
In terms of market impact, Wood predicts the relative advantage in U.S. investment returns will drive a significant appreciation in the dollar, echoing the near-doubling of the dollar seen in the 1980s.
She warns that although gold prices have surged in recent years, a stronger dollar will weigh on gold, whereas Bitcoin—due to its fixed supply mechanism and low asset correlation—will follow a divergent path from gold.
Regarding investor concerns about market valuations, Wood does not believe an AI bubble has formed.
She notes that while current price-to-earnings (P/E) ratios are at historical highs, explosive earnings growth driven by AI, robotics, and other technologies will absorb these elevated valuations. Markets may deliver positive returns even as P/E multiples compress—a trajectory similar to the bull market of the late 1990s.
Below is the full text of the investor letter:
Happy New Year to ARK’s investors and supporters! We deeply appreciate your continued trust and partnership.
As I outline in this letter, we truly believe there are compelling reasons for optimism. We hope you find our insights valuable. From the perspective of economic history, we are at a pivotal moment.
The Coiled Spring
Although U.S. real GDP has grown steadily over the past three years, the underlying structure of the economy has undergone a rolling recession—one that has compressed the economy like a tightly wound spring, setting the stage for a powerful rebound in the years ahead.
In response to pandemic-related supply shocks, the Federal Reserve raised the federal funds rate from 0.25% in March 2022 to 5.5% by July 2023—an unprecedented 22-fold increase over 16 months.
This aggressive tightening pushed housing, manufacturing, non-AI capital expenditures, and lower- to middle-income households into recession, as illustrated below.
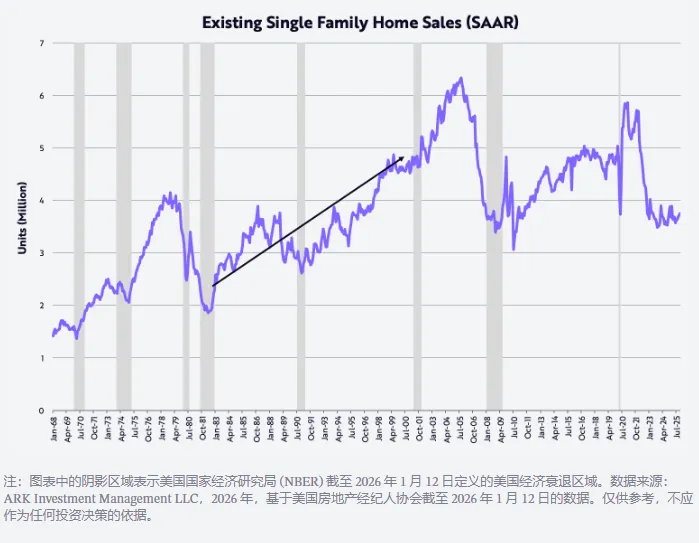
Measured by existing home sales, the housing market declined 40% from a seasonally adjusted annual rate of 5.9 million units in January 2021 to 3.5 million units in October 2023.
That level last occurred in November 2010, and over the past two years, sales have hovered around that depressed figure.
This highlights how tightly the spring is coiled: today’s existing home sales level matches that of the early 1980s, despite the U.S. population now being approximately 35% larger.
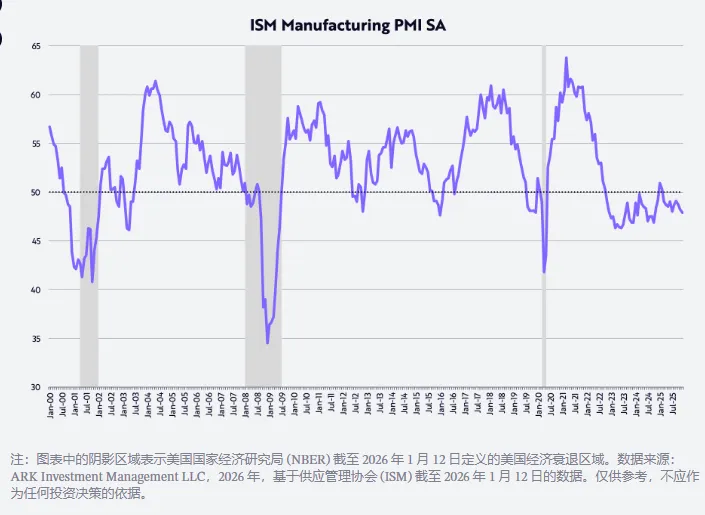
Manufacturing, as measured by the U.S. Purchasing Managers’ Index (PMI), has been in contraction for nearly three consecutive years. As shown in the chart below, 50 is the threshold between expansion and contraction for this diffusion index.
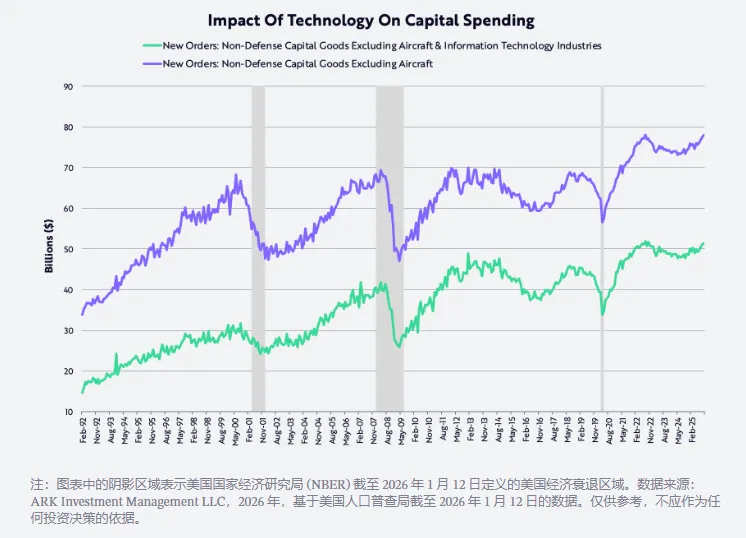
Meanwhile, non-defense capital goods spending (excluding aircraft) peaked in mid-2022 and has since recovered to that level regardless of technological influence.
In fact, this capital expenditure metric struggled for over two decades after the dot-com bust before breaking out again in 2021, when pandemic-related supply disruptions accelerated both digital and physical investments.
What was once a spending ceiling now appears to be a new floor, as AI, robotics, energy storage, blockchain technology, and multi-omics sequencing platforms are poised to enter their golden age.
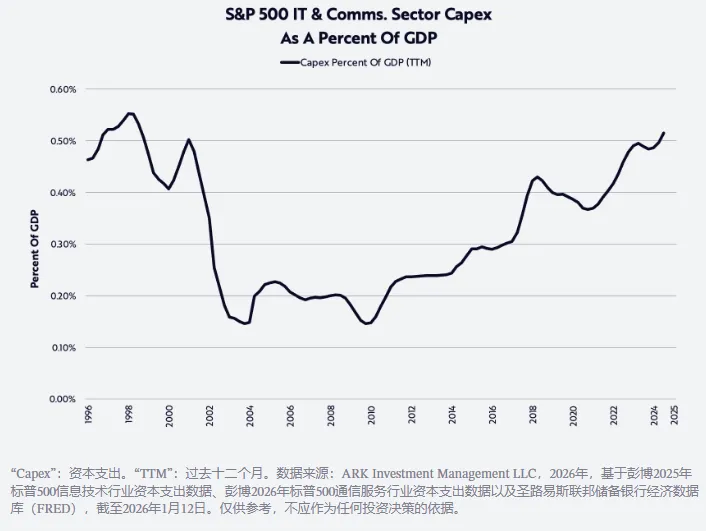
After the tech and telecom bubble of the 1990s, peak spending of around $70 billion persisted for 20 years. Today, as shown below, we may be witnessing the strongest capital expenditure cycle in history. In our view, an AI bubble remains far off!
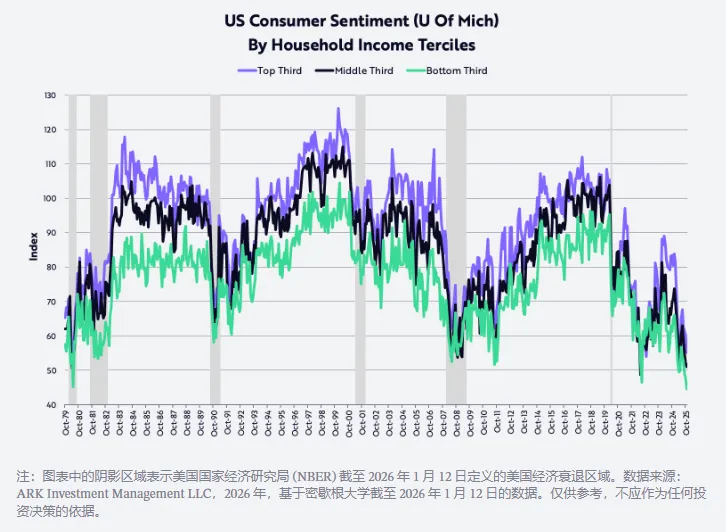
At the same time, data from the University of Michigan shows consumer confidence among lower- and middle-income households has fallen to its lowest level since the early 1980s.
Back then, double-digit inflation and high interest rates severely eroded purchasing power and plunged the U.S. economy into back-to-back recessions.
Moreover, as shown below, confidence among higher-income households has also declined in recent months. In our view, consumer sentiment represents one of the most compressed—and highest-potential—"springs" ready to rebound.
Deregulation, Alongside Lower Taxes, Inflation, and Interest Rates
Thanks to a confluence of forces—including deregulation, tax reductions (including tariffs), declining inflation, and falling interest rates—the rolling recession the U.S. has endured over the past few years could reverse rapidly and dramatically in the coming year and beyond.
Deregulation is unleashing innovation across sectors, led in AI and digital assets by the newly appointed “AI and Crypto Czar,” David Sacks.
Meanwhile, reductions in tipping taxes, overtime taxes, and Social Security taxes will deliver significant rebates to U.S. consumers this quarter, potentially boosting the annualized growth rate of real disposable income from around 2% in the second half of 2025 to approximately 8.3% this quarter.
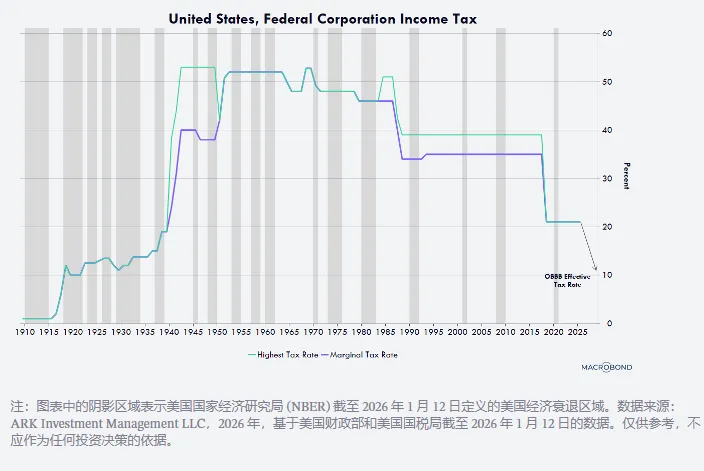
Additionally, accelerated depreciation for manufacturing facilities, equipment, software, and domestic R&D expenses will push corporate effective tax rates down toward 10% (as shown below)—among the lowest globally.
For example, any company breaking ground on a manufacturing plant in the U.S. before the end of 2028 can fully depreciate the building in its first year of operation, instead of spreading depreciation over 30 to 40 years as previously required.
Equipment, software, and domestic R&D spending can likewise be 100% depreciated in the first year. This cash-flow-friendly policy was permanently enshrined in last year’s budget and made retroactive to January 1, 2025.
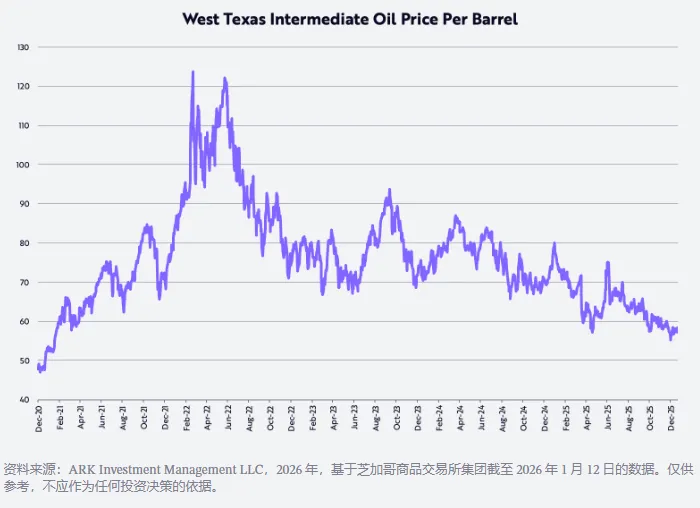
Over the past few years, inflation as measured by CPI has stubbornly hovered in the 2% to 3% range. But in the years ahead, due to several factors illustrated below, inflation is likely to fall to unexpectedly low levels—or even turn negative.
First, West Texas Intermediate (WTI) crude oil prices have dropped approximately 53% from their post-pandemic peak of ~$124/barrel on March 8, 2022, and are currently down ~22% year-over-year.
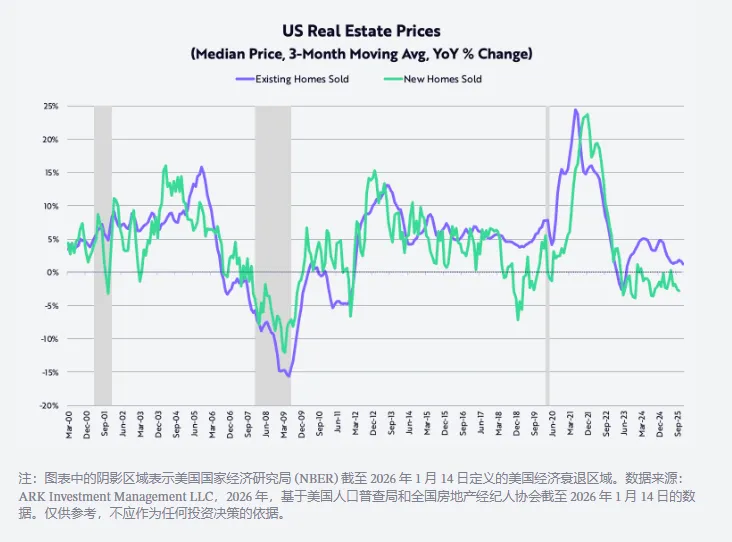
Since peaking in October 2022, the selling prices of newly constructed single-family homes have declined by about 15%. Meanwhile, price inflation for existing single-family homes—based on a three-month moving average—has fallen from a post-pandemic high of ~24% year-over-year in June 2021 to ~1.3%, as shown below.
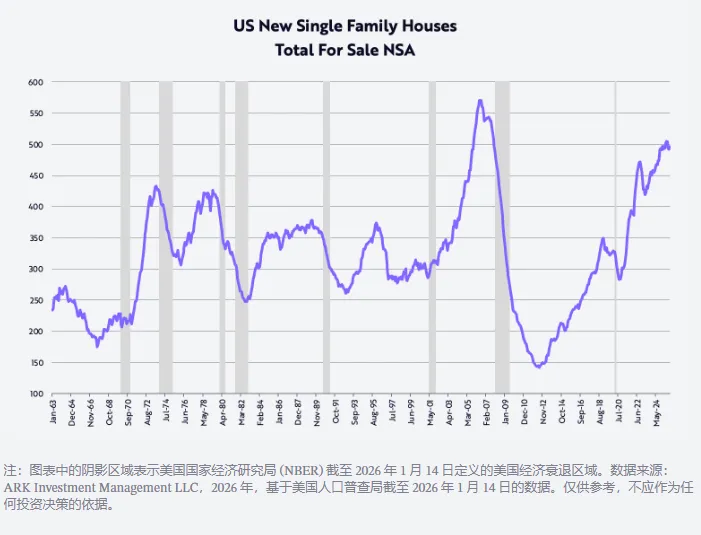
In Q4, to clear a near-500,000-unit inventory of newly built single-family homes (shown below—the highest level since October 2007, just before the global financial crisis), the three largest homebuilders slashed prices: Lennar -10%, KB Homes -7%, and DR Horton -3% year-over-year.
These price declines will feed into the Consumer Price Index (CPI) with a lag over the next several years.
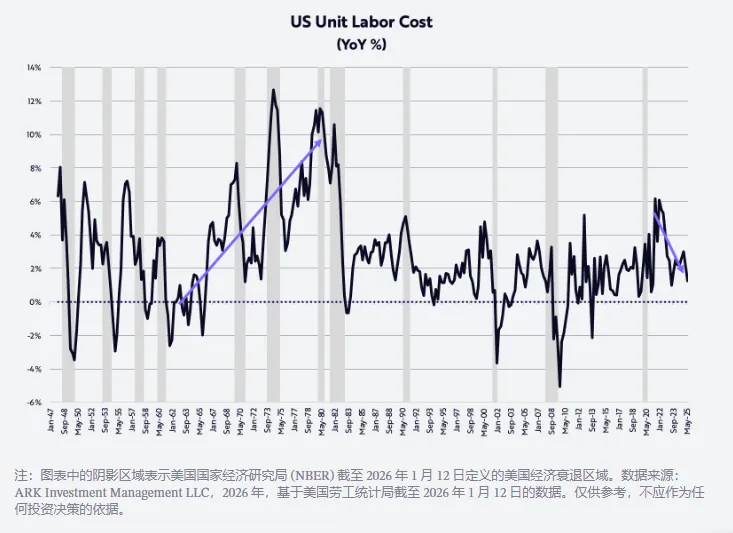
Finally, one of the most powerful anti-inflationary forces—non-farm productivity—has risen against the backdrop of economic stagnation, growing 1.9% year-over-year in Q3.
Despite a 3.2% rise in hourly compensation, productivity gains have reduced unit labor cost inflation to just 1.2%, as shown below. There is no sign here of the cost-push inflation seen in the 1970s!
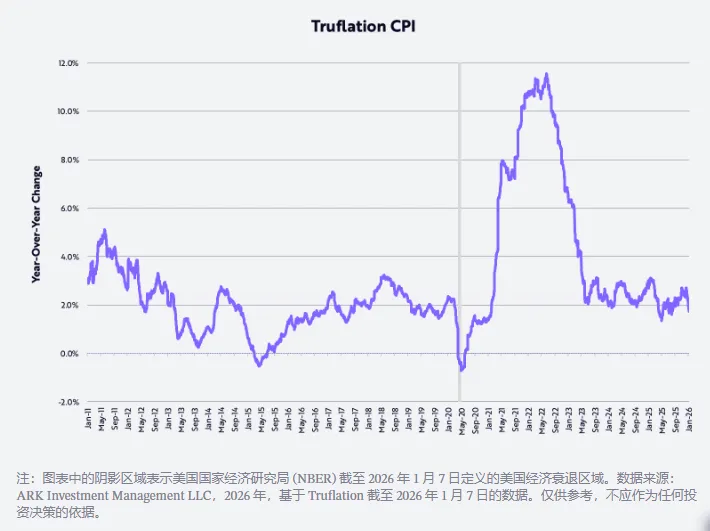
This improvement is further validated: Truflation’s inflation measure recently fell to a 1.7% year-over-year decline, as shown below—nearly 100 basis points (bps) lower than the BLS CPI-based inflation rate.
Productivity Boom
Indeed, if our research on technology-driven disruptive innovation holds true, non-farm productivity growth should accelerate to 4–6% annually in the coming years—driven by both cyclical and structural forces—further reducing unit labor cost inflation.
The convergence of key innovation platforms currently unfolding—artificial intelligence, robotics, energy storage, public blockchain technologies, and multi-omics—is not only poised to push productivity growth to sustainable new highs but also to generate immense wealth.
Rising productivity may also help correct significant geo-economic imbalances in the global economy.
Firms can direct the benefits of higher productivity toward one or more of four strategic goals: expanding margins, increasing R&D and other investments, raising wages, and/or lowering prices.
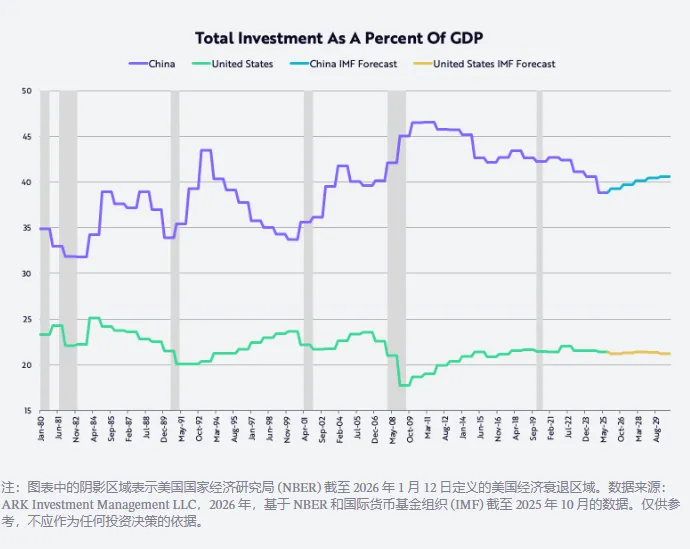
In China, raising wages for higher-productivity workers and/or improving margins could help the economy overcome its structural overinvestment problem.
Since joining the WTO in 2001, China’s investment as a share of GDP has averaged around 40%—nearly double that of the U.S., as shown below. Higher wages would shift China’s economy toward consumption and away from commoditization.
However, in the short term, technology-driven productivity gains may continue to slow U.S. job growth, pushing the unemployment rate from 4.4% to above 5.0%, prompting the Fed to keep cutting rates.
Subsequently, deregulation and fiscal stimulus should amplify the effects of low interest rates and accelerate GDP growth in the second half of 2026.
Meanwhile, inflation is likely to continue slowing—not only due to lower oil prices, housing prices, and tariffs, but also thanks to technological advances that boost productivity and reduce unit labor costs.
Remarkably, AI training costs are falling 75% per year, while AI inference costs (the cost of running AI application models) are dropping as much as 99% annually (according to some benchmarks).
Such unprecedented declines in technology costs should drive explosive growth in their usage.
Therefore, we expect U.S. nominal GDP growth to remain in the 6% to 8% range over the next few years—driven by 5% to 7% productivity growth, 1% labor force growth, and inflation ranging from -2% to +1%.
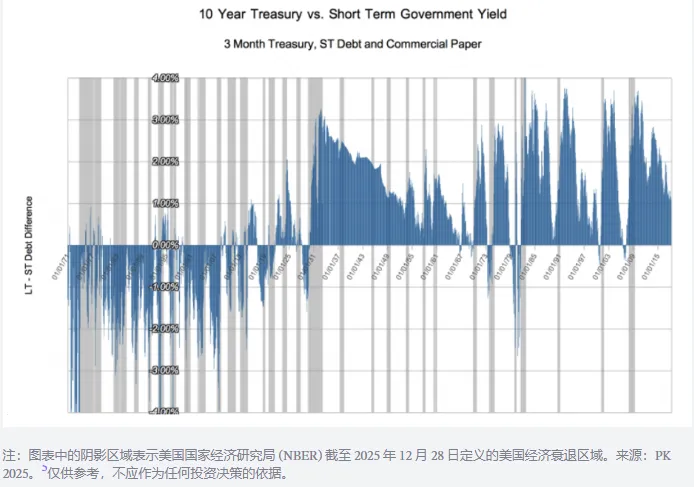
The deflationary effects of AI and the other four innovation platforms will accumulate over time, shaping an economic environment reminiscent of the 50-year period leading up to 1929—the last great technological revolution sparked by the internal combustion engine, electricity, and the telephone.
During that era, short-term interest rates moved in tandem with nominal GDP growth, while long-term rates responded to the deflationary undercurrents accompanying technological booms, resulting in a yield curve that averaged about 100 bps inverted, as shown below.
Other New Year Reflections
Gold Rises, Bitcoin Falls
In 2025, gold prices rose 65%, while Bitcoin prices fell 6%.
Many observers attribute the surge in gold prices—from $1,600/oz in October 2022 to $4,300/oz (a 166% gain) since the end of the U.S. stock market bear market—to inflation risk.
Yet another explanation is that global wealth growth (as evidenced by a 93% rise in the MSCI World Equity Index) has outpaced global gold supply growth of ~1.8% per year.
In other words, incremental demand for gold may have exceeded supply growth. Interestingly, Bitcoin rose 360% over the same period, despite its supply growing at only ~1.3% annually.
Notably, gold and Bitcoin miners may respond very differently to these price signals: gold miners can increase output, while Bitcoin cannot.
Mathematically, Bitcoin supply will grow ~0.82% annually over the next two years, then slow to ~0.41% per year thereafter.
A Long-Term View of Gold Prices
Measured by market value relative to M2 money supply, gold prices have surpassed their previous historical peak only once in the past 125 years—during the early 1930s Great Depression, when gold was fixed at $20.67/oz and M2 collapsed by ~30% (as shown below).
Recently, the gold-to-M2 ratio has exceeded even that level, which was last seen in 1980 amid double-digit inflation and interest rates. In other words, from a historical perspective, gold prices are now at extreme highs.
The chart also shows that the long-term decline in this ratio correlates closely with robust equity market returns. According to Ibbotson and Sinquefield, stocks have delivered a compound annual return of ~10% since 1926.
Following the two major long-term peaks in this ratio—in 1934 and 1980—stock prices, as measured by the DJIA, delivered 670% and 1015% returns over the subsequent 35 and 21 years (ending in 1969 and 2001), representing annualized returns of 6% and 12%, respectively.
Notably, small-cap stocks delivered annualized returns of 12% and 13% over those periods.

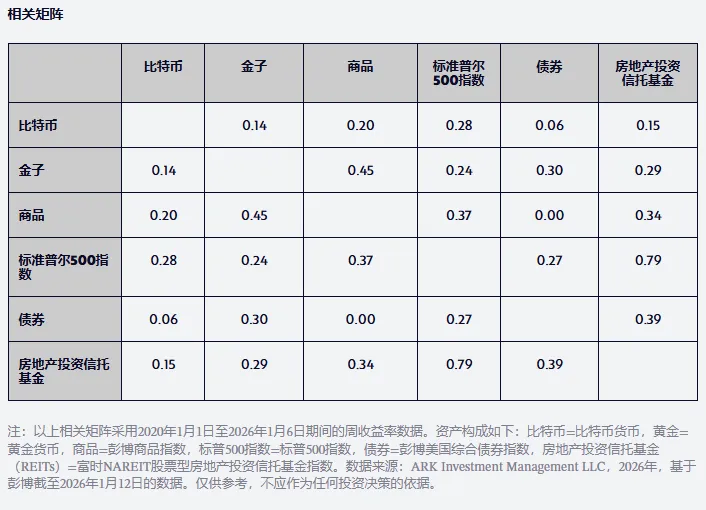
For asset allocators, another key consideration is Bitcoin’s relatively low return correlation with gold and other major asset classes since 2020, as shown in the table below.
Notably, Bitcoin’s correlation with gold is even lower than that between the S&P 500 and bonds. In other words, for investors seeking superior risk-adjusted returns in the years ahead, Bitcoin should be an attractive diversification tool.
Outlook for the Dollar
In recent years, a popular narrative has been the end of American exceptionalism, with the dollar posting its worst first-half drop since 1973 and its largest annual decline since 2017.
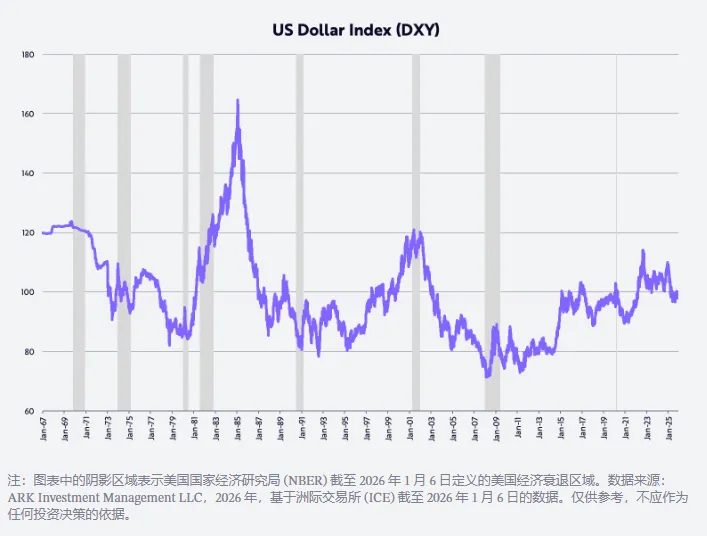
Last year, the trade-weighted dollar index (DXY) fell 11% in the first half and 9% for the full year. If our forecasts on fiscal policy, monetary policy, deregulation, and U.S.-led technological breakthroughs prove accurate, U.S. investment returns will improve relative to the rest of the world, driving the dollar higher.
Policies under the Trump administration mirror those of the early 1980s Reaganomics era, when the dollar nearly doubled, as shown below.
AI Hype
As shown below, the AI boom is driving capital expenditures to their highest levels since the late 1990s.
In 2025, investment in data center systems (including computing, networking, and storage) grew 47% to nearly $500 billion, and is projected to rise another 20% in 2026 to ~$600 billion—far exceeding the pre-ChatGPT decade-long trend of $150–200 billion annually.
Such massive investment naturally raises the question: “Where will the returns come from, and how will they materialize?”
Beyond semiconductors and large listed cloud companies, private AI-native firms are also benefiting from growth and returns on investment.
AI companies are among the fastest-growing in history. Our research shows consumers are adopting AI twice as fast as they adopted the internet in the 1990s, as illustrated below.

By the end of 2025, OpenAI and Anthropic are reportedly on track to generate $20 billion and $9 billion in annualized revenue, up from $1.6 billion and $0.1 billion the prior year—a 12.5x and 90x increase!
There are rumors both companies are considering IPOs within the next one to two years to fund the massive investments needed for their product models.
As Fidji Simo, CEO of OpenAI’s apps division, said: “The capabilities of AI models far exceed what most people experience daily, and 2026 will be the year we close that gap. The leaders in AI will be those who transform frontier research into practical products useful to individuals, businesses, and developers.”
This year, with more human-friendly, intuitive, and integrated user experiences, we expect meaningful progress in this area.
ChatGPT Health is an early example—an embedded section within the ChatGPT platform focused on helping users improve their health using personal health data.
In enterprises, many AI applications remain in early stages, slowed by bureaucracy, inertia, and prerequisites such as restructuring and rebuilding data infrastructure.
By 2026, organizations may realize they must train models on their own data and iterate quickly—or risk being overtaken by more aggressive competitors.
AI-powered use cases should deliver immediate and superior customer service, faster product launches, and enable startups to create more value with fewer resources.
Market Valuations Are Too High
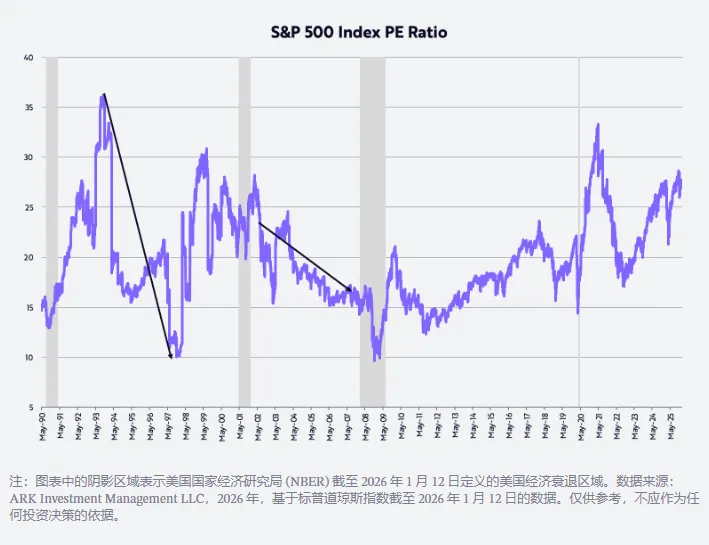
Many investors worry that stock valuations are too high and have reached historical extremes, as shown in the chart below.
Our own valuation assumption is that P/E ratios will revert to the 35-year average of around 20x. Some of the most notable bull markets occurred alongside P/E compression.
For example, from mid-October 1993 to mid-November 1997, the S&P 500 delivered a 21% annualized return while its P/E ratio fell from 36x to 10x.
Likewise, from July 2002 to October 2007, the S&P 500 returned 14% annually while its P/E ratio declined from 21x to 17x. Given our expectations for real GDP growth driven by productivity and moderating inflation, a similar dynamic should unfold in this cycle—and perhaps even more dramatically.
As always, thank you so much to ARK’s investors and supporters. Special thanks to Dan, Will, Katie, and Keith for helping me write this lengthy New Year message!
Cathie
Join TechFlow official community to stay tuned
Telegram:https://t.me/TechFlowDaily
X (Twitter):https://x.com/TechFlowPost
X (Twitter) EN:https://x.com/BlockFlow_News


