Opinion: Bitcoin bear market may have completed 90%
TechFlow Selected TechFlow Selected
Opinion: Bitcoin bear market may have completed 90%
The bear market may end earlier than expected.
Author: Matt Crosby
Translation: AididiaoJP, Foresight News
The end of the Bitcoin bear market may come earlier than expected, as the gold ratio has broken below the 350-day moving average and reached a key Fibonacci support level, indicating the current zone is an accumulation area.
Bitcoin has struggled to maintain consistent correlation with gold, recently aligning only during market declines. However, viewing Bitcoin's price through the lens of gold rather than USD provides deeper insight into the current market cycle. By measuring Bitcoin’s real purchasing power against comparable assets like gold, we can identify potential support levels and assess when the bear market might end.
Breaching key support signals official start of Bitcoin bear market
Bitcoin effectively entered bear market territory when it dropped below the 350-day moving average at around $100,000 and the critical six-figure psychological level, followed by an immediate decline of approximately 20%. From a technical analysis perspective, breaking below the "Golden Ratio multiplier" moving average is typically seen as a signal of entering a bear market, but the picture becomes more interesting when priced in gold instead of dollars.
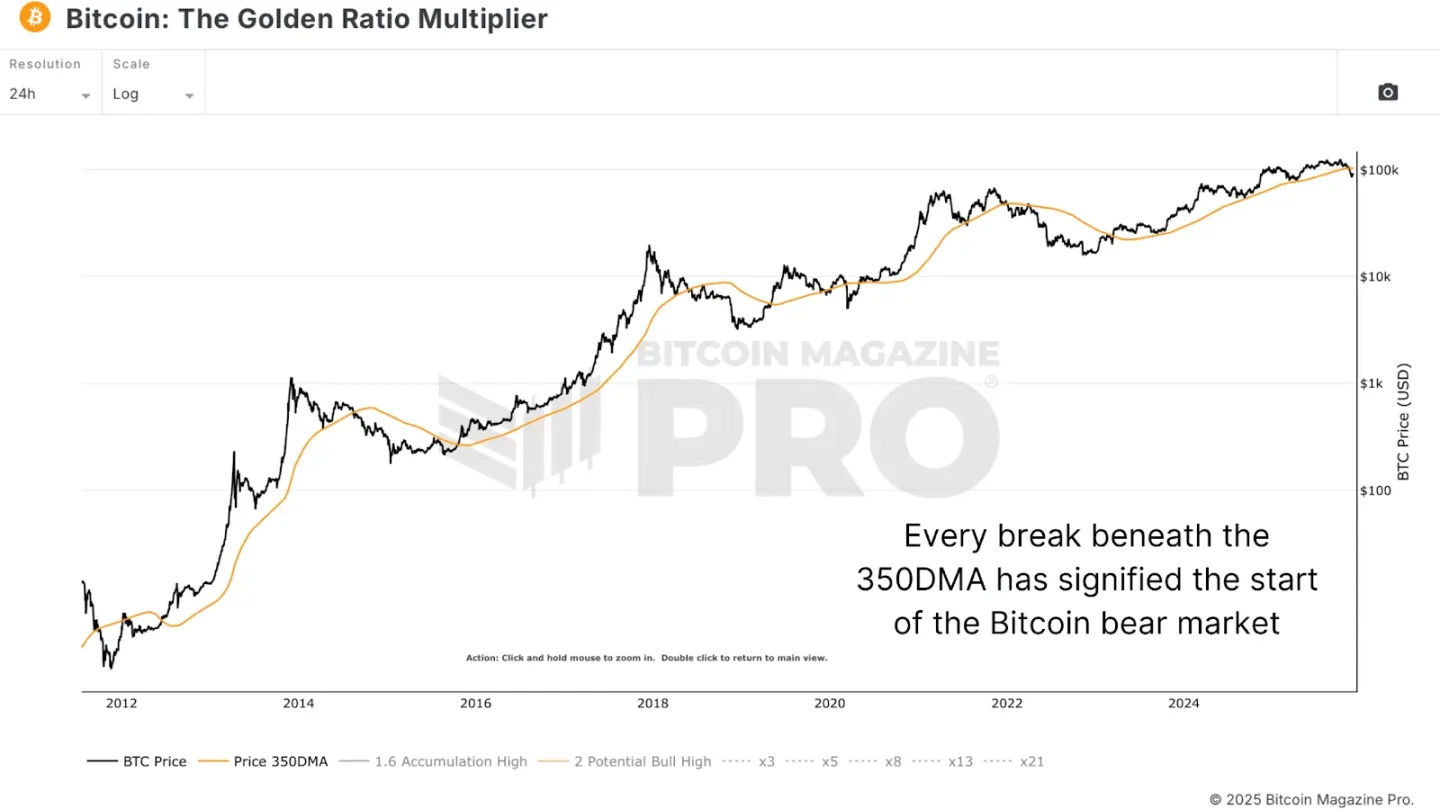
Figure 1: Historically, BTC breaking below the 350-day moving average coincides with the start of bear markets.
Bitcoin’s performance against gold differs significantly from its performance against the dollar. After peaking in December 2024, Bitcoin has declined over 50% in gold terms, while its dollar-denominated peak occurred in October 2025, well below the previous year's high. This divergence suggests Bitcoin may have already entered a bear market earlier—and for longer—than most realize. Reviewing historical bear cycles of Bitcoin priced in gold reveals that the current correction may be approaching a critical support zone.
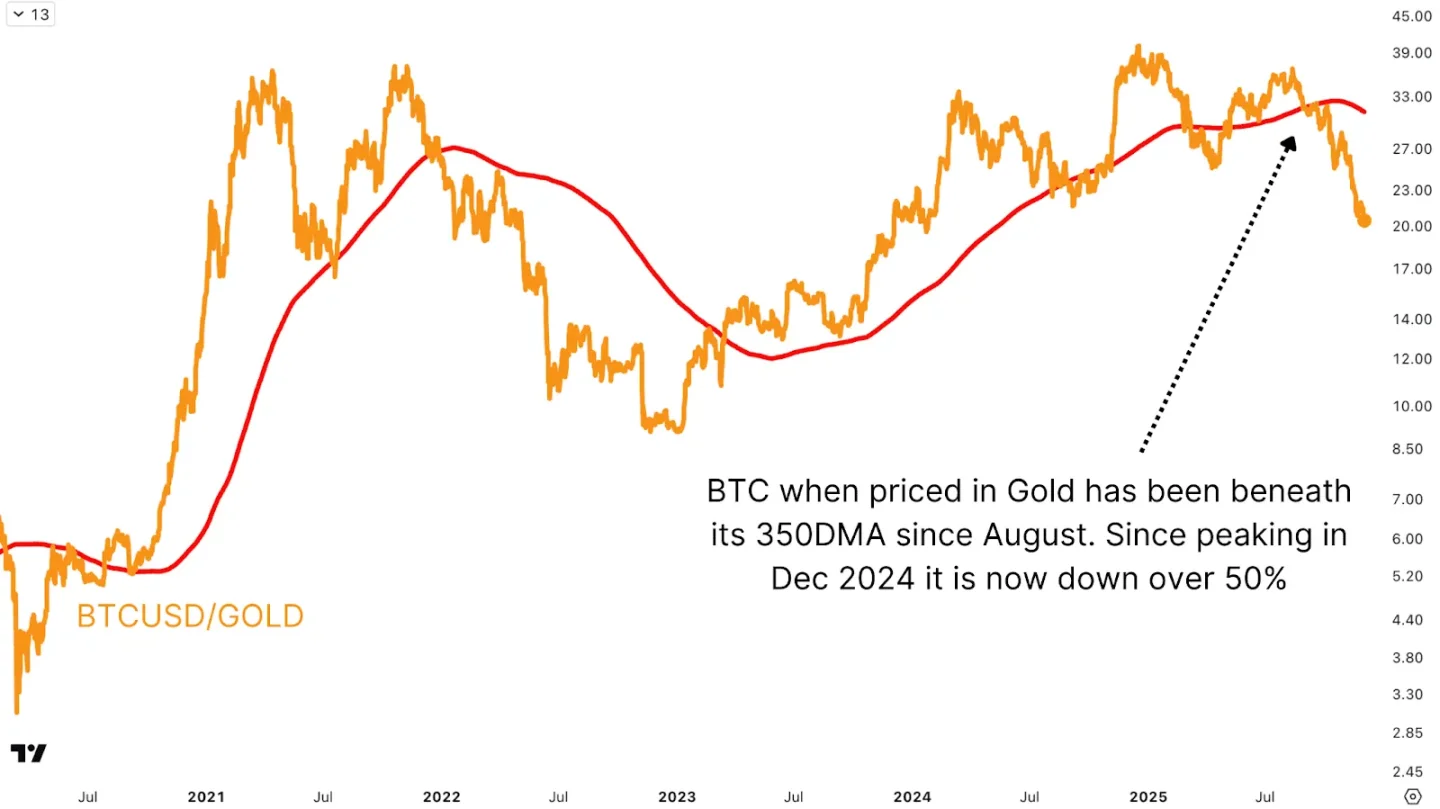
Figure 2: When priced in gold, BTC broke below the 350-day moving average as early as August.
The 2015 bear market bottom formed after an 86% decline lasting 406 days; the 2017 cycle lasted 364 days with an 84% drop; the last bear market fell 76% over 399 days. At the time of this analysis, Bitcoin priced in gold had declined 51% over 350 days. While the percentage跌幅 has gradually decreased due to Bitcoin’s growing market cap and increased capital inflows, this mainly reflects greater institutional participation and reduced supply—not a fundamental change in cycle dynamics.
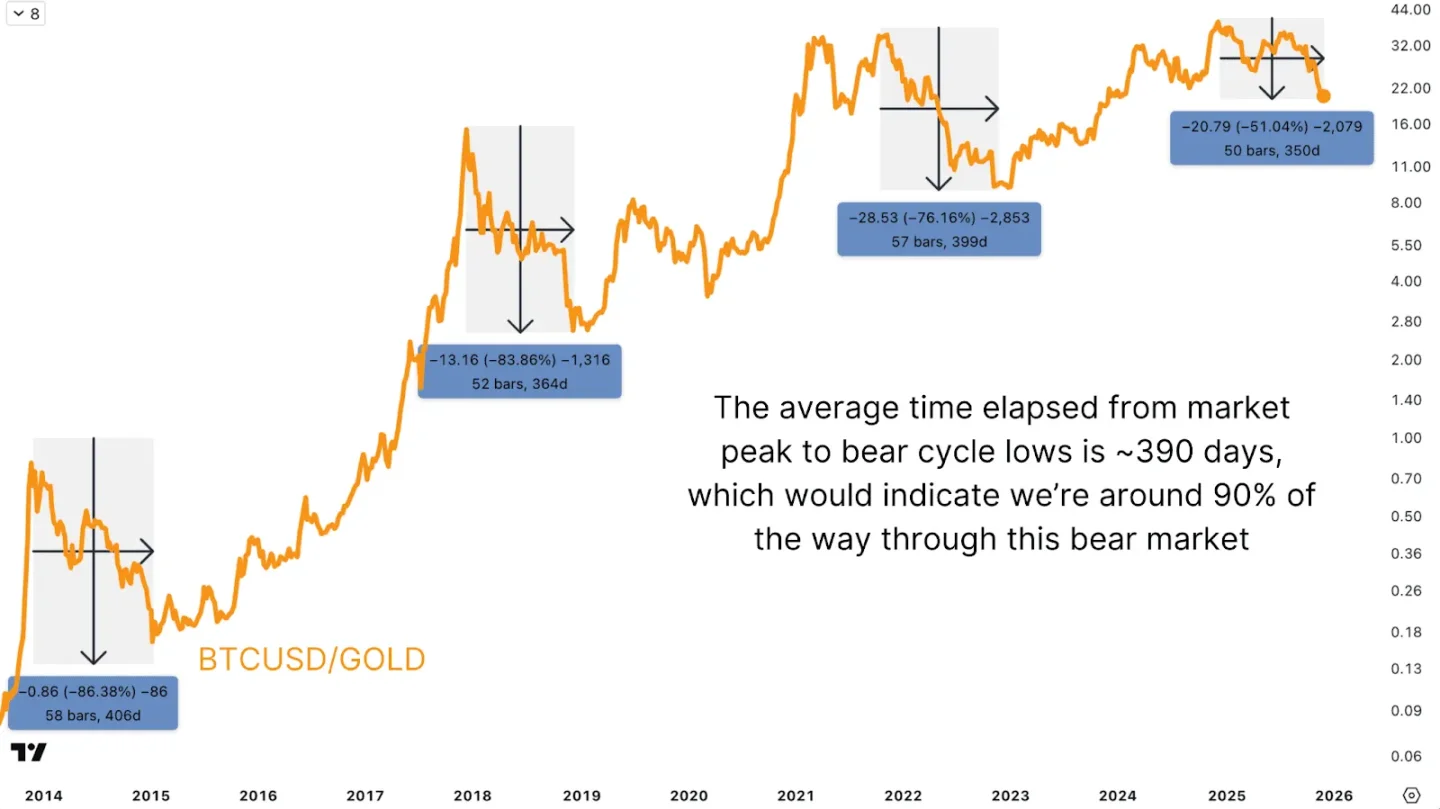
Figure 3: BTC priced in gold suggests this bear market may already be 90% complete.
Multi-cycle indicators suggest Bitcoin bear market bottom is near
In addition to examining drawdowns and duration, Fibonacci retracement levels across multiple cycles offer more precise signals. Applying Fibonacci tools from historical cycle lows to highs reveals clear confluences at specific levels.
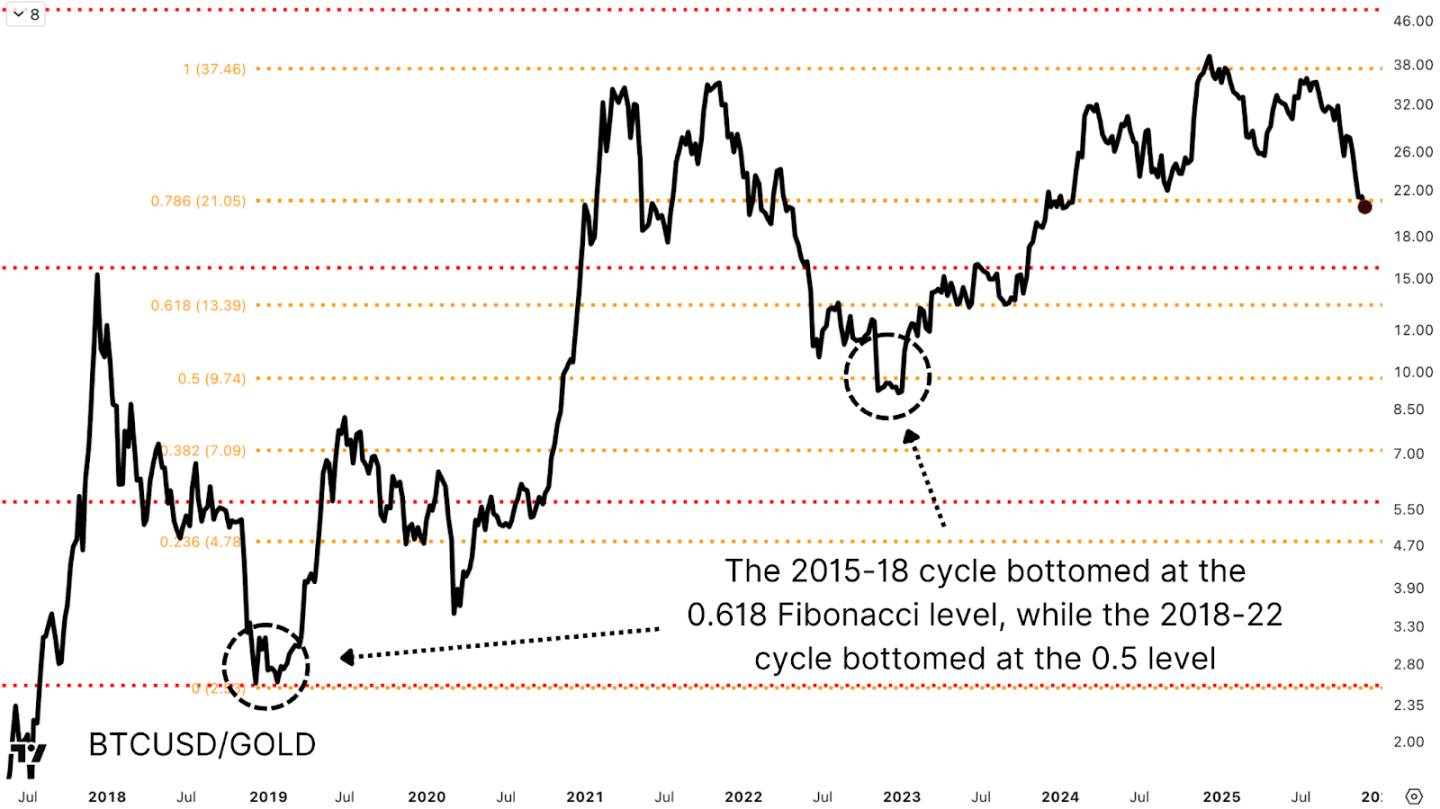
Figure 4: Past bear market bottoms aligned precisely with key Fibonacci retracement levels.
In the 2015–2018 cycle, the bear market bottom appeared at the 0.618 Fibonacci level, equivalent to about 2.56 ounces of gold per Bitcoin; in the 2018–2022 cycle, the bottom landed exactly at the 0.5 level, or about 9.74 ounces of gold per Bitcoin. The latter later became a significant resistance-turned-support level during the subsequent bull run.
Converting the gold ratio into USD price targets
From the previous bear market low to this cycle’s bull market high, the 0.618 Fibonacci level corresponds to about 22.81 ounces of gold per Bitcoin, while the 0.5 level equals 19.07 ounces. The current price sits between these two levels, potentially forming an ideal accumulation zone in terms of purchasing power.
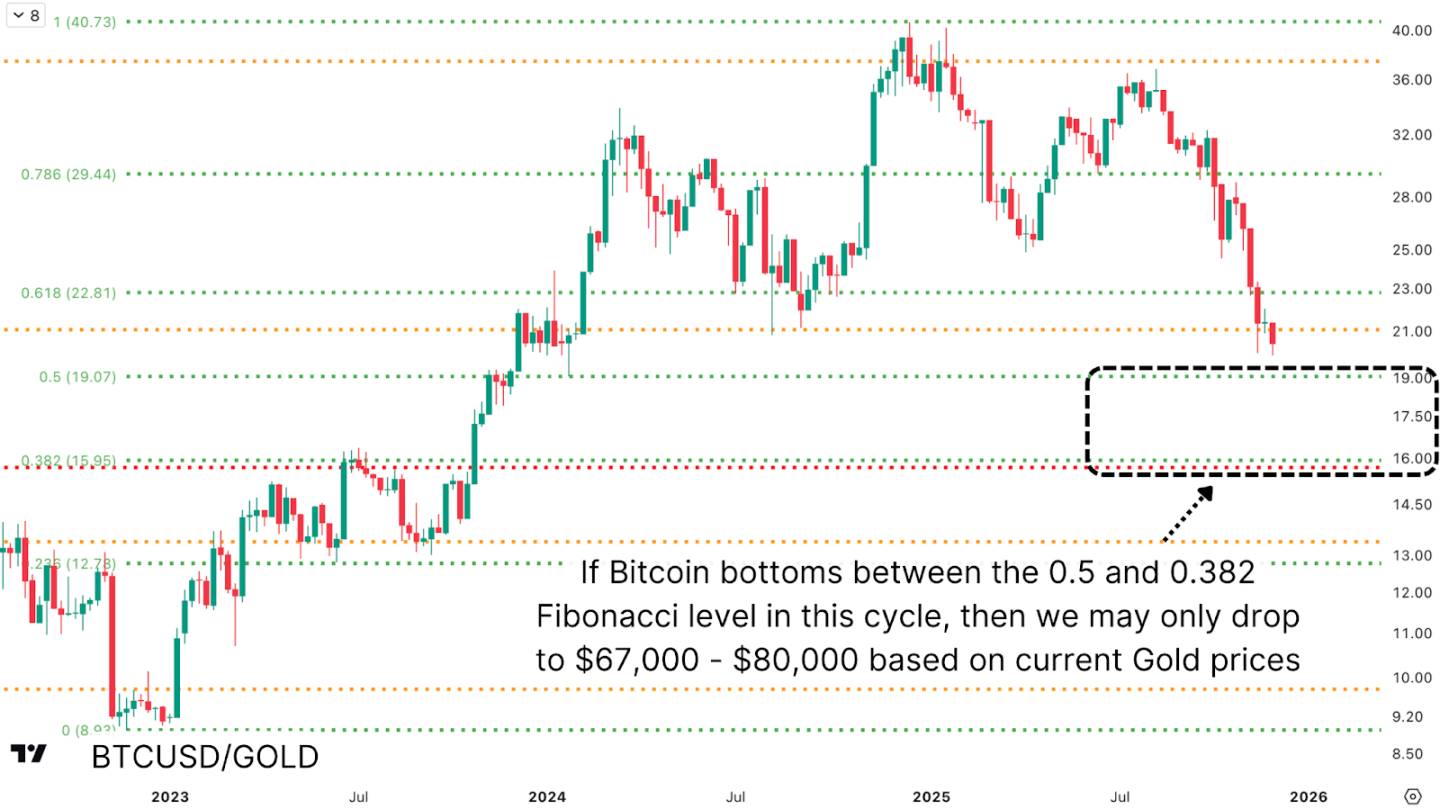
Figure 5: Projecting BTC’s gold-based lows via Fibonacci levels and converting to USD helps estimate potential Bitcoin bottom zones.
Fibonacci levels across different cycles create multiple confluences: the 0.786 level of the current cycle (around 21.05 ounces of gold) translates to approximately $89,160 per Bitcoin; the prior cycle’s 0.618 level points again to the $80,000 range. If further downside occurs, the next key technical target is around $67,000, corresponding to the 0.382 Fibonacci level (about 15.95 ounces of gold per Bitcoin).
Conclusion: Bitcoin bear market may already be 90% complete
Measured against assets like gold, Bitcoin’s purchasing power has been steadily declining since December 2024, meaning the bear market has lasted far longer than suggested by dollar-only analysis. Converting cross-cycle Fibonacci retracement levels into USD reveals strong support in the $67,000–$80,000 range. While the analysis is theoretical and actual price action may not perfectly align, the convergence of data across multiple timeframes and valuation frameworks suggests the bear market could end sooner than the market expects.
Join TechFlow official community to stay tuned
Telegram:https://t.me/TechFlowDaily
X (Twitter):https://x.com/TechFlowPost
X (Twitter) EN:https://x.com/BlockFlow_News