Has Bitcoin's "highest indicator" failed?
TechFlow Selected TechFlow Selected
Has Bitcoin's "highest indicator" failed?
Why many trusted Bitcoin top indicators have failed in this mid-cycle phase, and how new dynamic models can better track the ever-changing market structure of human rights.
Author: Bitcoin Magazine Pro
Translation: Baihua Blockchain

In the recent bull market, many of the most popular Bitcoin top indicators failed to trigger, prompting observers to question whether the underlying data has "broken down." This article analyzes several widely used tools, explores why they underperformed in this cycle, and outlines how to adjust them according to Bitcoin's evolving market structure.
Price Tool Forecasts
On Bitcoin Magazine Pro’s price forecasting tool metrics, the recent bull run never reached several historically reliable top models such as Delta Top, Terminal Price, and Top Cap (which also did not fully activate even in the previous cycle). The Bitcoin investor tool using two moving averages multiplied by 5 was also untested, while the Pi Cycle Top indicator, although closely watched by many traders, failed to deliver accurate timing or price signals. This has led to a reasonable question: have these models stopped working, or has Bitcoin outgrown them?
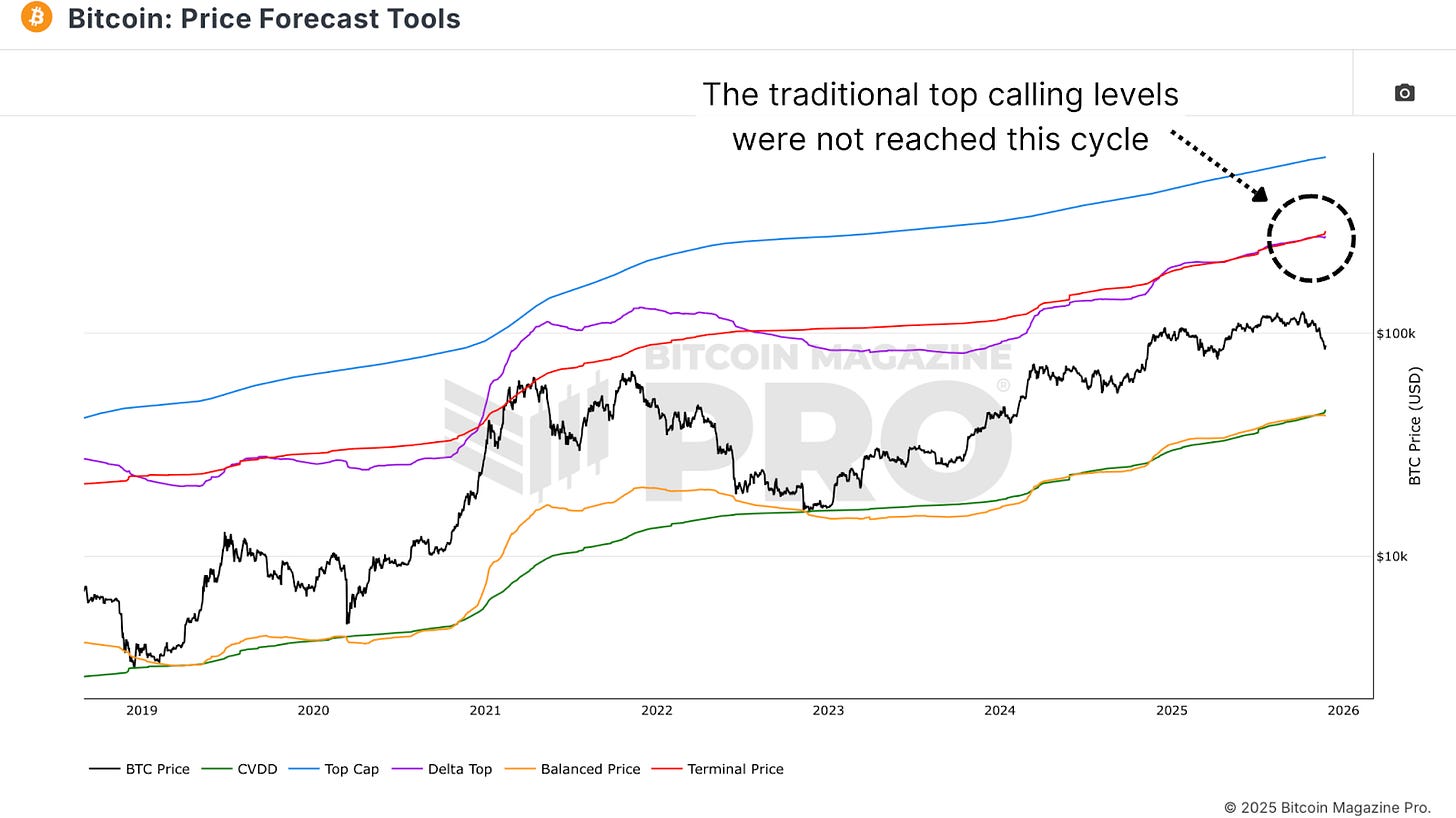 Figure 1: Historically reliable top models such as Top Cap, Delta Top, and Terminal Price were not reached during this bull market cycle.
Bitcoin is an evolving asset, with changing market structure, liquidity, and participant behavior. Rather than assuming the data has broken, it is more appropriate to recalibrate these indicators from different angles and timeframes. The goal is not to abandon these tools, but to make them more robust and responsive to a market that no longer delivers the same exponential upside and clear cycle peaks seen in earlier years.
From Fixed to Dynamic
The 2-year rolling MVRV Z-Score has long been a core tool for identifying overheated markets, but in this cycle, it did not effectively signal the bull market peak. It spiked when Bitcoin first broke through the $73,000–$74,000 range, but failed to provide a clear exit signal for the later rally. Currently, the indicator is showing the most oversold reading on record relative to its baseline.
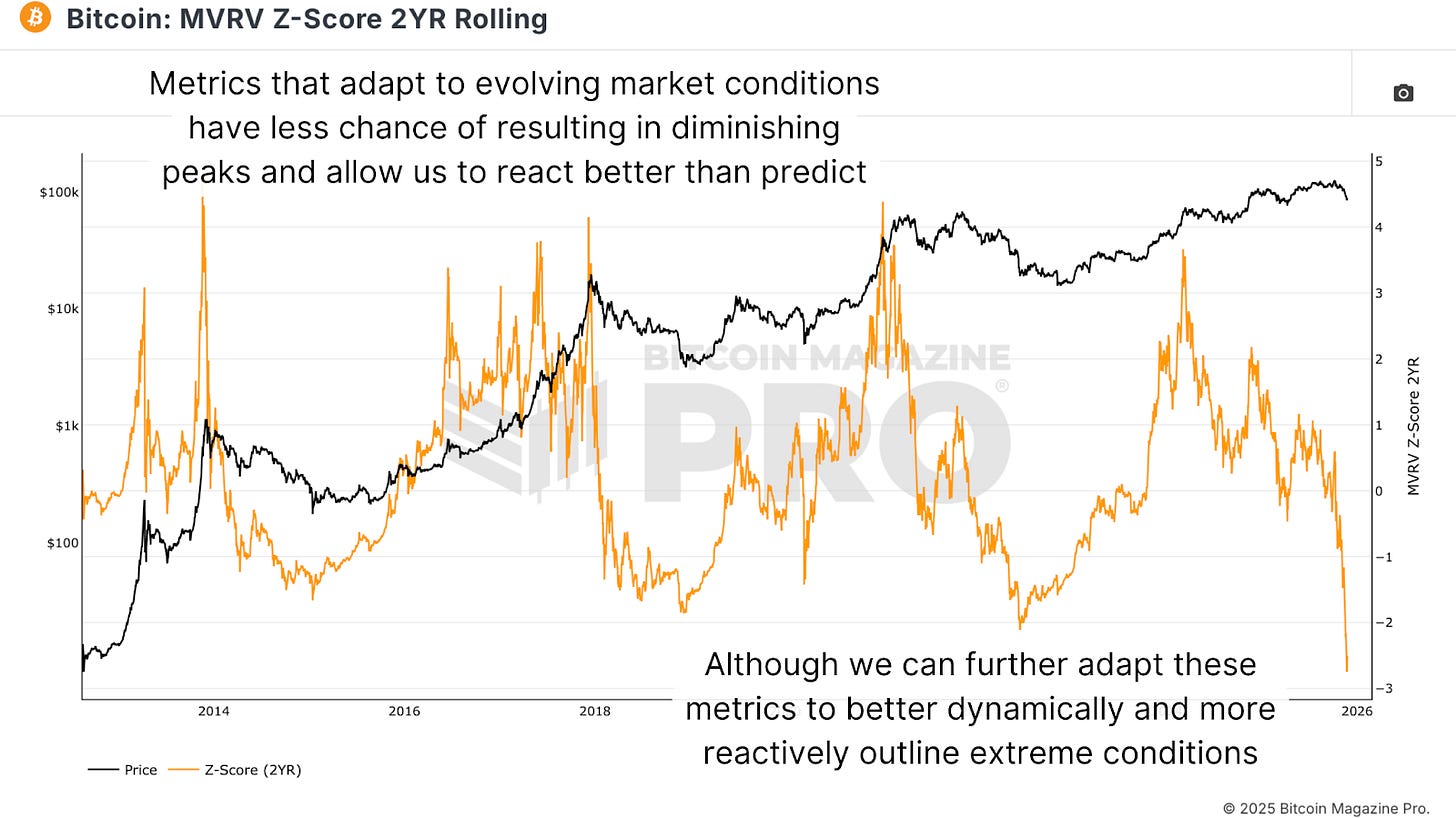 Figure 2: The typically reliable 2-year rolling MVRV Z-Score failed to trigger an exit signal this cycle.
To address this limitation, the MVRV Z-Score can be reformulated on a 6-month rolling basis instead of two years, making it more sensitive to recent conditions while still grounded in realized value dynamics. In addition to shortening the lookback period weekly, replacing fixed thresholds with dynamically based percentile ranges is also helpful. By measuring the proportion of days spent above or below certain Z-Score levels, one can define, for example, the top 5% zone as a potential peak area. In this cycle, when Bitcoin first broke $100,000, the indicator did signal within the upper zone, and historically, entering the top 5% range has correlated well with cycle reversals—even if they don’t capture the absolute peak perfectly.
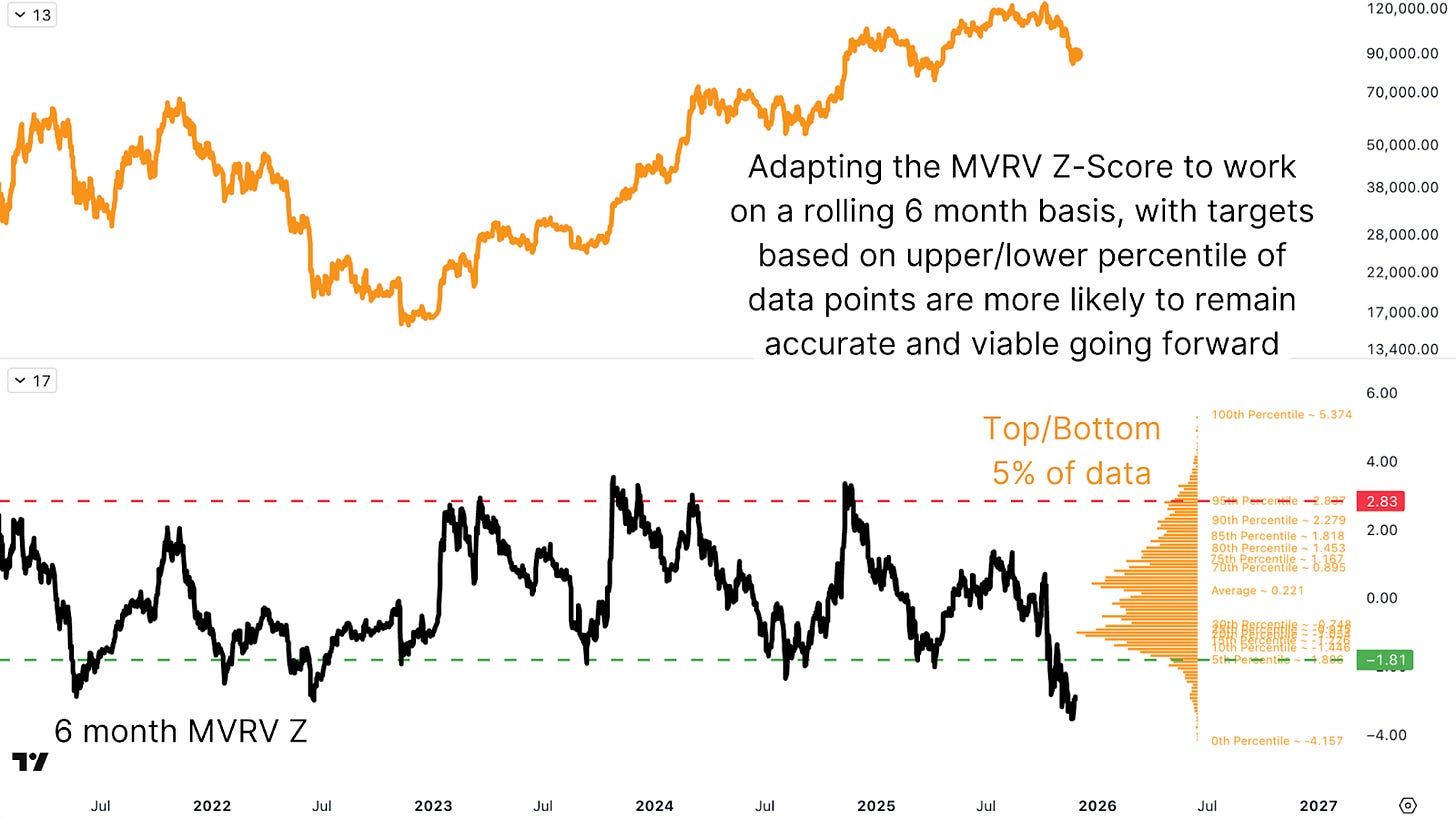
Figure 3: The recalibrated 6-month MVRV Z-Score with targeted percentiles provides more timely buy/sell signals.
Faster Response
Beyond valuation tools, activity-based metrics like Coin Days Destroyed (CDD) can improve their utility by adjusting their lookback periods across cycles. The 90-day moving average of CDD has historically tracked large-scale sell-offs by long-term holders, but given the more cautious momentum and increased volatility in the current cycle, a 30-day moving average often provides more actionable insights. As Bitcoin no longer exhibits the same parabolic rallies, indicators need to react faster to reflect shallower yet still significant profit-taking waves and investor rotation.
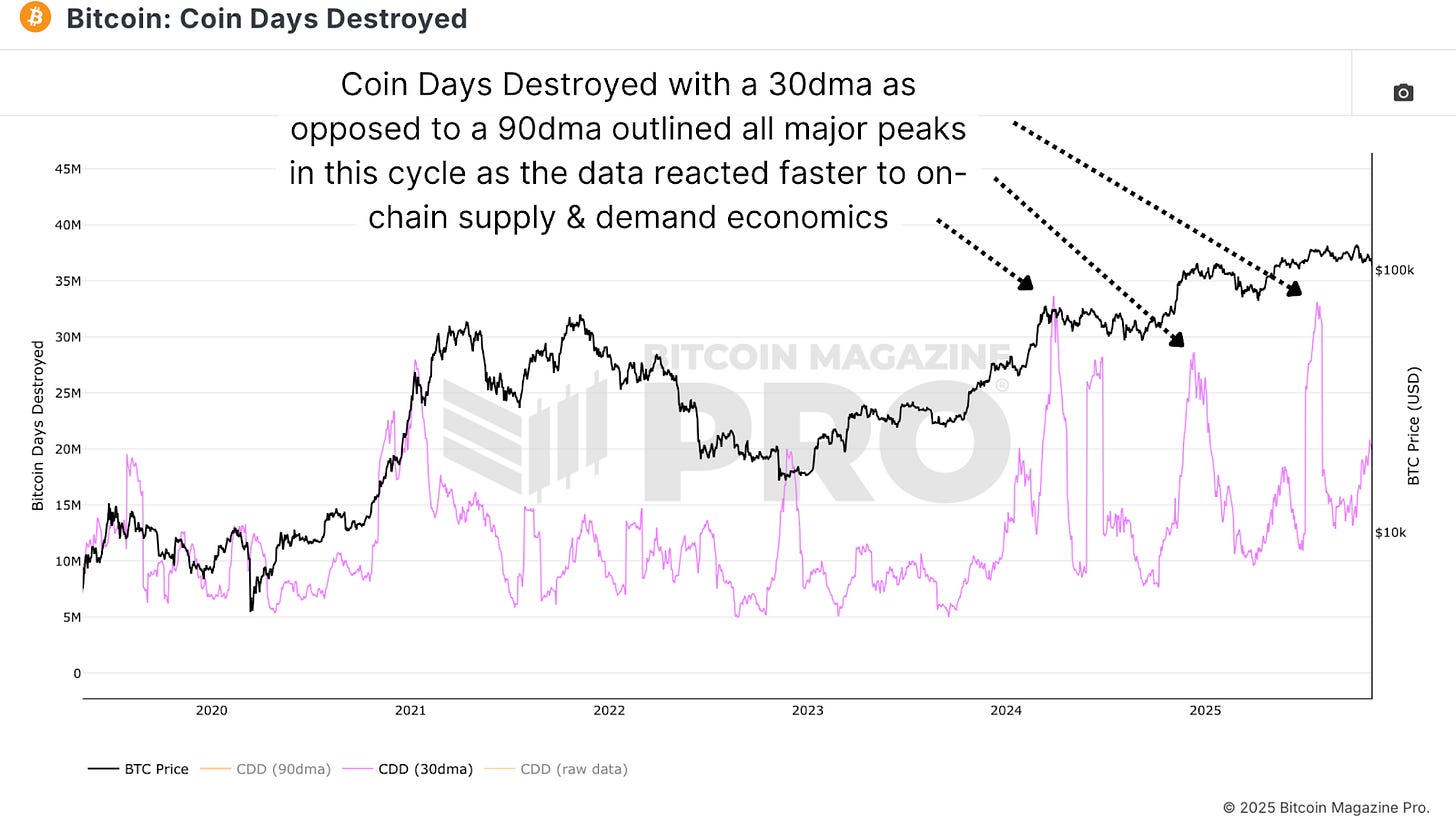
Figure 4: The 30-day moving average of CDD has proven more responsive to on-chain dynamics.
Examining recent readings—and particularly the rise leading up to new all-time highs in this cycle—the 30-day CDD metric triggered almost exactly at the cycle peak. It activated when Bitcoin first crossed ~$73,000–$74,000 and again when breaking $100,000, effectively marking all key distribution phases. While this is easy to observe in hindsight, it reinforces the point: on-chain supply-demand signals remain relevant; the task is to interpret them in light of current volatility and market depth.
Spent Output Profit Ratio (SOPR)
The Spent Output Profit Ratio (SOPR) offers another perspective on realized profit and loss, but raw data series can be noisy, with volatile spikes, mean-reverting profit patterns, and sharp swings during surges and mid-bull capitulations. To extract more actionable insights, one can apply a 28-day (monthly) change to SOPR. This smoothed alternative highlights emerging realized trends within a short window, especially when reaching extreme levels, thus signaling potential turning points in the cycle.
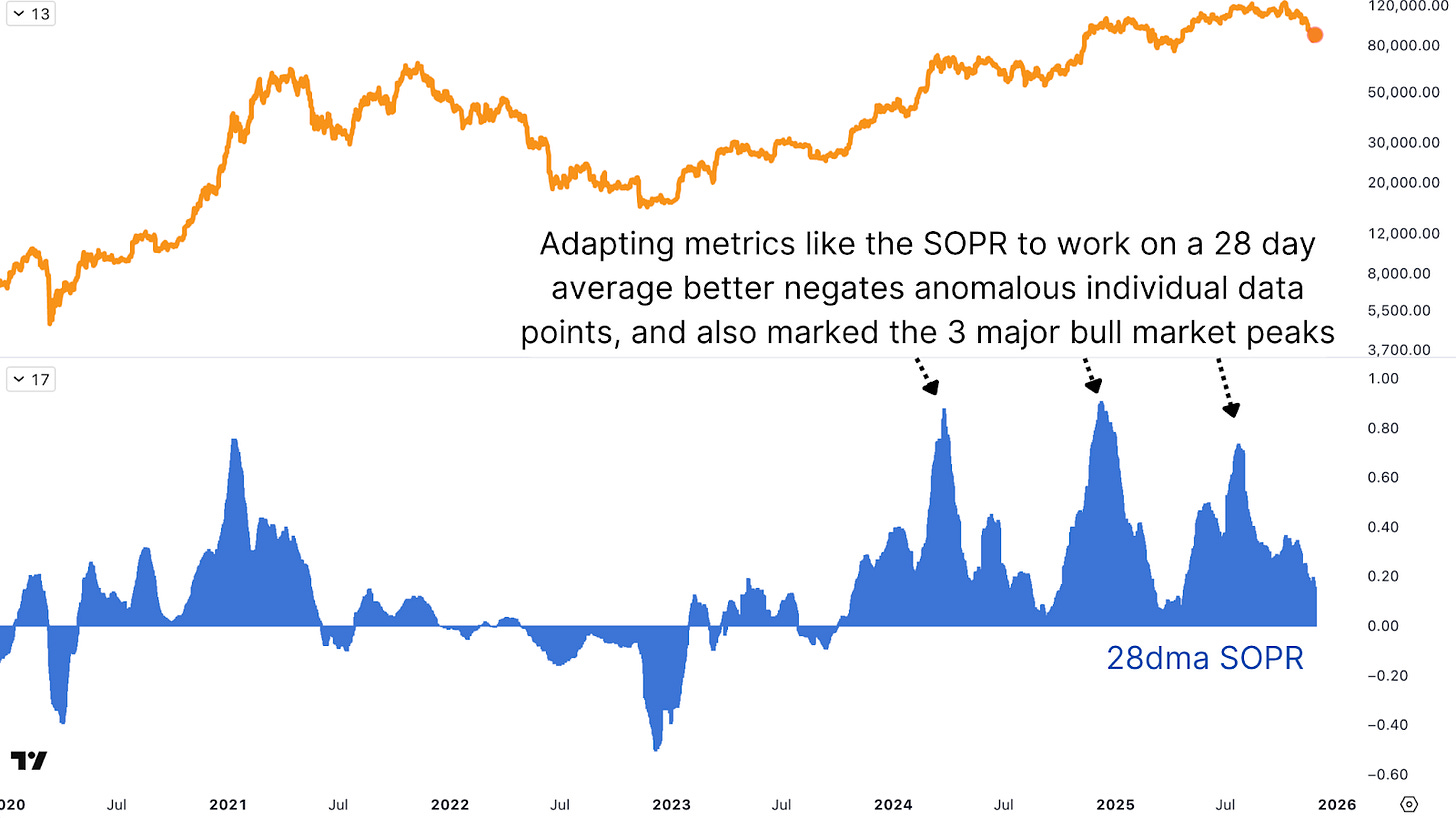
Figure 5: Applying a 28-day moving average to the SOPR indicator smooths the data, reduces excess "noise," and accurately identifies local tops.
Evaluating the recent cycle, the monthly SOPR change produced clear peaks when Bitcoin first broke the $73,000–$74,000 range, again at the $100,000 breakout, and near the $120,000 area. While none perfectly captured the ultimate top, each aligned with strong distribution pressure consistent with cycle fatigue. Using monthly changes rather than the raw metric makes signals clearer—especially when cross-referenced with Bitcoin’s purchasing power against equities and gold.
Conclusion
In hindsight, the top indicators popular throughout the bull market did function—if interpreted through the right lens and appropriate timeframes. The core principle remains: react to the data, don’t try to predict. Rather than waiting for any single indicator to perfectly call the top, using a basket of adjusted metrics—and interpreting them through the lens of momentum and shifting market dynamics—increases the probability of identifying when Bitcoin becomes overheated and when it transitions into a more favorable accumulation phase. The coming months will focus on refining these models to ensure they are not only historically valid but also maintain integrity and accuracy in the future.
Join TechFlow official community to stay tuned
Telegram:https://t.me/TechFlowDaily
X (Twitter):https://x.com/TechFlowPost
X (Twitter) EN:https://x.com/BlockFlow_News