Bitcoin: A Pullback or a New Bear Market?
TechFlow Selected TechFlow Selected
Bitcoin: A Pullback or a New Bear Market?
Long-term holders are still distributing, and have not yet reached bottom characteristics.
Author: Bitcoin Magazine Pro
Translation: Baihua Blockchain
Bitcoin has begun to show clear signs of weakness, and its recent drop below the six-figure mark (100,000 USD) has prompted a reassessment of near-term prospects. With several key technical and on-chain levels broken, I have adjusted my base case scenario—now assigning less than a 50% probability to a retest of new all-time highs in the coming weeks. This could change quickly if major levels are recovered, but until then, market conditions appear to have shifted from trend-like strength into a corrective phase.
Buying the Dip
Bitcoin has seen a substantial pullback, but buying the dip isn't always the optimal strategy unless it occurs within a confirmed bull market trend. In bearish environments, even nascent corrections can lead to significantly lower prices. Short-term bounces and retracements are typical in downtrending markets, making it more important to react based on data rather than preemptively calling bottoms.
Our analysis of the previous cycle's Short-Term Holder Realized Price chart reveals this pattern of multiple retests. It is also evident that this metric acted as critical resistance, with sustained rebounds only occurring after BTC reclaimed the Short-Term Holder Realized Price level.
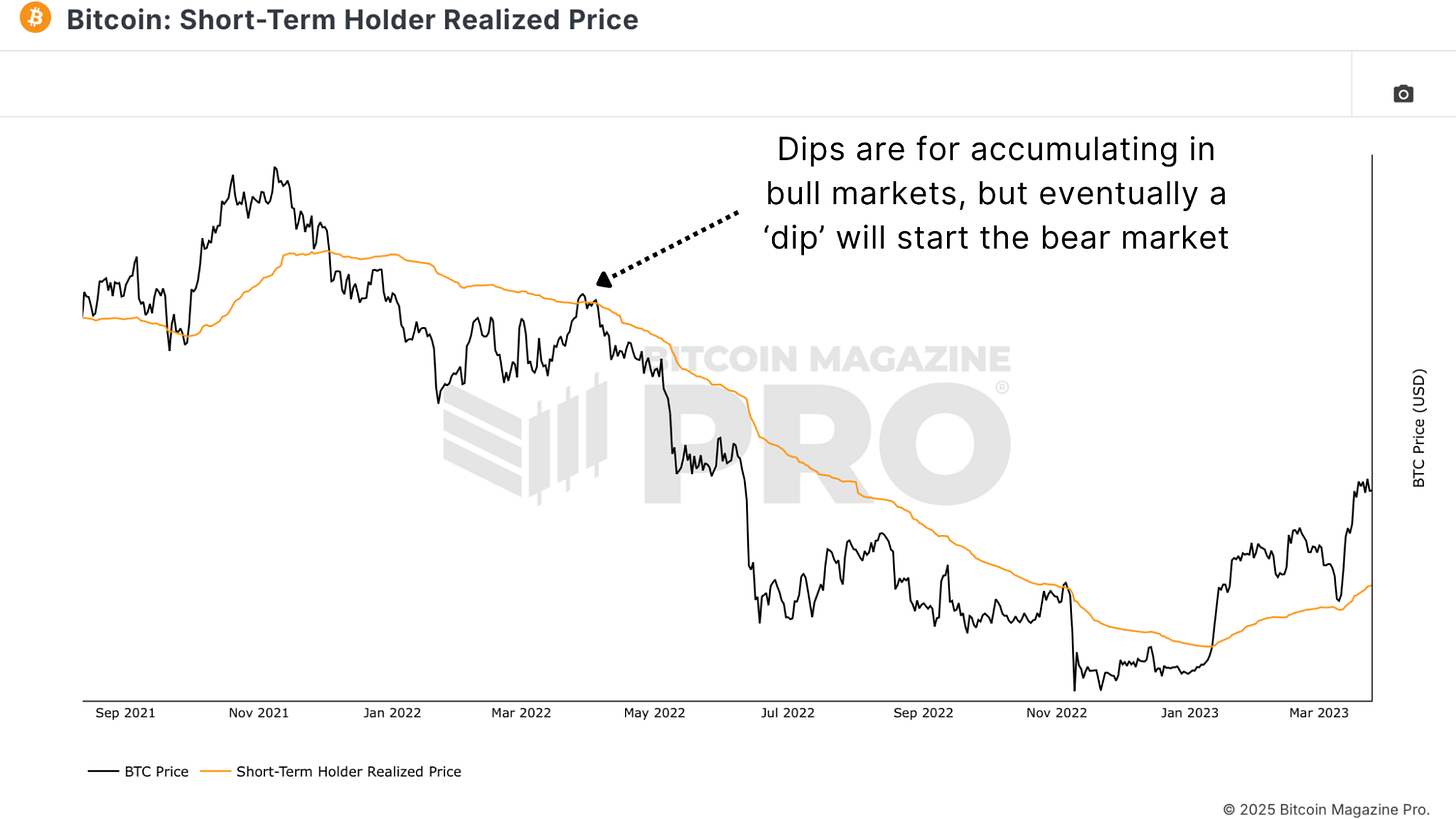
Figure 1: As observed in the previous cycle, multiple retests occurred before reaching the market bottom.
However, there’s a caveat: the entire picture shifts if price effectively recaptures key levels. That’s why allocating small positions during this pullback may make sense, while deferring further purchases until we see macro consistency—adopting a defensively positioned approach.
Key Observation Levels
The MVRV Z-Score and Bitcoin Realized Price more clearly indicate where the broader market cost basis lies. Currently, the network’s realized cost basis is clustered in the $50,000+ range, though this number rises daily.
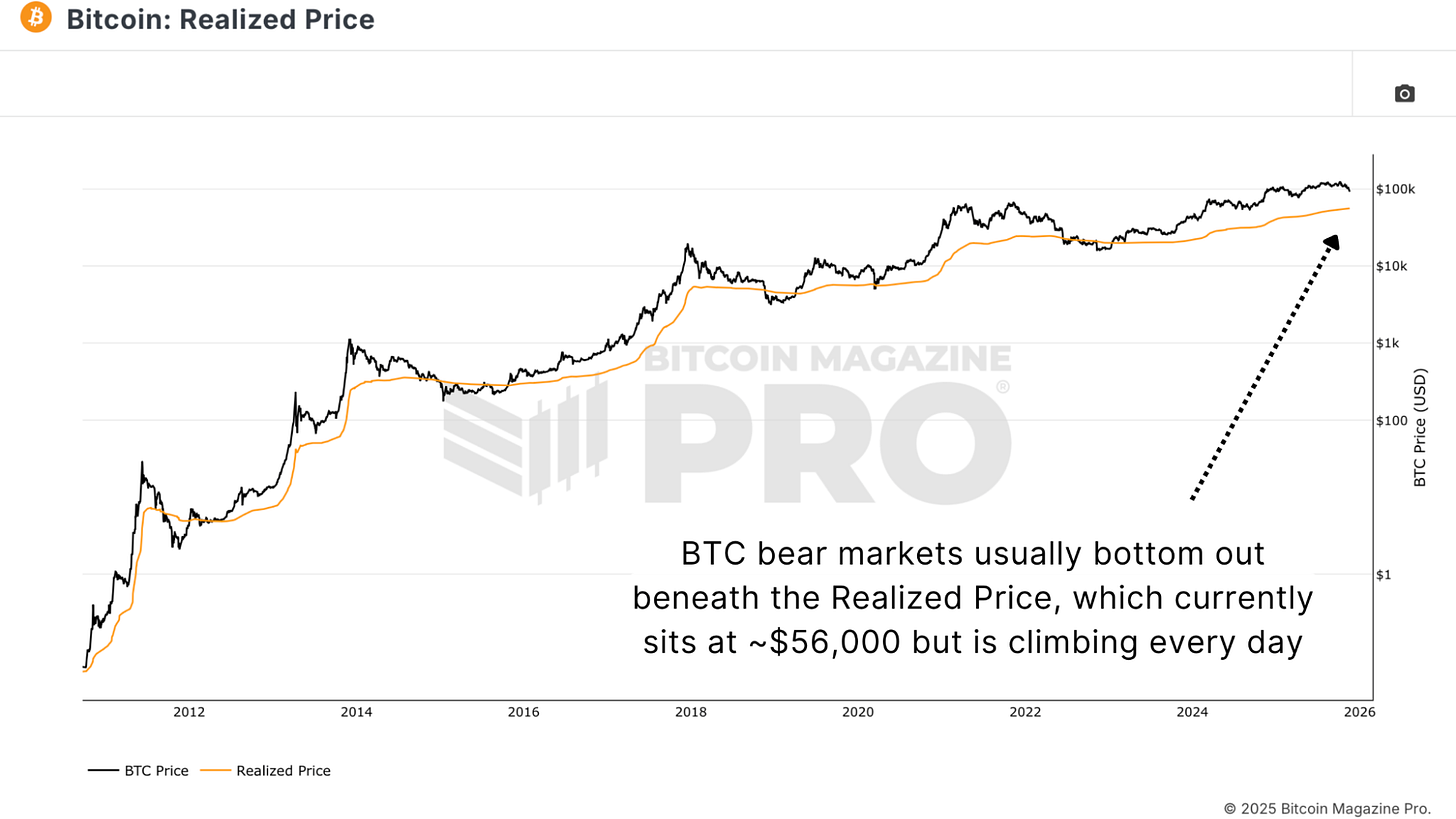
Figure 2: Historically, bear market bottoms typically occur when BTC trades below realized price.
A similar situation applies to the 200-week moving average (200-Week Moving Average), which currently also sits in the $50,000+ range. Historically, points where this indicator meets price have offered strong long-term accumulation opportunities.
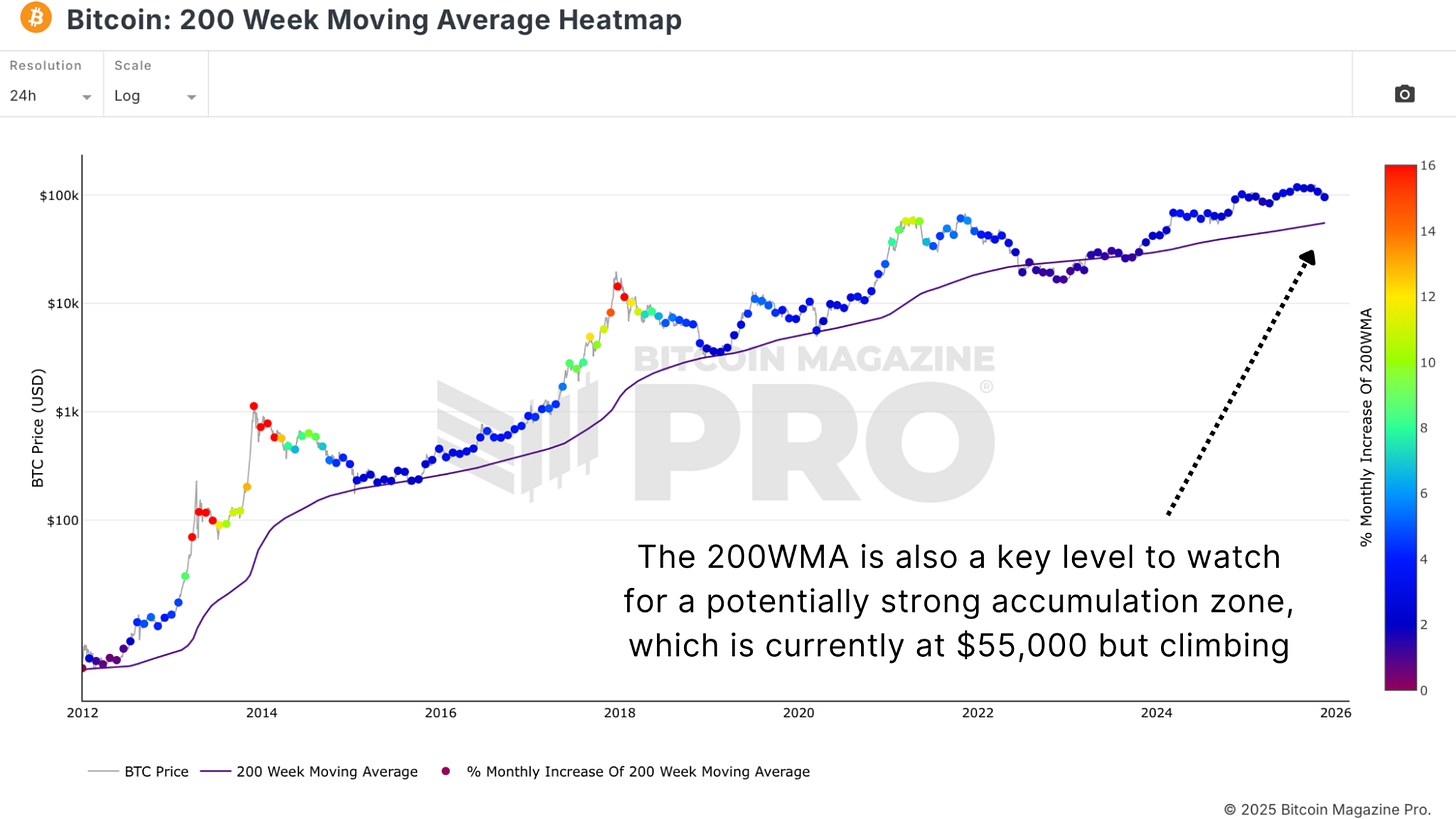
Figure 3: The 200WMA also suggests $55k as an accumulation zone, although it rises daily.
These metrics rise slowly each day, meaning potential bottoms could form at $60,000, $65,000, or higher, depending on how long Bitcoin’s trending phase persists. Crucially, value tends to stabilize when spot price trades near the network’s historical average cost, with key buy-side support levels providing consistency.
Supply and Demand Signals
The Value Days Destroyed (VDD) Multiple remains a crucial indicator for identifying stress points among long-term and experienced holders. Very low readings suggest large volumes of long-dormant coins remain unmoved, typically aligning with market bottoms. However, short-term spikes may reflect capitulation pressure, often coinciding with or preceding significant market turning points.
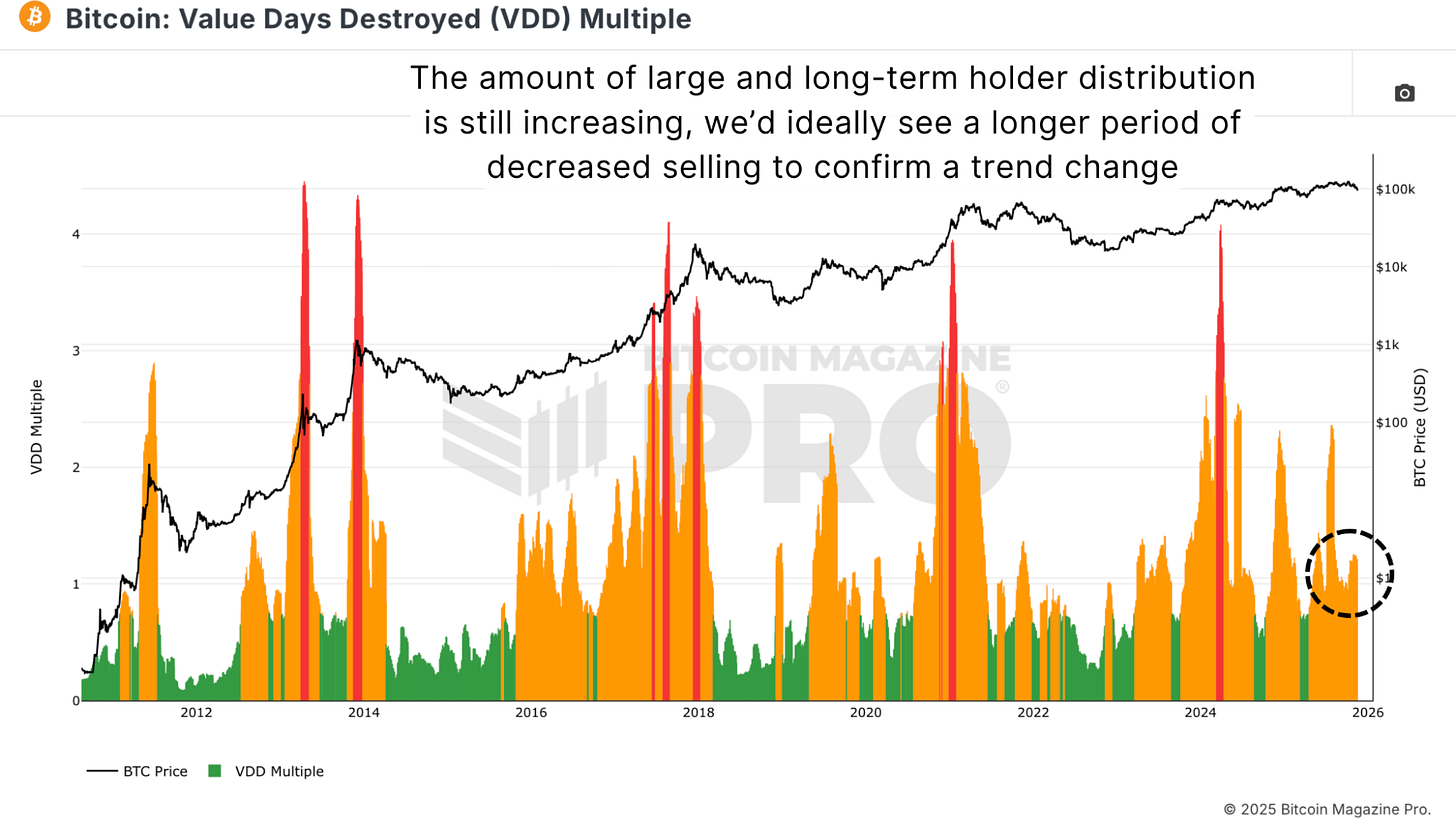
Figure 4: Current VDD Multiple readings indicate that larger, more experienced participants in the market remain highly active.
Currently, as price declines, the indicator continues to rise, suggesting many holders are succumbing to selling pressure. This does not resemble a cyclical bottom, which usually features extreme forced liquidations compressed into a short timeframe. At this stage, the market appears to be gradually releasing rather than exhausting itself. Meanwhile, Long-Term Holder supply should ideally stabilize and begin rising again before confirming any major bottom, as bottoms form when the most patient participants start holding (accumulating) rather than exiting.
Funding Rates
Periods of extreme fear tend to manifest clearly through large volumes of short positions, negative funding rates as shown by Bitcoin Funding Rates, and massive realized losses. These conditions indicate weak hands have capitulated on the downside, while strong hands absorb the supply.
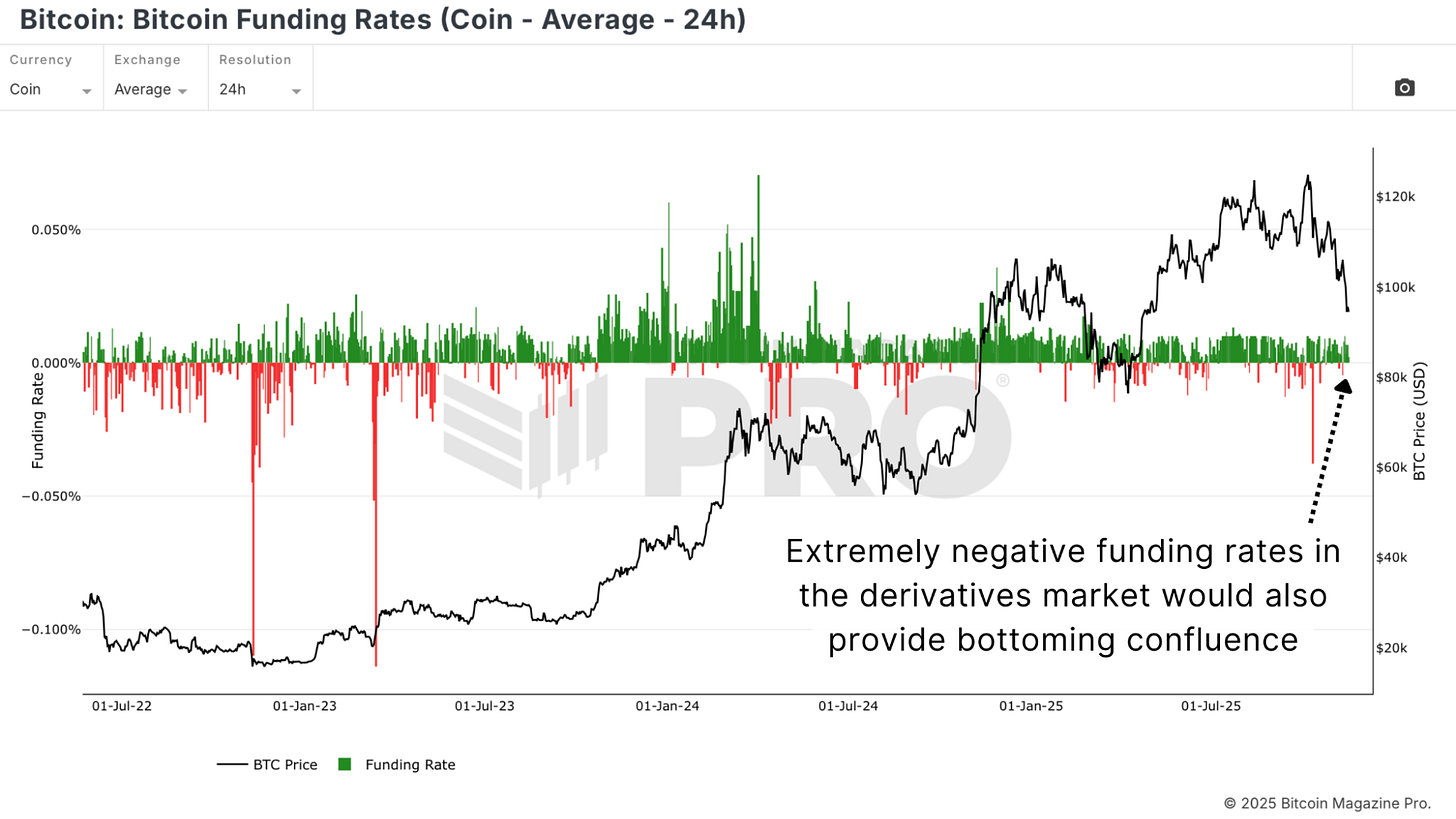
Figure 5: Severely negative Bitcoin funding rates have historically timed major market lows, typically followed by price rebounds.
The market has not yet exhibited the hallmark panic selling and short squeezes typically associated with deep cyclical lows. Without derivative market stress or a rush to realize losses, it’s difficult to argue the market has fully cleared.
Levels That Must Be Recovered
Assuming the bearish scenario is wrong—which would certainly be the preferred outcome—Bitcoin would need to begin reclaiming key structural levels, including the $100,000 psychological threshold, the Short-Term Holder Realized Price, and the 350-day moving average, as illustrated by the Golden Ratio Multiplier chart.
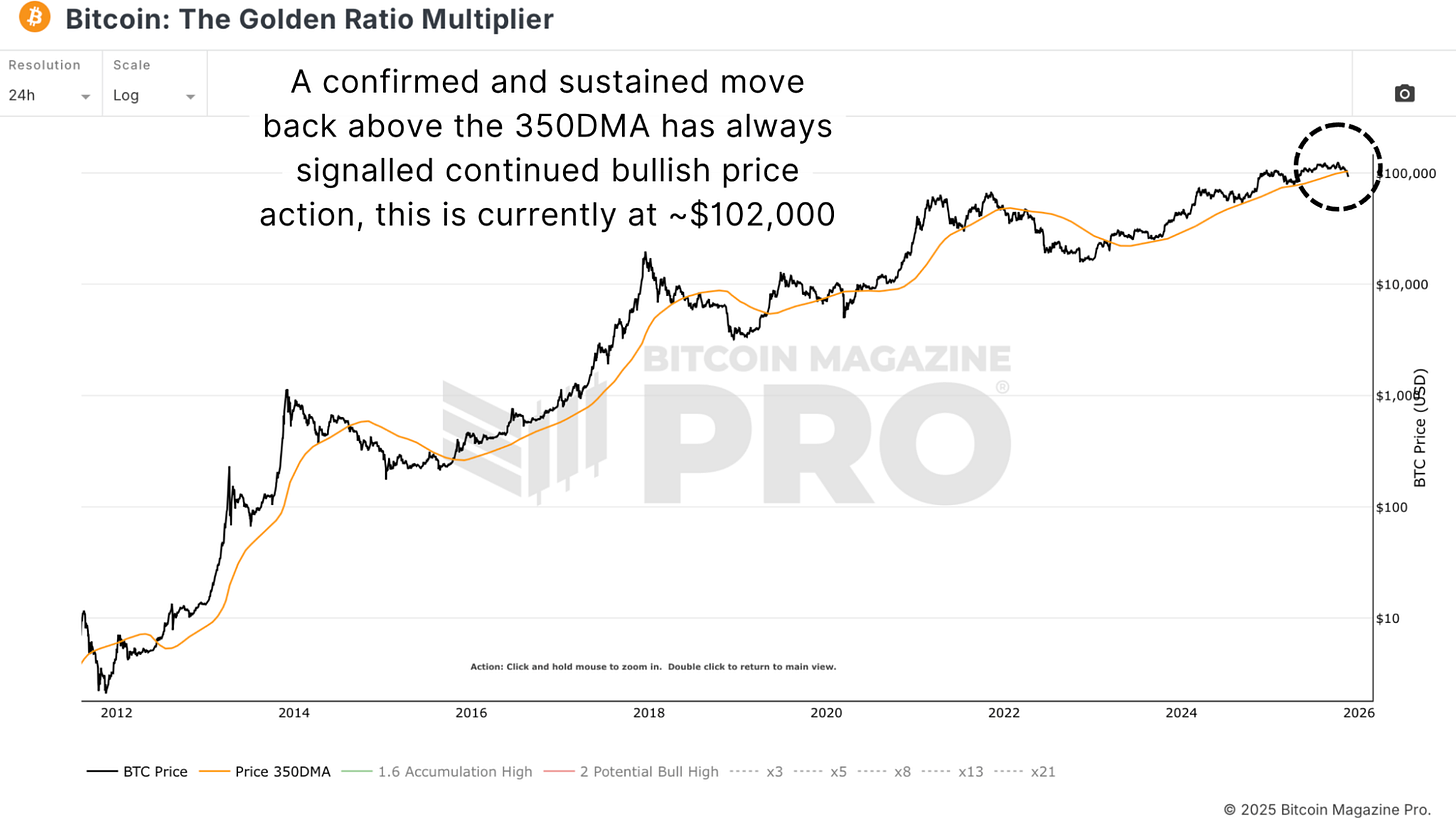
Figure 6: BTC must achieve sustained recovery above the 350-day moving average to resume a bullish trend.
Sustained closes above these levels, along with strengthening global risk assets, would signal a shift in trend. Until then, the data leans cautiously defensive.
Conclusion
Since breaking below several key levels, the outlook has become more defensive. Bitcoin’s long-term fundamentals show no structural flaws, but the short-term market structure does not reflect a healthy bull market trend.
For now, the recommended strategy includes avoiding blind "buy the dip" approaches, waiting for confirmation before establishing large positions, respecting macro conditions and trends, and only turning aggressive once strength is proven. Most investors will never perfectly time tops or bottoms; the goal is to position near high-probability zones with sufficient confirmation that the market has priced in excess overhang for months ahead.
Join TechFlow official community to stay tuned
Telegram:https://t.me/TechFlowDaily
X (Twitter):https://x.com/TechFlowPost
X (Twitter) EN:https://x.com/BlockFlow_News