Deconstructing DAT: Building In-Depth Analysis Beyond mNAV
TechFlow Selected TechFlow Selected
Deconstructing DAT: Building In-Depth Analysis Beyond mNAV
DAT is neither an angel nor a devil; neither a savior nor the culprit.
Author: kokii.eth
Executive Summary
-
Two-tiered market structure: The DAT industry exhibits a power-law distribution, where leading projects in each category dominate the vast majority of market share, leaving long-tail projects struggling to survive. Despite existing bubbles, DATs backed by real assets and differentiated treasury strategies still represent significant financial innovation.
-
Value and sentiment divergence: mNAV often masks long-term value drivers. Our growth decomposition model separates fundamental compounding growth from market sentiment. Data shows that companies like BMNR and HSDT have consistently grown per-share value, while most DAT stock prices declined primarily due to sentiment contraction, not deteriorating fundamentals.
-
Fragile flywheel effect: DATs rely on reflexive capital cycles—issuing shares at a premium to grow treasury holdings, defending per-share value when trading at a discount. This becomes highly challenging in declining markets. Companies like Bitmine manage prudently, while others aggressively issue shares, causing dilution and undermining long-term sustainability.
-
Dual evaluation framework: A complete assessment must focus on 1. Fundamental value growth independent of sentiment; 2. Issuance and treasury management—whether management responds responsibly to market conditions. Together, these determine whether a DAT creates or erodes value.
-
Data infrastructure gap: The industry urgently needs structured, comparable data, including standardized disclosures, improved transparency, and optimized operational practices. Greater data transparency will drive industry maturity and protect investor rights.
2025 marked the arrival of DAT Summer, with the rapid expansion of the sector as DATs such as Bitmine (BMNR), Sharplink (SBET), and Solana Company (HSDT) entered the mainstream. The total market cap of the 30 BTC, ETH, and SOL DATs we currently track has reached $117 billion. However, after market shocks, initial speculative fervor has begun to cool.
Despite ongoing market noise, most investors still assess DATs narrowly through mNAV (Market Cap / Net Asset Value ratio), failing to understand their core value, treasury strategy, or issuance discipline.
To address this, we compiled this report using the DAT data dashboard built by our partner Pantera, aiming to advance discussion, clarify misconceptions, and establish a more rigorous evaluation framework for DATs.
What Are Digital Asset Treasuries (DATs)?
Digital Asset Treasuries (DATs) are among the most compelling financial experiments in today's public markets. They are publicly traded companies whose balance sheets are predominantly composed of digital assets, allowing investors indirect exposure to digital assets such as BTC, ETH, and SOL via stock markets. This enables investors to trade within regulated environments through traditional brokerage accounts, avoiding the complexity of on-chain platforms.
Unlike ETFs or trusts, DATs are operating companies rather than passive investment vehicles. They can directly hold, trade, and even stake digital assets, issue new shares, or raise capital, forming actively managed treasury instruments whose value is tied both to underlying digital assets and corporate capital management strategies.
A typical DAT begins as a small public company or newly listed vehicle (SAPC) holding digital assets. Its Net Asset Value (NAV) reflects the total fair value of its holdings, while Market Cap (MCAP) represents how the stock market prices that same asset exposure—often at a premium or discount due to market sentiment, liquidity, and management confidence.
Some DATs, like Strategy, center their business model on using equity financing to continuously accumulate target assets. Others explore staking yields, derivatives exposure, or diversified portfolios, layering income generation on top of price exposure.
For investors, DATs serve as a bridge between traditional finance and on-chain assets:
-
For retail and institutional investors, DATs offer regulatory clarity, broker accessibility, and compliance compatibility, enabling digital asset exposure through familiar channels.
-
For the crypto ecosystem, DATs create new capital inflow channels, potentially increasing circulating scarcity of underlying assets, supporting staking infrastructure, and deepening secondary market liquidity.
Many companies and institutions participate in DAT offerings via PIPE (Private Investment in Public Equity), based on the "positive flywheel" illustrated below:
However, there are also widespread concerns about DATs:
-
This positive flywheel may be seen as an eternal bull-market engine, but what happens when both mNAV and underlying digital asset prices fall?
-
PIPE investors often receive shares at pre-announcement prices (typically lower than retail), raising suspicions of insider dealing or retail exploitation.
-
Trading above NAV is criticized because retail investors pay high premiums; trading below NAV is also problematic, as it may require selling assets to repurchase shares.
This article uses data analysis to address these concerns, clarify misunderstandings, explain the true meaning of key metrics, and share a methodology for evaluating DATs.
1. Core Metrics Explained: mNAV and Its Limitations
Since March 2025, the total market cap of the 30 DATs we track has risen from $88 billion (driven largely by Strategy/MSTR) to approximately $117 billion, spanning BTC, ETH, and SOL. Yet market discussions remain overly focused on mNAV as a single metric, overlooking its true implications and other important indicators.

Market cap growth trend of DAT companies (based on 30 tracked entities)
DATs are essentially publicly traded stocks, and their evaluation should focus on two key elements:
-
Company Value (NAV / Net Asset Value): Reflects intrinsic value. For DATs, this refers to total liquid assets on the balance sheet—including digital assets and undeployed cash equivalents. The primary value driver isn't traditional operating profit, but the accumulation and growth of digital assets.
-
Market Value (MCAP / Market Capitalization): The market’s assessment of company value, calculated as share price multiplied by total outstanding shares.
Net Asset Value / Net Asset Value (NAV)

NAV reflects the fundamental value of held assets, but specific composition varies by company. Some hold cash reserves, short-term treasuries, or other equities, while others hold convertible bonds or warrants, making NAV difficult to standardize. Existing dashboards often use simplified formulas, with some expanded versions incorporating debt and convertible instruments.
NAV Multiple / Multiple NAV (mNAV)
While NAV reflects a company's underlying assets, it does not capture how the market values those assets. That’s where market cap comes in—the market’s real-time valuation of the company.
The relationship between market cap and NAV provides the most watched metric in the DAT space: mNAV (NAV multiple)
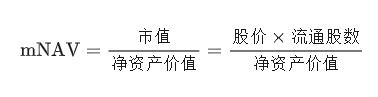
mNAV indicates how much the market is willing to pay for each dollar of net asset value:
-
mNAV > 1 → Indicates market optimism or perceived growth potential. The company is valued higher than its balance sheet assets, typically factoring in expected future per-share token growth.
-
mNAV < 1 → Reflects market skepticism. Investors may fear dilution, question management discipline, or believe the company fails to effectively convert digital asset exposure into shareholder value.
In essence, mNAV is an emotional multiplier built on fundamentals, revealing market belief in a DAT’s ability to accumulate digital assets over time.

mNAV multiples of BTC DATs (excluding CLSK, CORZ, NAKA, and SGNS)
As of today, in the BTC DAT category, Strategy (MSTR), GME, and MARA are all near 1.0 following recent market adjustments. But most other BTC DATs trade below mNAV of 1.0, with EMPD the lowest at around 0.5.
Newer entrants like DJT and USBC currently show mNAV of 2–3, reflecting early-stage speculative characteristics. Notable exceptions include CLSK at ~4 and CORZ near 7—both AI data center firms (formerly BTC miners)—indicating that despite overall market normalization, specific narratives or structural factors continue to drive premiums.
The ETH DAT market is similar: BMNR, SBET, and GAME trade around 1.0 mNAV, reflecting fair-value pricing; BTBT and COSM have higher multiples due to profitable business lines beyond mere digital asset holdings, suggesting the market does not treat them purely as DATs.
Among Solana DATs with registered PIPE shares, only HSDT trades at a slight premium of 1.12x (as of November 12, 2025), while others trade slightly below 1.0, indicating alignment between market trends and fundamentals, and a cooling compared to earlier cycles.
Premium and Discount
Premium/discount is essentially another way to express mNAV, measuring market trust or speculation toward a company's treasury value in relative price terms rather than multiples. High premiums signal leverage, strong sentiment, or operational outperformance, while discounts usually reflect concerns about equity dilution or weak capital discipline.


Dashboards reveal extreme cases like COSM and CORZ with ~800% premiums, largely because the market values them based on core operations, not their DAT attributes.
Per-Share Digital Assets
Evaluating a DAT’s intrinsic growth requires tracking both digital asset holdings and outstanding shares. Healthy DATs aim for growth in both: increasing digital asset holdings to expand the base asset pool, and issuing new shares to fund growth. While new share issuance dilutes existing shareholders, it becomes accretive if asset growth outpaces share growth.
The key derived metric—per-share digital assets—measures how much digital asset each share effectively represents, reflecting the amplification of shareholder exposure. Rising per-share cryptocurrencies indicate that raised capital is being used to grow assets, not merely offset dilution.

Among the 30 tracked DATs, few companies show stable upward growth in per-share digital assets. Notable exceptions include Strategy (MSTR), BMNR, HSDT, ETHM, BTCS, CEP, and UPXI.
Experience shows many DATs, even those initially strong, suffer sharp equity dilution from excessive share issuance. In contrast, the aforementioned companies maintain consistent growth without major drawdowns, indicating more prudent strategies in balancing capital issuance and asset accumulation.

ETH DATs with sustained per-share asset growth: BMNR, ETHM, BTCS

SOL DATs with sustained per-share asset growth: HSDT, UPXI
Other Market Metrics
Besides company-level metrics, several comparative indicators help measure a DAT’s position within the broader ecosystem:
-
Market share (by NAV, market cap, or trading volume): Measures relative dominance among different DATs for each digital asset. Since DAT shares represent different underlying asset values, comparing raw trading volumes can be misleading. Turnover rate (volume / market cap) more accurately measures liquidity and activity.
-
Asset supply percentage: The proportion of total tokens held by DATs, reflecting their systemic impact on the underlying ecosystem.
In the BTC DAT space, Strategy dominates significantly: holding 83.3% of total BTC DAT holdings (3.22% of total BTC supply) and 72% of category market cap. GME and BRR show notable growth in trading volume share, reflecting rising retail participation.

BTC DATs trading volume (USD) market share

ETH DATs crypto asset holdings market share
In the ETH DAT sector, Bitmine similarly leads: holding over 66% of total ETH DAT holdings (~2.9% of ETH supply), 68% of market cap, and 85% of trading volume. SBET ranks second with ~16–20% in ETH holdings and market cap, followed by BTBT (~6%).
Solana DAT market concentration is lower: FORD leads with 45% market cap and 44% SOL holdings. HSDT, DFDV, STSS, and UPXI each hold about 13–14% of SOL, but Solana Company (HSDT) leads peers with ~22% market cap.

SOL DATs crypto asset holdings market share

SOL DATs market cap market share
Interestingly, in terms of trading volume, the situation reverses: DFDV and UPXI lead FORD in activity. Historical trends suggest they were pioneers in the Solana DAT category, and this advantage persists—even though FORD later achieved higher NAV, early movers retain momentum and market attention.

SOL DATs trading volume (USD) market share
2. Limitations and Misconceptions
Although simple in definition, tracking these basic metrics is not straightforward—mainly because SEC filings provide data that is neither real-time nor standardized like on-chain data.
The best source for standardized balance sheet accounting is the 10-Q form, but it is only released quarterly. Many companies use custom-designed or branded PDFs, complicating extraction. Even when data is reported consistently, it is often embedded in text files requiring semantic parsing. Additionally, each company formats reports differently, which is understandable given variations in equity structures and financial assets.
Sources for holdings updates can be highly fragmented—some companies don’t file with the SEC at all, instead disclosing changes via Twitter, press releases, or media interviews.
Nonetheless, most stock market metrics (e.g., price and volume) are fairly standardized. However, tracking outstanding shares remains difficult—companies aren’t required to report daily, and many dashboards rely on third-party APIs that source data from market makers or banks, often with multi-day delays.
One best practice comes from Bitmine, which reports its digital asset holdings weekly (sometimes more frequently) via 8-K filings.
When interpreting DAT data, it’s crucial to recognize how these data challenges distort metrics:
-
Holdings updates
-
Low frequency (monthly/quarterly) causes NAV to become outdated, artificially inflating mNAV or premium
-
Some DATs hold DeFi tokens, NFTs, other stocks, or semi-liquid assets, complicating asset valuation
-
Share count updates: Failure to file large-scale issuance or buyback notices affects estimated market cap, mNAV, premium/discount, and per-share digital assets.
We’ve identified common blind spots in public reporting:
-
Pro-Forma Accounting: Most dashboards rely solely on filed outstanding shares, ignoring potential warrant exercises. In DAT PIPE deals, warrants are often bundled with PIPE shares, exercisable at prices equal to or above the PIPE price. Once the stock trades above that level, exercising becomes rational. Since exercised warrants increase shares without adding equivalent value, they significantly dilute key metrics. Incorporating unexercised warrants into pro-forma calculations offers a more accurate picture of potential dilution and shareholder risk exposure.
-
Prefunded Warrants: These generate proceeds already included in NAV, but corresponding shares haven’t been issued yet. In many cases, these warrants have near-zero exercise prices, meaning share count increases without additional funding—resulting in one-sided dilution. We believe these warrants should be counted as outstanding shares; otherwise, resulting mNAV calculations underestimate market cap and overstate NAV, creating imbalance.
-
Pending M&A and PIPE: When a company announces a new PIPE, cash proceeds are often reflected in NAV updates before S-3 registration. If shares aren’t adjusted pro-forma, the NAV per-share denominator is underestimated, artificially inflating the metric. The chart below summarizes major share issuance types and their impact on outstanding shares.

Debt and derivative exposure: Except for Artemis, nearly no dashboards currently include debt liabilities or leveraged exposures. This omission distorts NAV, especially for DATs using structured yield or staking strategies.
After accounting for debt, adjusted NAV (and adjusted mNAV) should reflect true book value. This allows clearer comparison between pure treasury-exposure DATs (like MSTR) and hybrid operating DATs (like BMNR or SBET). What role does debt play in DAT management? In traditional finance, companies issue debt to fund growth while protecting shareholder ownership. In the DAT space, motivations are similar. Equity issuance means selling future upside to new shareholders, diluting existing owners. Debt issuance, however, means borrowing against existing assets without causing equity dilution (if managed properly). Thus, DATs can use debt to scale on-chain assets without reducing per-share digital asset value.
Due to these complexities, Pantera built the DAT dashboard—to present a clearer, deeper view. Beyond data cleaning and standardization, the goal is to advance the conversation: compare DATs to the broader stock market, not just within their own category; and advocate for greater on-chain transparency by tracking treasury wallets, yield generation, and other on-chain activities in future versions.
3. Choosing the Right Metrics
mNAV alone cannot fully reflect DAT performance. Below is our recommended analytical framework for comprehensively assessing DAT performance.
Growth Drivers and Fundamental Price
If we treat a DAT’s stock price as a product of several potential growth factors (per-share token growth, token price, and market sentiment), we can decompose it to identify the true drivers of performance, beyond mere narrative.
Formally, we can express the stock price at time t as:
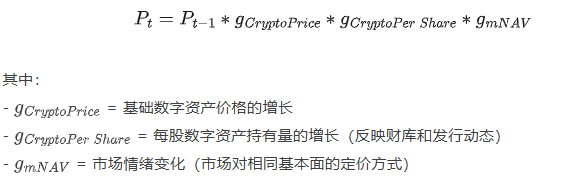
This decomposition allows us to isolate each factor and independently track what truly drives price movements:
-
When stock prices fall, we can determine whether it’s due to cooling sentiment, falling underlying asset prices, or deteriorating fundamentals—and vice versa for price increases.
-
It helps cut through noise—for example, when a company’s intrinsic value keeps growing while its market price declines.
When we decompose Bitmine’s (BMNR) price growth, we find that per-share ETH has steadily increased since launch, while mNAV (sentiment multiple) has sharply contracted. This suggests strong fundamentals, with only the speculative layer cooling down.

Generalizing this framework into three growth factors, we can plot DATs by category to assess overall health:
BTC DATs: Most show relatively flat fundamental value growth, such as MSTR, CLSK, and CEP, with clear upward trends. In contrast, despite stable fundamentals, SMLR, FLD, DJT, LMFA, and EMPD have experienced sharp sentiment declines since tracking began, which is the main reason for their falling stock prices. Currently, SQNS is the only DAT showing actual value decline.

ETH DATs: As early entrants, ETHZ and SBET benefited from initial sentiment surges, despite relatively flat per-share ETH. Since then, BMNR, ETHM, BTCS, BTBT, and GAME have shown steady per-share value growth, even as their mNAV growth trends downward—possibly indicating launches near market cycle peaks. FGNX is the exception, suffering severe dilution and sentiment collapse, leading to underperformance.

SOL DATs: HSDT shows the most significant per-SOL growth, tripling from October to report publication; UPXI also grows steadily, though smaller in scale. DFDV benefits from rising sentiment, but its per-SOL holdings declined during the same period, suggesting gains were sentiment-driven rather than fundamental. Meanwhile, FORD and STSS both saw mNAV expansion, but flat fundamental value growth, indicating performance driven by sentiment, not balance sheet strength.

Base Case Price
As shown above, most DATs have experienced market cooling or contraction since launch. To understand their underlying trajectory, we can reconstruct each company’s theoretical base case price—essentially answering: “If market conditions were the same as on the day the DAT launched, what would today’s stock price be?”
In other words, if you had held one share since inception, letting the company gradually accumulate inventory and issue shares over time, what would that share be worth now?
The chart below shows that several DATs—HSDT, BMNR, BTBT, BTCS, CORZ, and CEP—have steadily increased fundamental value, but their stock prices failed to reflect this due to changing market conditions. Since inception, their fundamental metrics have grown significantly, even as overall market sentiment shrank.


Share Issuance and Dilution
A DAT’s success hinges on equity issuance discipline. A key dimension in evaluating DATs is how management responds to market conditions—taking strategic action versus passive reaction when sentiment shifts.
-
When mNAV > 1: The company has an opportunity to issue shares at a premium. The critical question is issuance discipline. Excessively aggressive issuance erodes per-share digital assets, depresses per-share NAV, and ultimately destroys sentiment. Disciplined issuers responsibly scale up, while reckless ones play the so-called "infinite ATM game."
-
When mNAV < 1: The challenge is greater. A sub-1 valuation multiple signals market lack of confidence in the company’s capital discipline, liquidity, or treasury management strategy. The market may be pricing in expectations of future dilution, fearing management continues issuing shares during weak sentiment. It may also indicate poor capital efficiency, with the company failing to convert digital asset exposure into shareholder value.
Sustained mNAV below 1 breaks the DAT flywheel. The company can no longer issue new shares at a premium without diluting existing shareholders. If it forces issuance, per-share digital assets decline further, damaging trust and losing access to equity growth tools. Over time, this dynamic may turn the company into a "zombie DAT"—a static holding company trading below liquidation value.
When mNAV falls below 1, the correct response is defensive action and reputation recovery: halt all equity issuance (including ATM and PIPE), and prioritize protecting per-share digital assets. The company must also improve transparency and financial reporting—publishing proof-of-reserves, dashboards, and regular NAV updates to prove it is a clean, verifiable financial wrapper, not an opaque shell. If liquidity permits, buying back shares below NAV can be accretive and send a strong confidence signal, often restoring premium levels. Management can also leverage on-chain yields—staking ETH, participating in restaking, or earning returns from financial assets—to naturally boost NAV growth and turn passive holdings into income sources. Finally, the company must strengthen its narrative, positioning itself as a clear, reliable representative of a specific asset or ecosystem, as investor trust often returns when the investment thesis is clear.
For mNAV < 1 DATs, the right strategy focuses on protecting per-share value, enhancing transparency, and rebuilding trust. By analyzing issuance data, share buybacks, and treasury behavior, we can identify which companies pursue value creation and which continue diluting equity.

Data shows that the best-managed DATs historically protect shareholder leverage during downturns—laying the foundation for rebound when sentiment recovers.
The chart above reveals clear differences among ETH DATs in equity issuance and sentiment management. Most show a gradual increase in outstanding shares—suggesting possible PIPE or ATM issuance.
BMNR’s data shows a more gradual pattern of share issuance and mNAV change compared to peers. This sets a benchmark for responsible scaling—using equity as a growth tool without breaking the mNAV growth flywheel.
BTBT, GAME, and BTCS experienced sudden, sharp increases in outstanding shares, while mNAV remained flat or declined, though their timing was still reasonable, as issuance occurred when mNAV traded above 1, within a premium window.
In contrast, FGNX and ETHZ conducted large-scale share increases when mNAV < 1, effectively issuing stock during market weakness rather than waiting for favorable conditions—a classic sign of poor capital discipline. For FGNX, early and aggressive dilution at mNAV near zero caused destructive events, wiping out investor leverage and long-term confidence. However, ETHZ briefly showed corrective signs in mid-October by reducing share count, helping its mNAV recover from below 0.2 and partially restore balance.
4. Open Questions for Further Research
Pantera’s dashboard data also opens new research avenues:
-
Unlock events: How much do they contribute to price declines?
-
PIPE investor ROI: Which deals in the DAT space have generated positive returns? And how do results change when adjusted for underlying token performance (e.g., relative to spot ETF returns)?
-
Market microstructure: How does PIPE pricing news affect trading behavior?
-
mNAV dynamics modeling: Is there a quantifiable relationship between issuance/buybacks and mNAV recovery?
More work remains in DAT data, calling for better data standards. Stock data is far messier than on-chain data: inconsistent formats, low update frequency, no unified schema. For DATs to evolve into a legitimate asset class, we need open, standardized APIs for companies to report daily financial updates, covering:
-
Issued shares (including prefunded and PIPE shares)
-
Treasury holdings by asset class
-
Warrant and debt data
Just as on-chain transparency advanced DeFi analytics, this layer of financial data transparency could transform how capital flows into DATs.
5. Conclusion
DATs are neither angels nor demons; neither saviors nor villains.
They represent a new form of capital formation—an innovative, bidirectional investment tool: helping digital assets appreciate while offering traditional institutions leveraged exposure with embedded on-chain yields. They are not perpetual motion machines, as the flywheel can break under market stress, but rather asset management firms requiring disciplined strategy and execution. At their best, DATs unlock meaningful value for both sides of the ecosystem:
-
For traditional investors, they offer regulated, liquid, and yield-enhanced exposure to digital assets—often providing on-chain yields unavailable through ETFs or trusts.
-
For the crypto ecosystem, they channel traditional market capital directly into token treasuries—anchoring asset value within compliant structures and enhancing liquidity.
-
If managed well, they can amplify positive feedback loops between capital markets and digital asset fundamentals: rising mNAV leads to new issuance, new funds flow into digital asset purchases, fueling an upward cycle.
In this sense, DATs serve as the "second cornerstone" for digital assets: institutionalizing capital inflows while offering investors new, yield-enhanced investment opportunities.
To be sure, criticisms are real and often instructive:
-
Some DATs are mere hype shells with no real operating strategy, serving as short-term exit vehicles for PIPE investors at the expense of retail—no different in essence from Memecoins;
-
The market doesn’t need dozens of DATs tracking the same asset. Without differentiated treasury strategies or governance models, DAT proliferation only adds noise and undermines trust in the model. Likewise, there’s no need to create DATs for hundreds of digital assets lacking long-term value, especially those operated by teams with low credibility, no community recognition, or limited technical innovation. Such expansion risks turning DATs into speculative fads rather than reliable financial tools;
-
The death spiral (mNAV < 1) remains the toughest challenge. DATs inherently amplify exposure to an already volatile asset class, and once sentiment turns, discounts can rapidly widen. But mNAV < 1 usually signals misalignment, not collapse. Investors may be reacting to weak capital discipline, fears of dilution, or inefficient treasury management—not failure of the underlying digital asset itself. Strong operators can reverse course through transparent communication and strict equity management.
Ultimately, investing in DATs requires dual conviction from market participants:
-
Bullish long-term outlook on the underlying asset—believing its price will rise over time and seeking leveraged exposure through active equity vehicles;
-
Trust in operator execution and capital discipline—as Fundstrat’s Tom Lee noted, mNAV < 1 is illogical, and competent management teams will eventually pull the stock price back to parity.
If both hold true, then a low mNAV is not a warning sign, but a temporary market mispricing of actual balance sheet value.
At its core, the DAT represents a new type of investment vehicle—it helps digital assets accumulate lasting value, while offering financial institutions a regulated, yield-enhancing pathway to participate in the future of the digital asset era.
Join TechFlow official community to stay tuned
Telegram:https://t.me/TechFlowDaily
X (Twitter):https://x.com/TechFlowPost
X (Twitter) EN:https://x.com/BlockFlow_News