Key turning point lost, the Fed's "hawkish shadow" may reignite market volatility
TechFlow Selected TechFlow Selected
Key turning point lost, the Fed's "hawkish shadow" may reignite market volatility
Bitcoin shows signs of weakness, and market confidence is being tested.
Author: Chris Beamish, CryptoVizArt, Antoine Colpaert, Glassnode
Translation: AididiaoJP, Foresight News
Bitcoin's struggle below key cost basis levels reflects weakening demand and ongoing selling pressure from long-term holders. Although volatility has cooled and options positioning is relatively balanced, the market now hinges on expectations around the Federal Reserve meeting, where any hawkish surprise could reignite volatility.
Summary
-
Bitcoin rebounded over the weekend from a supply cluster between $107K and $118K, mimicking previous short-lived rallies after all-time highs, but sustained selling pressure from long-term holders limited further upside.
-
The market continues to struggle above the short-term holder cost basis (around $113,000), a critical battleground between bullish and bearish momentum. Failure to reclaim this level increases the risk of a deeper retracement toward the active investor realized price (approximately $88,000).
-
Short-term holders are exiting at a loss, while long-term holders remain heavy net sellers (~-104,000 BTC/month), indicating weakening conviction and continuous supply absorption.
-
Implied volatility, after a sharp drop in October, has significantly cooled, skew has flattened, and options flows reflect constrained upside potential and measured downside hedging.
-
The current calm in volatility depends on the next Fed decision. A dovish outcome would maintain stability, but any hawkish surprise could reignite volatility and demand for downside protection.
On-Chain Insights
Familiar Rebound Pattern
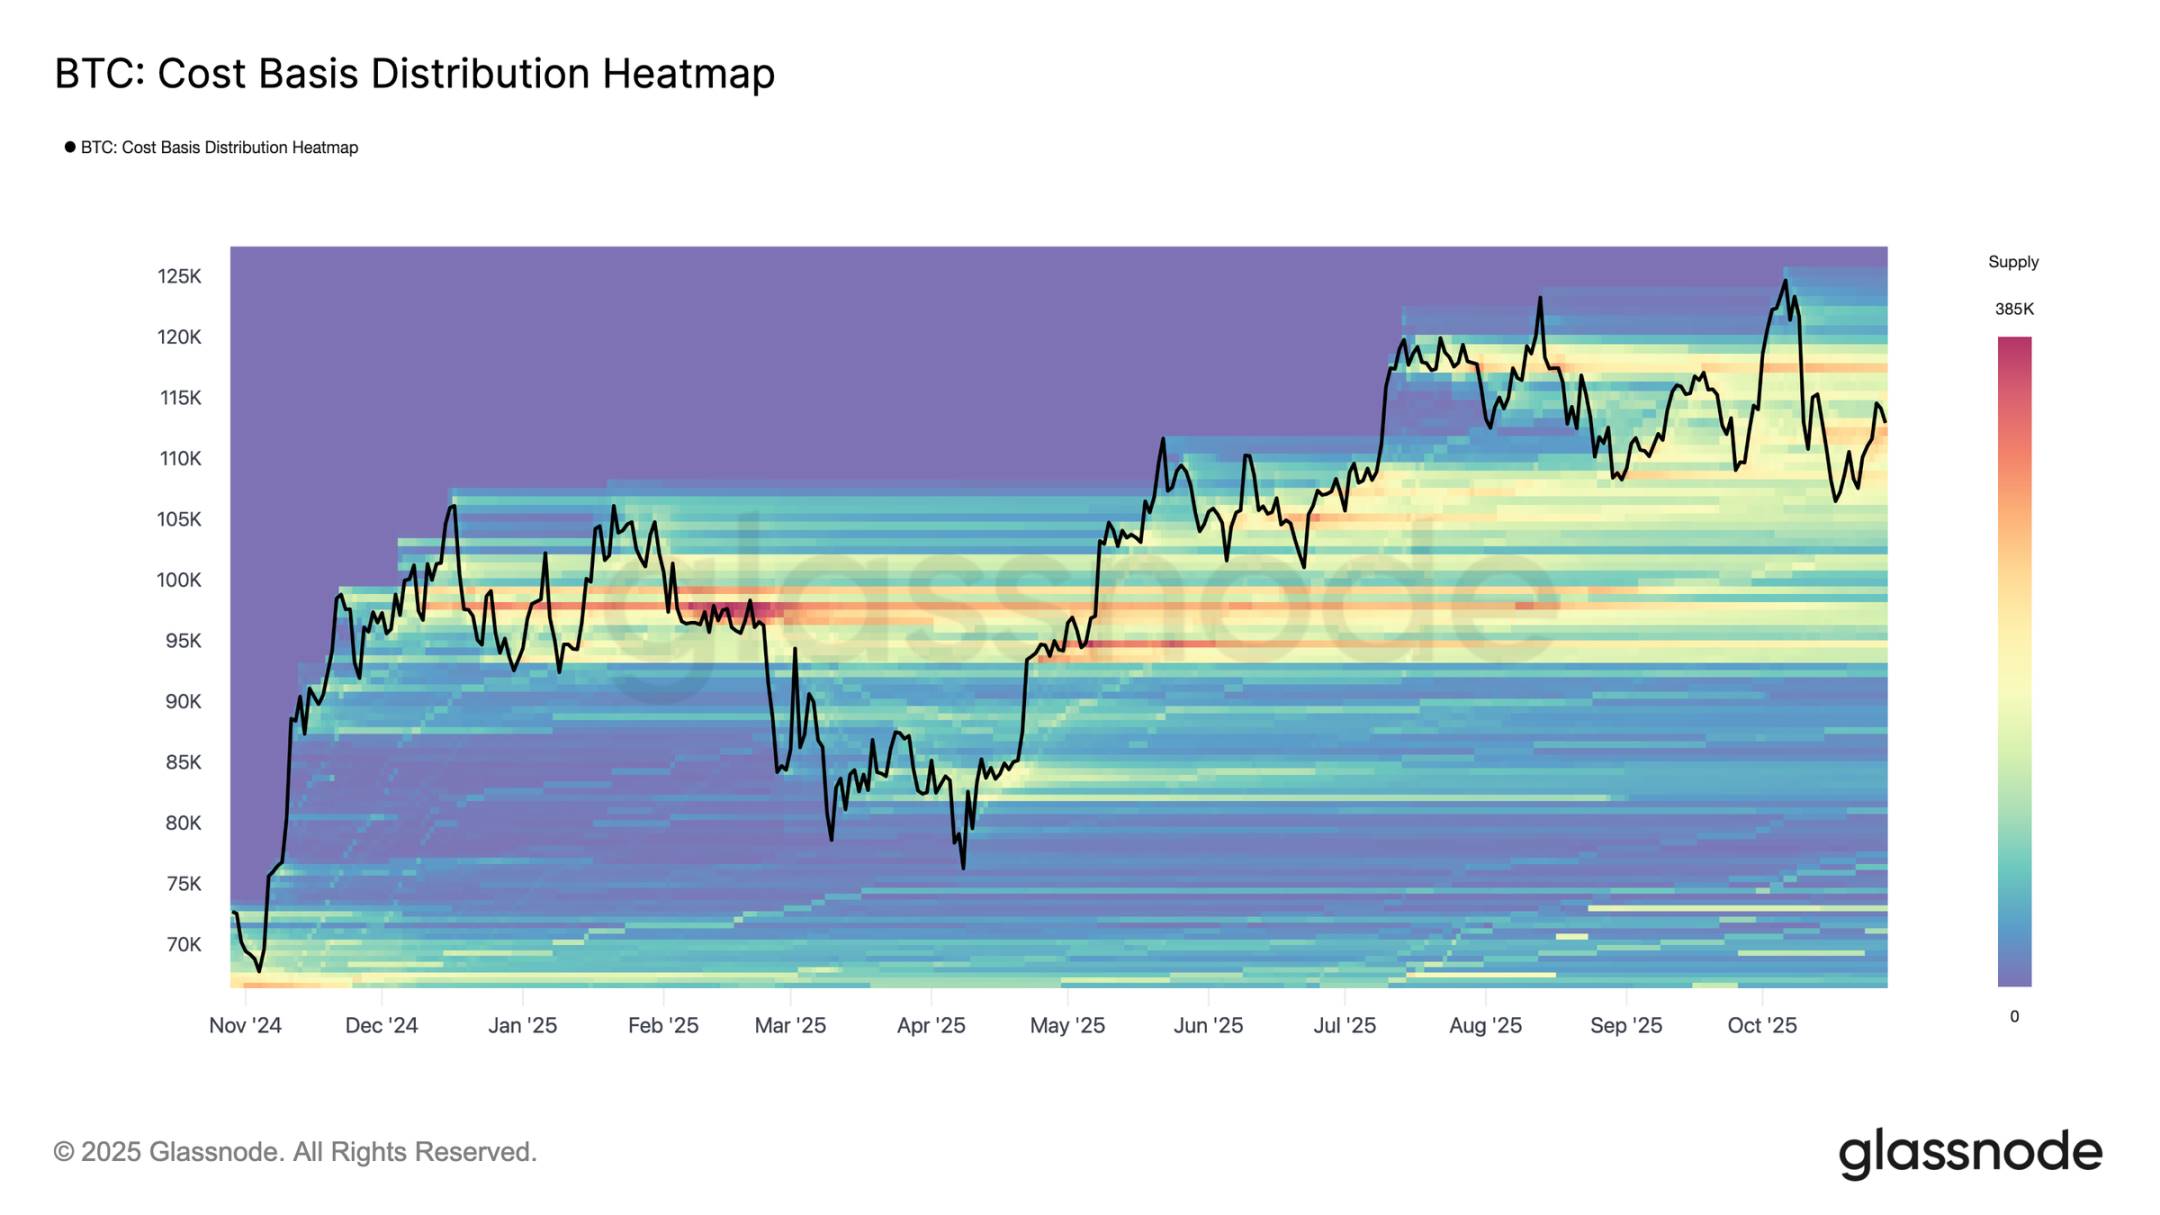
Last weekend, Bitcoin saw a brief recovery after briefly dipping to the lower boundary of the top buyer supply cluster ($107K–$118K). According to the cost basis distribution heatmap, price bounced from near the midpoint at $116K before falling back to around $113K.
This structure closely mirrors post-all-time-high rebound patterns observed during Q2–Q3 2024 and Q1 2025—temporary rallies emerge, but demand is quickly absorbed by overhead supply. In the current case, renewed selling from long-term holders further amplifies resistance within this supply zone, highlighting how profit-taking at elevated levels continues to cap upward momentum.
Barely Holding the Line
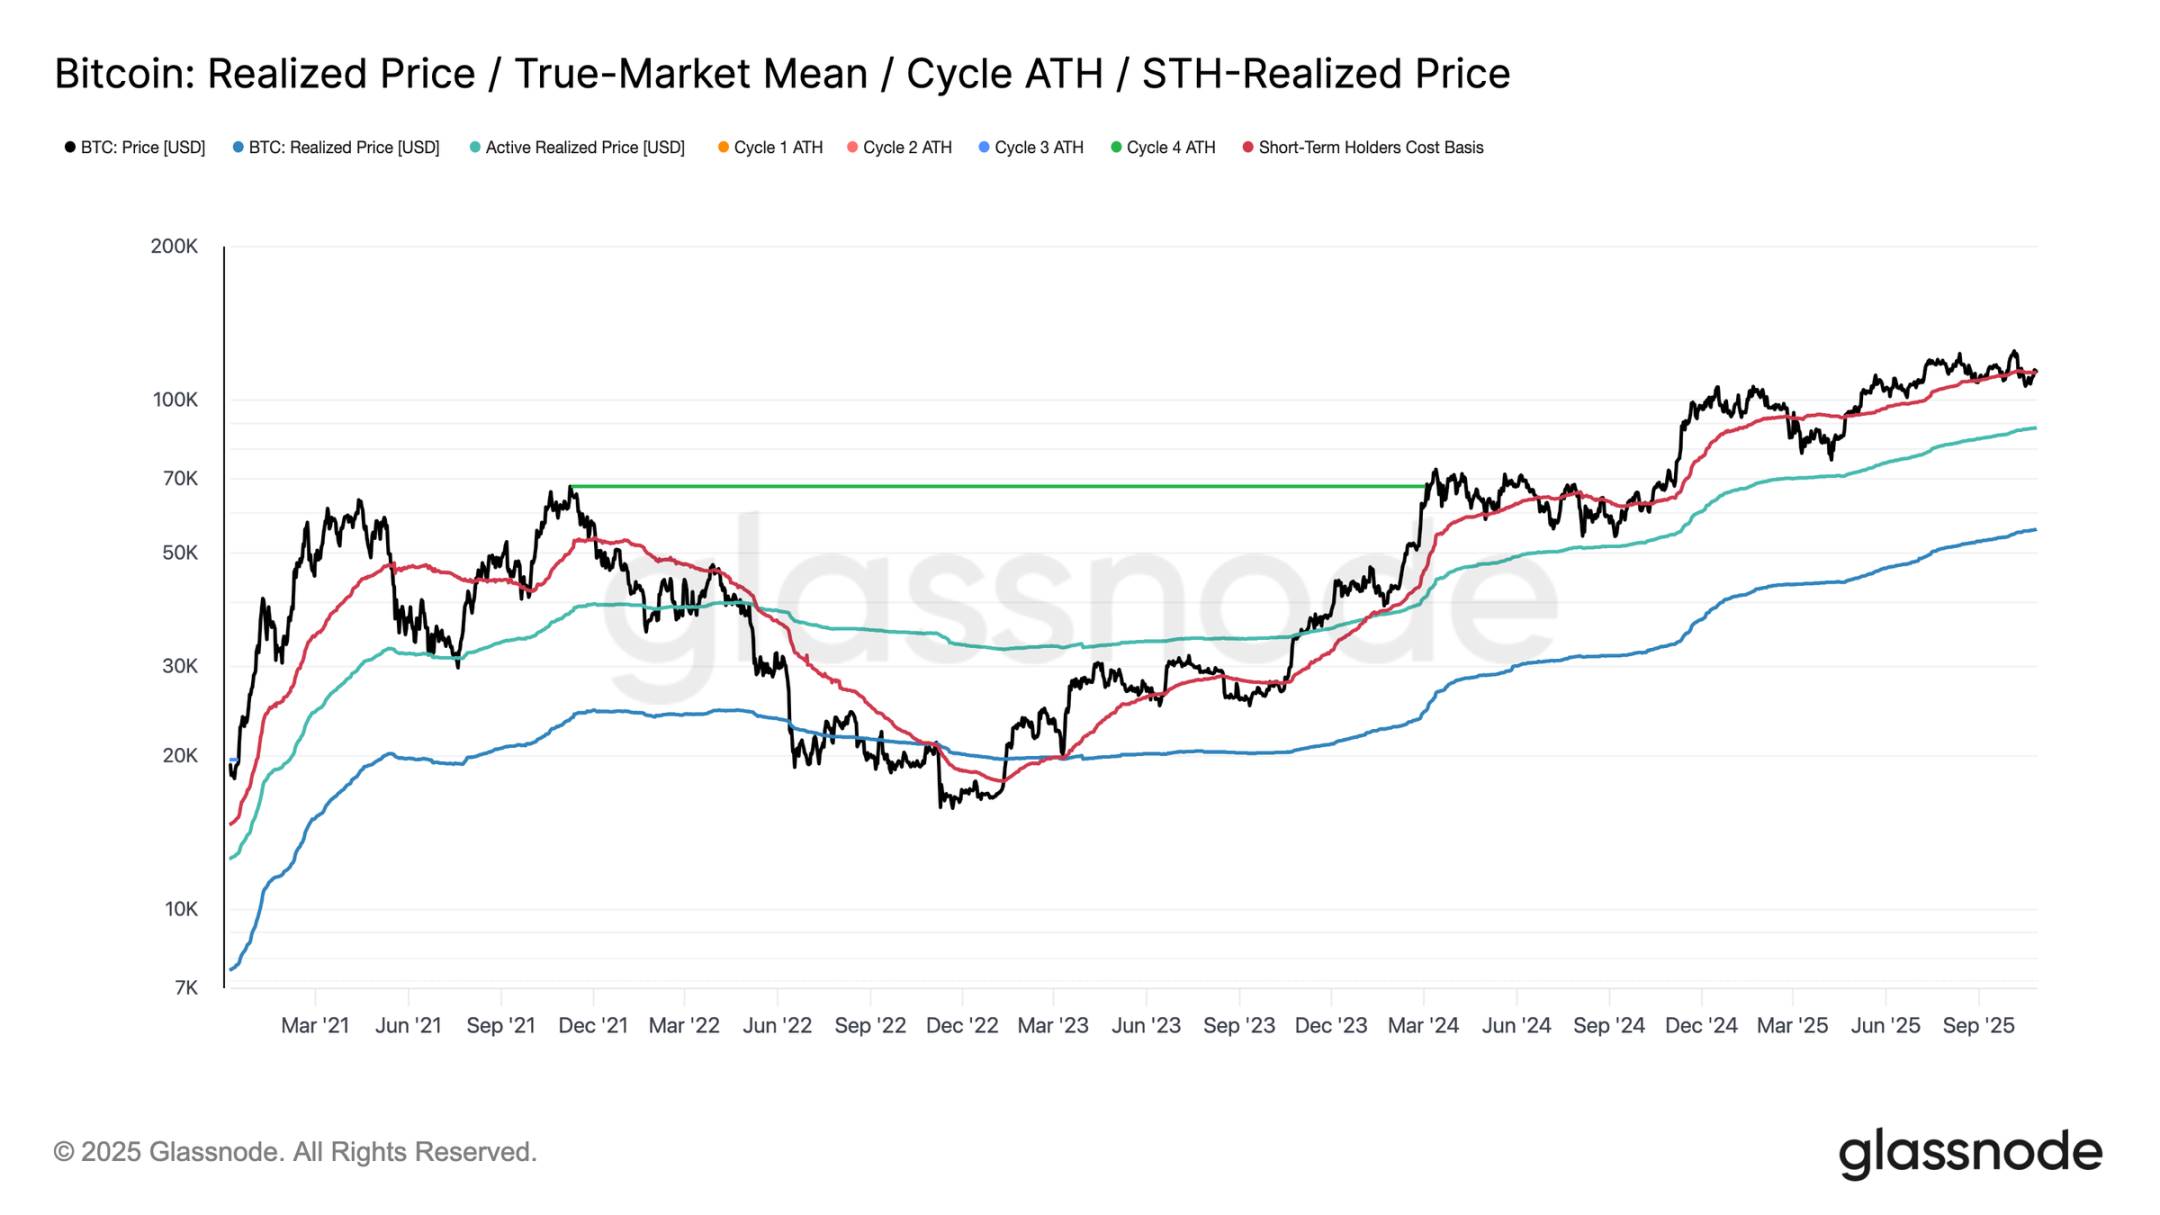
Following the weekend rebound, Bitcoin briefly reclaimed the ~$113,000 level near the short-term holder cost basis, typically viewed as a demarcation line between bullish and bearish momentum. Sustaining above this threshold usually indicates sufficient demand to absorb ongoing selling pressure. However, failure to hold above it—especially after six months of trading higher—suggests weakening demand.
Over the past two weeks, Bitcoin has struggled to close weekly candles above this key level, increasing the risk of further weakness ahead. If this phase persists, the next major support lies near the active investor realized price of ~$88,000, a metric reflecting the cost basis of actively circulating supply and historically marking deeper correction phases in prior cycles.
Pressure on Short-Term Holders
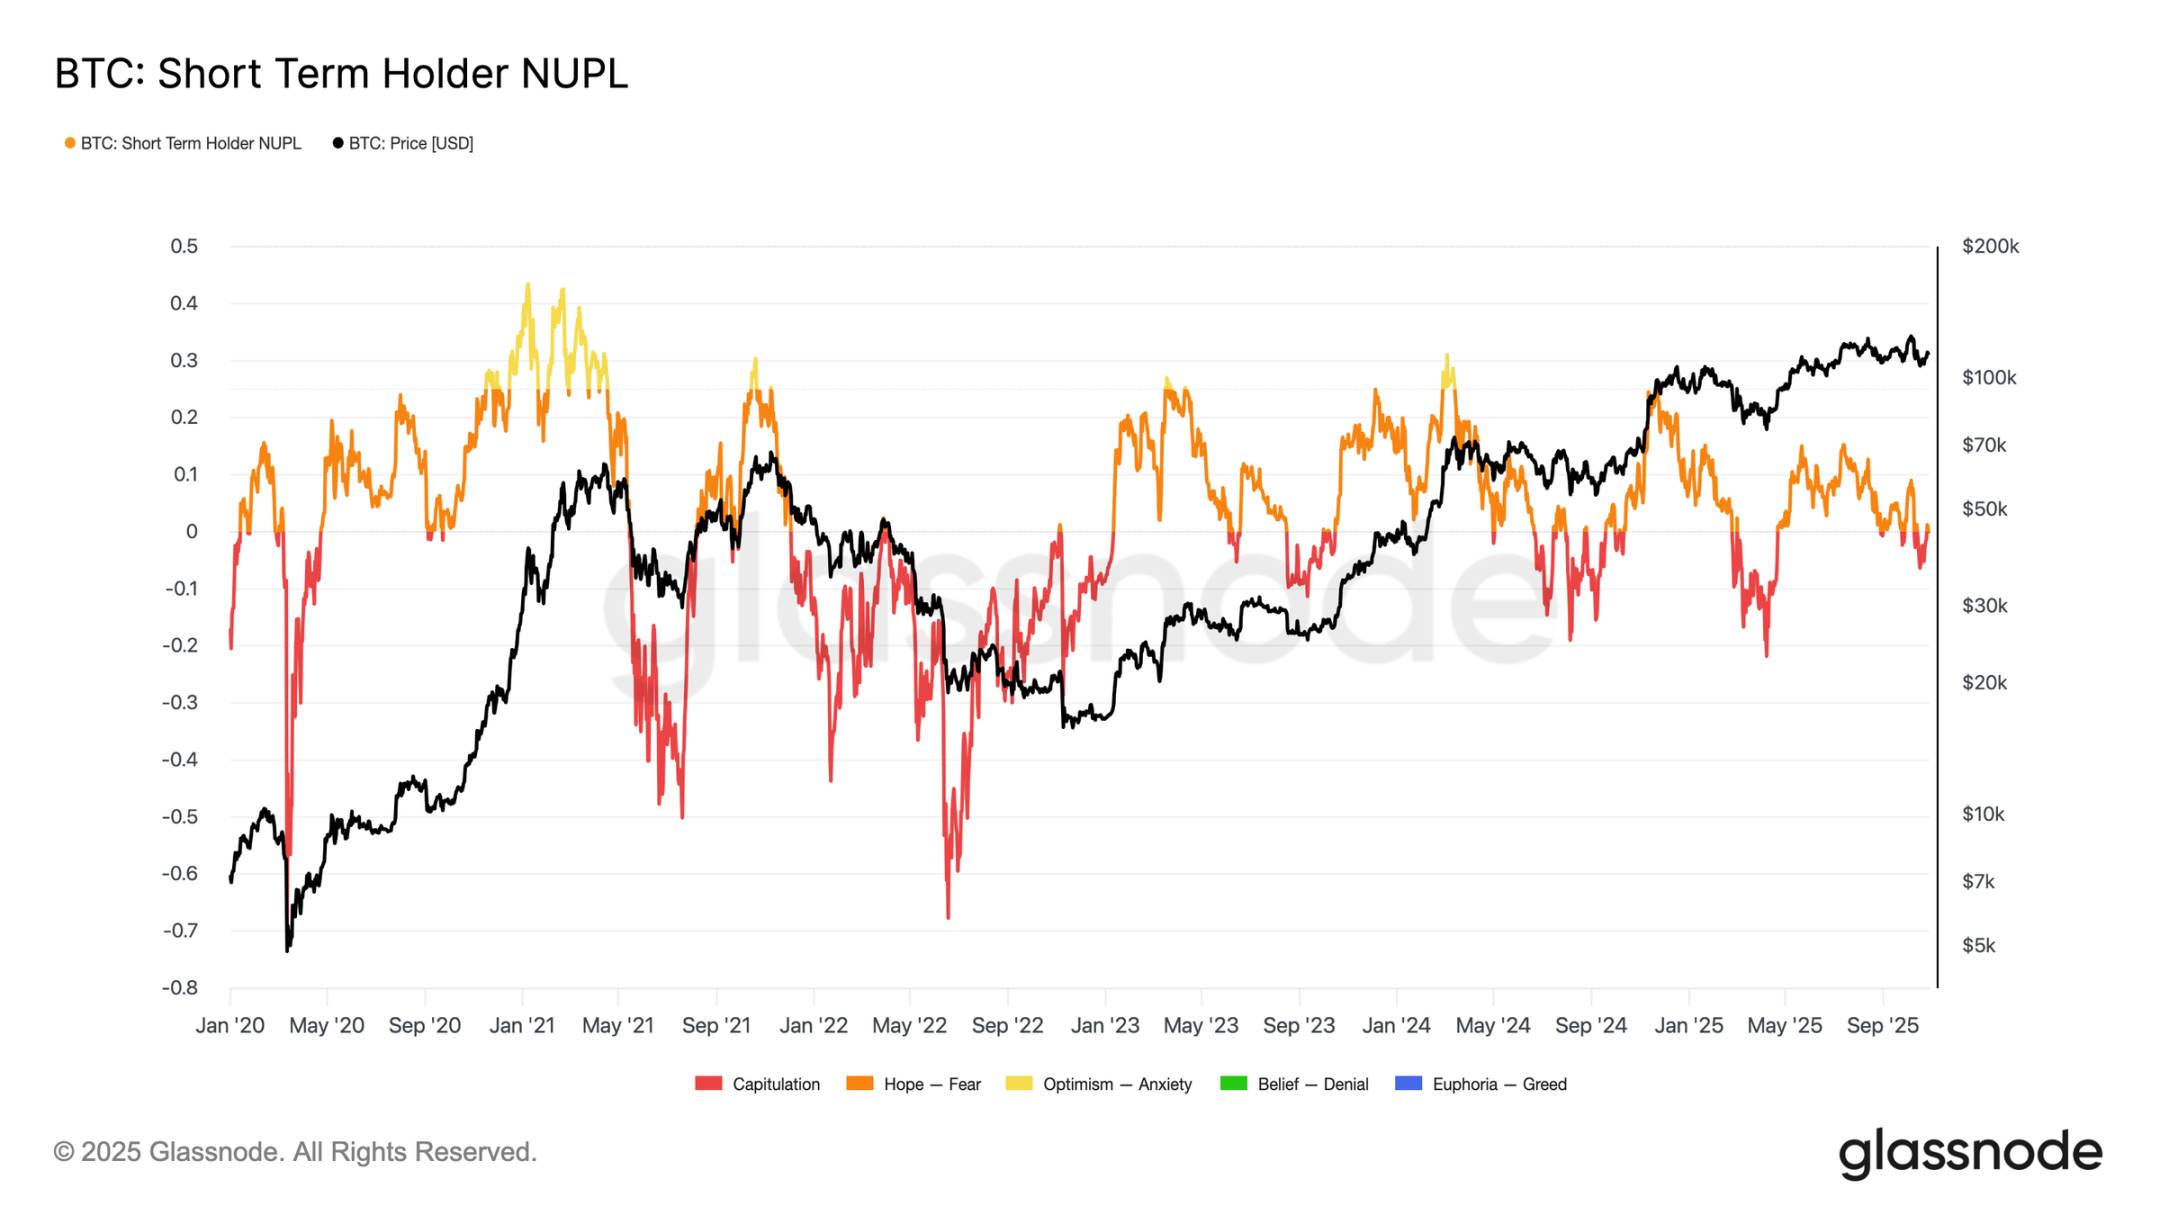
Extending analysis to investor sentiment, further market weakness is likely being driven by short-term holders—the top buyers now exiting at a loss. The Net Unrealized Profit/Loss indicator for short-term holders helps assess this pressure by measuring the proportion of unrealized profit or loss relative to market cap.
Historically, deeply negative readings coincide with capitulation phases preceding market bottoms. The recent drop to $107K pushed the short-term holder net unrealized profit/loss to -0.05—a mild loss compared to the -0.1 to -0.2 range typical during mid-cycle bull corrections, or values below -0.2 seen at deep bear market lows.
As long as Bitcoin trades within the $107K–$117K cluster of top buyers, the market remains in a delicate balance—not yet fully capitulating, but gradually turning against bulls as conviction erodes.
Long-Term Holder Selling
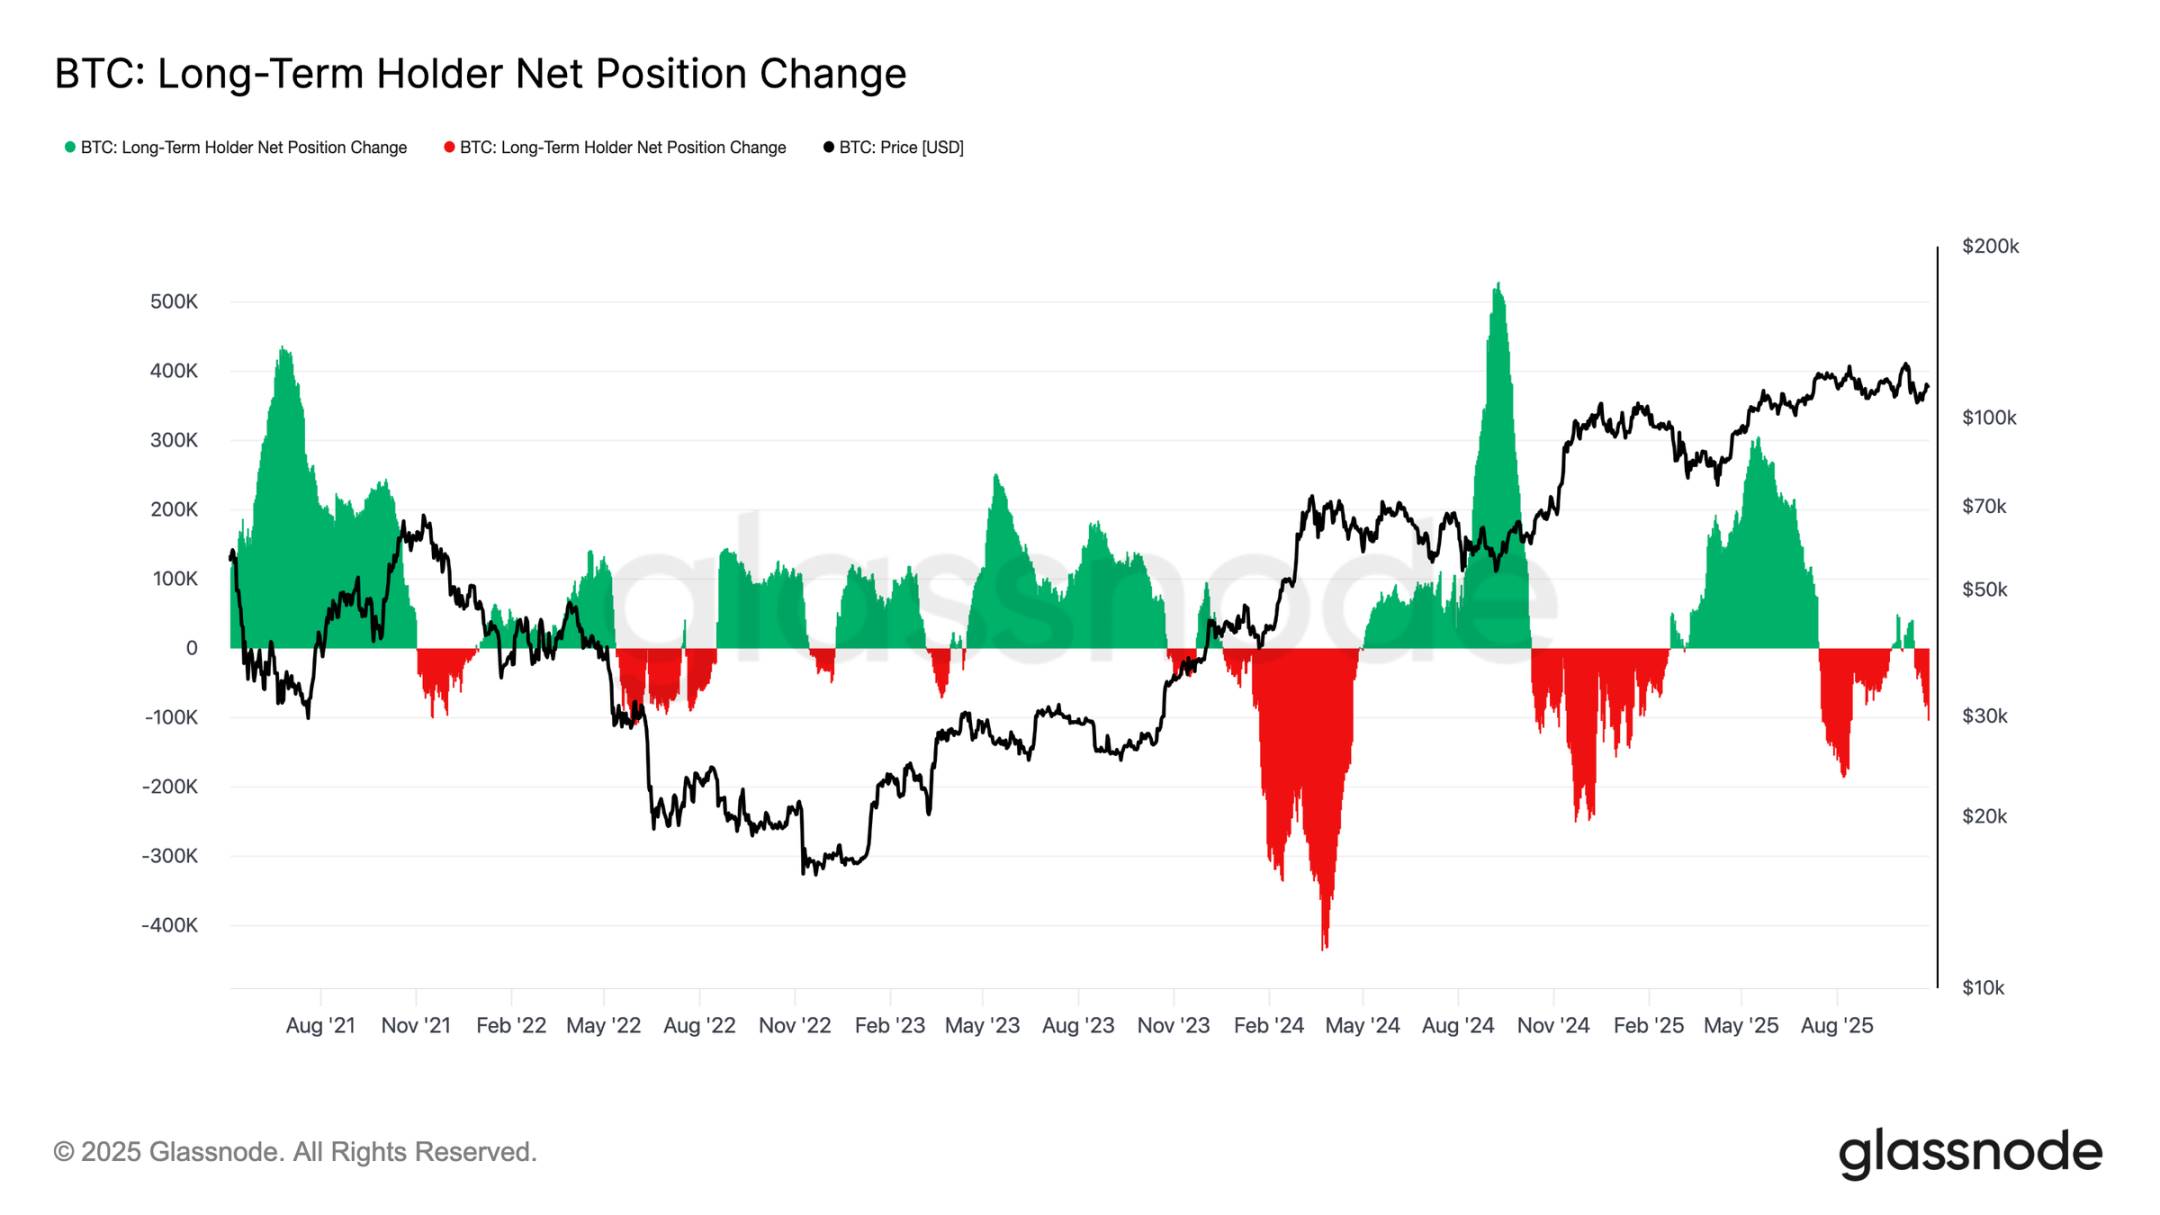
Consistent with prior observations, sustained selling by long-term holders continues to weigh on market structure. The Long-Term Holder Net Position Change has dropped to -104,000 BTC per month, marking the most significant wave of selling since mid-July.
This persistent selling pressure aligns with broader signs of market exhaustion, as experienced investors continue to realize profits amid weakening demand.
Historically, major market expansions only begin after long-term holders shift from net selling to sustained accumulation. Therefore, a return to net positive inflows within this group remains a key prerequisite for restoring market resilience and laying the foundation for the next bull phase. Until such a shift occurs, long-term investor selling will likely continue pressuring price action.
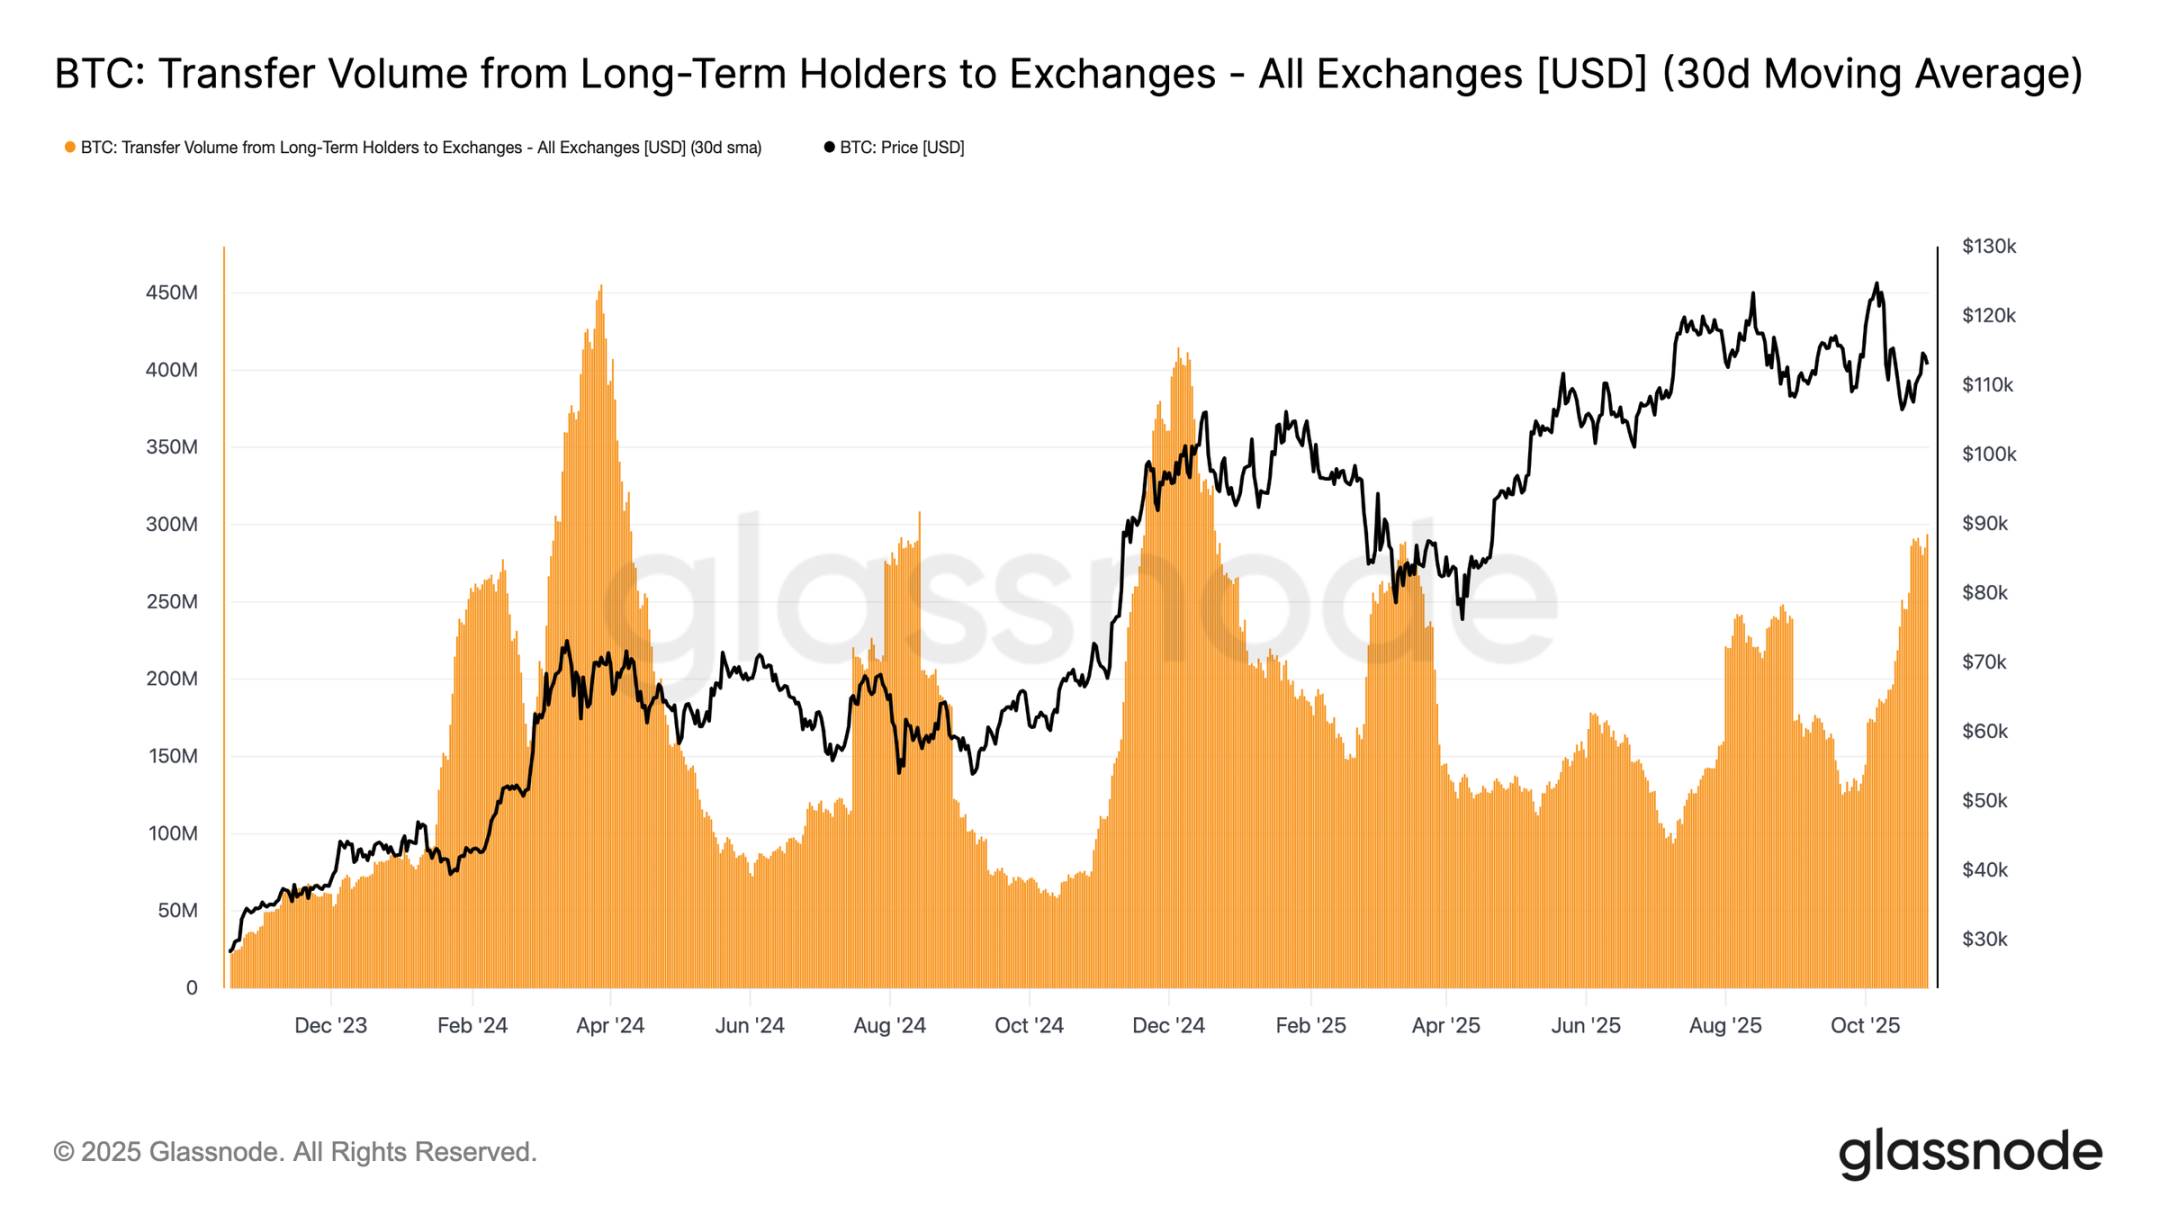
To gauge the intensity of long-term holder selling, we can examine transfer volume to exchanges by long-term holders (30-day simple moving average), which captures the value of tokens moved by experienced investors for potential sale. This metric has surged to approximately $293 million per day—more than double the baseline level of $100M–$125M prevalent since November 2024.
Such high transfer activity indicates continued profit realization by long-term investors, adding sustained sell-side pressure. The current pattern closely resembles August 2024, a period marked by aggressive spending from long-term holders as price momentum slowed. Unless this flow subsides, spot demand will struggle to absorb ongoing selling, leaving the market vulnerable to further cooling in the coming weeks.
Off-Chain Insights
Options Market Cooling Down
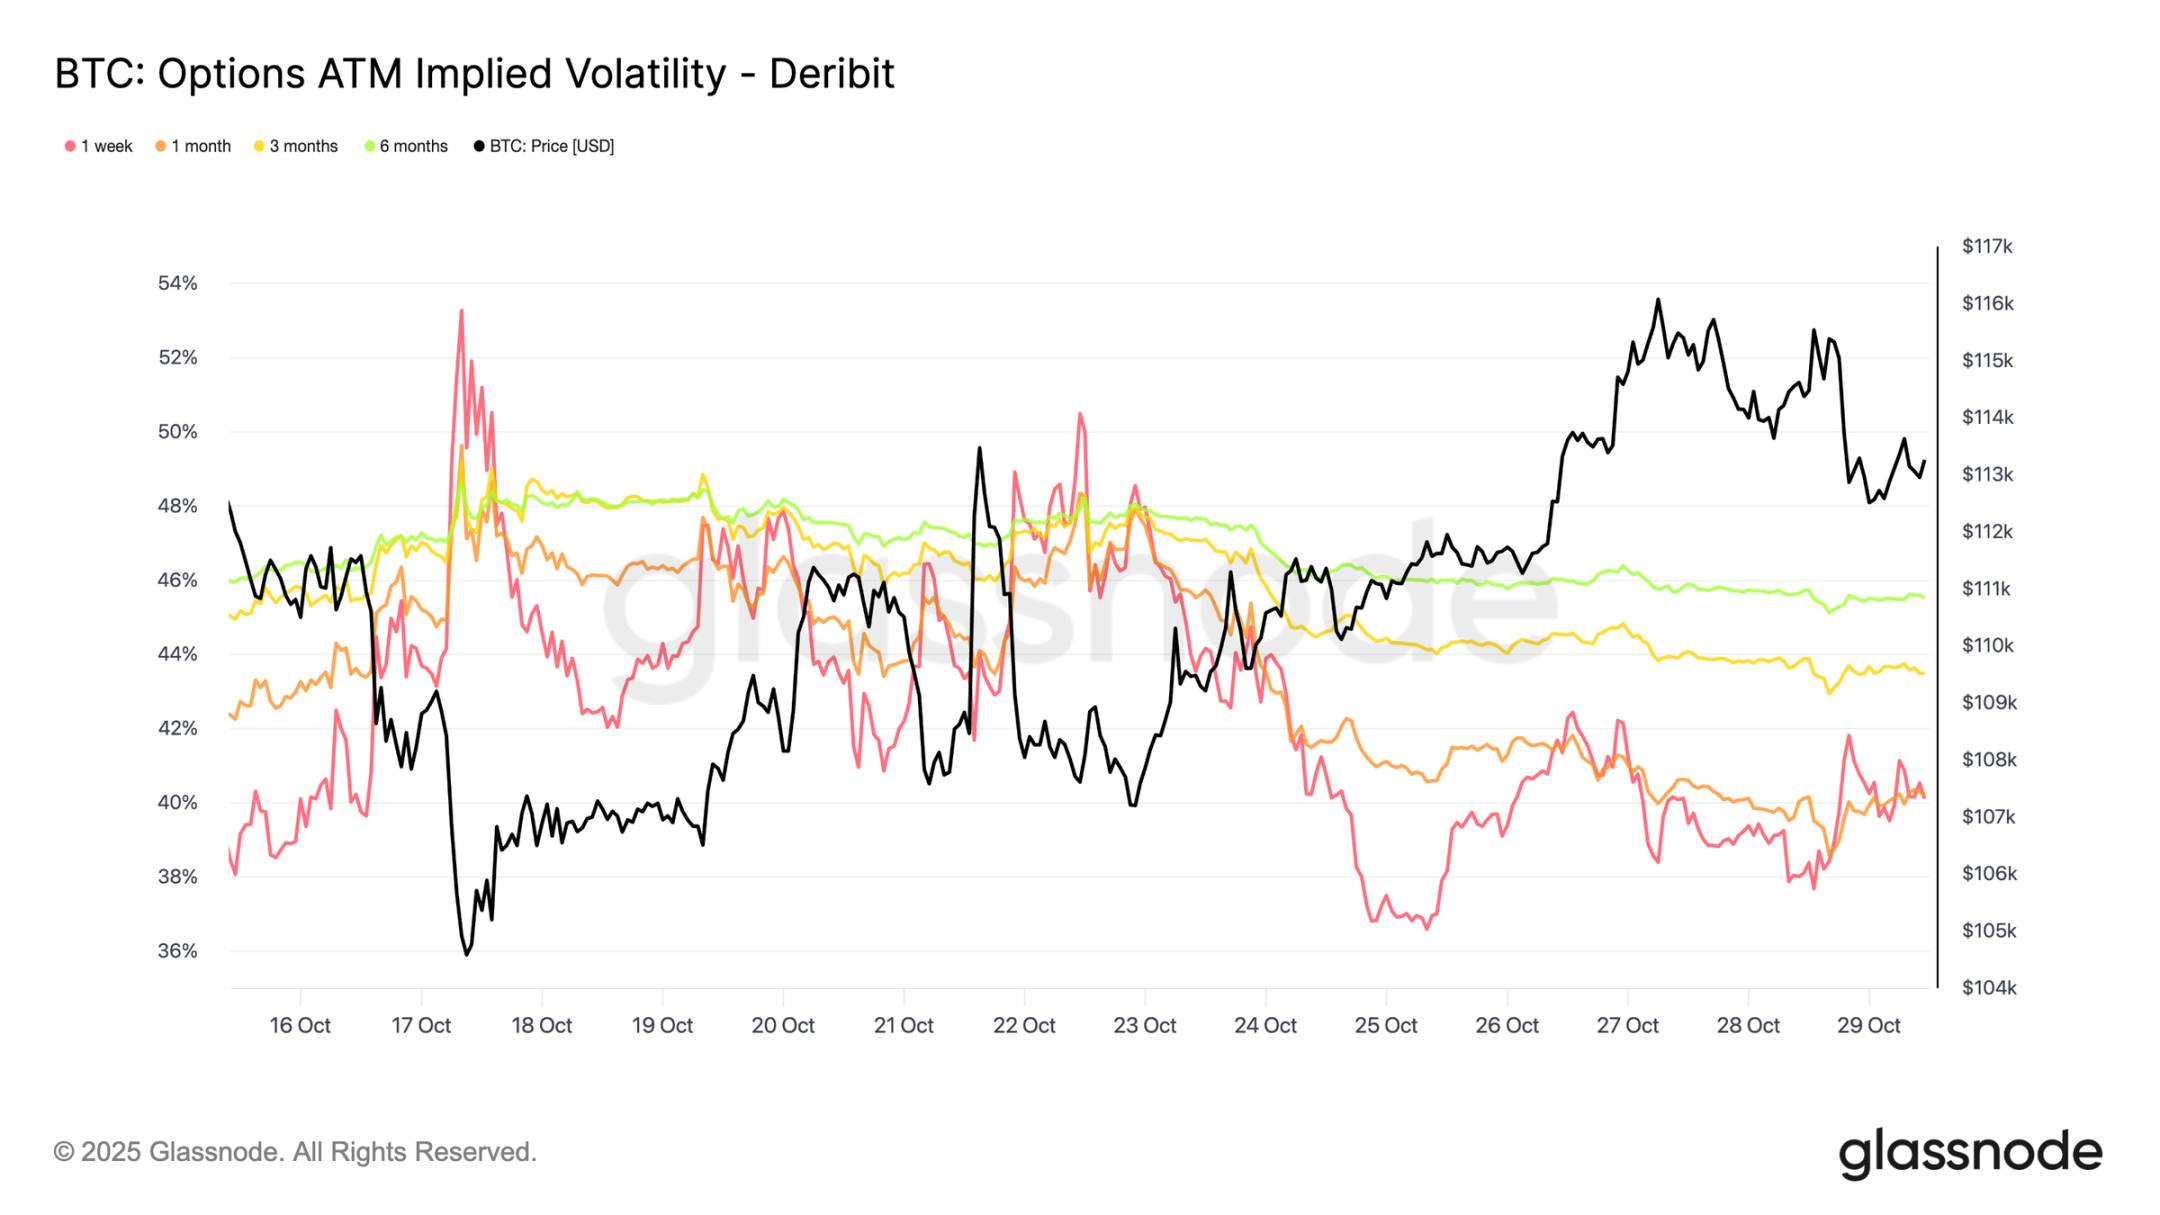
Turning to the options market, recent data shows continued relief in volatility pressure following the October 10 crash. Bitcoin’s 30-day realized volatility has declined to 42.6%, slightly down from last week’s 44%, reflecting calmer price action. Meanwhile, implied volatility—which reflects trader expectations—has fallen more sharply, as participants unwind downside hedges and reduce protection demand.
Shorter-dated contracts have seen the largest adjustments, with 1-week at-the-money implied volatility dropping over 10 vol points to around 40%, while 1-month to 6-month tenors slid only 1–2 points, remaining near mid-40% levels. This flattening of the term structure suggests traders expect fewer near-term shocks.
The curve also implies a gradual rise in expected volatility to around 45% over the coming months, rather than a sharp spike.
Skew Resets Lower
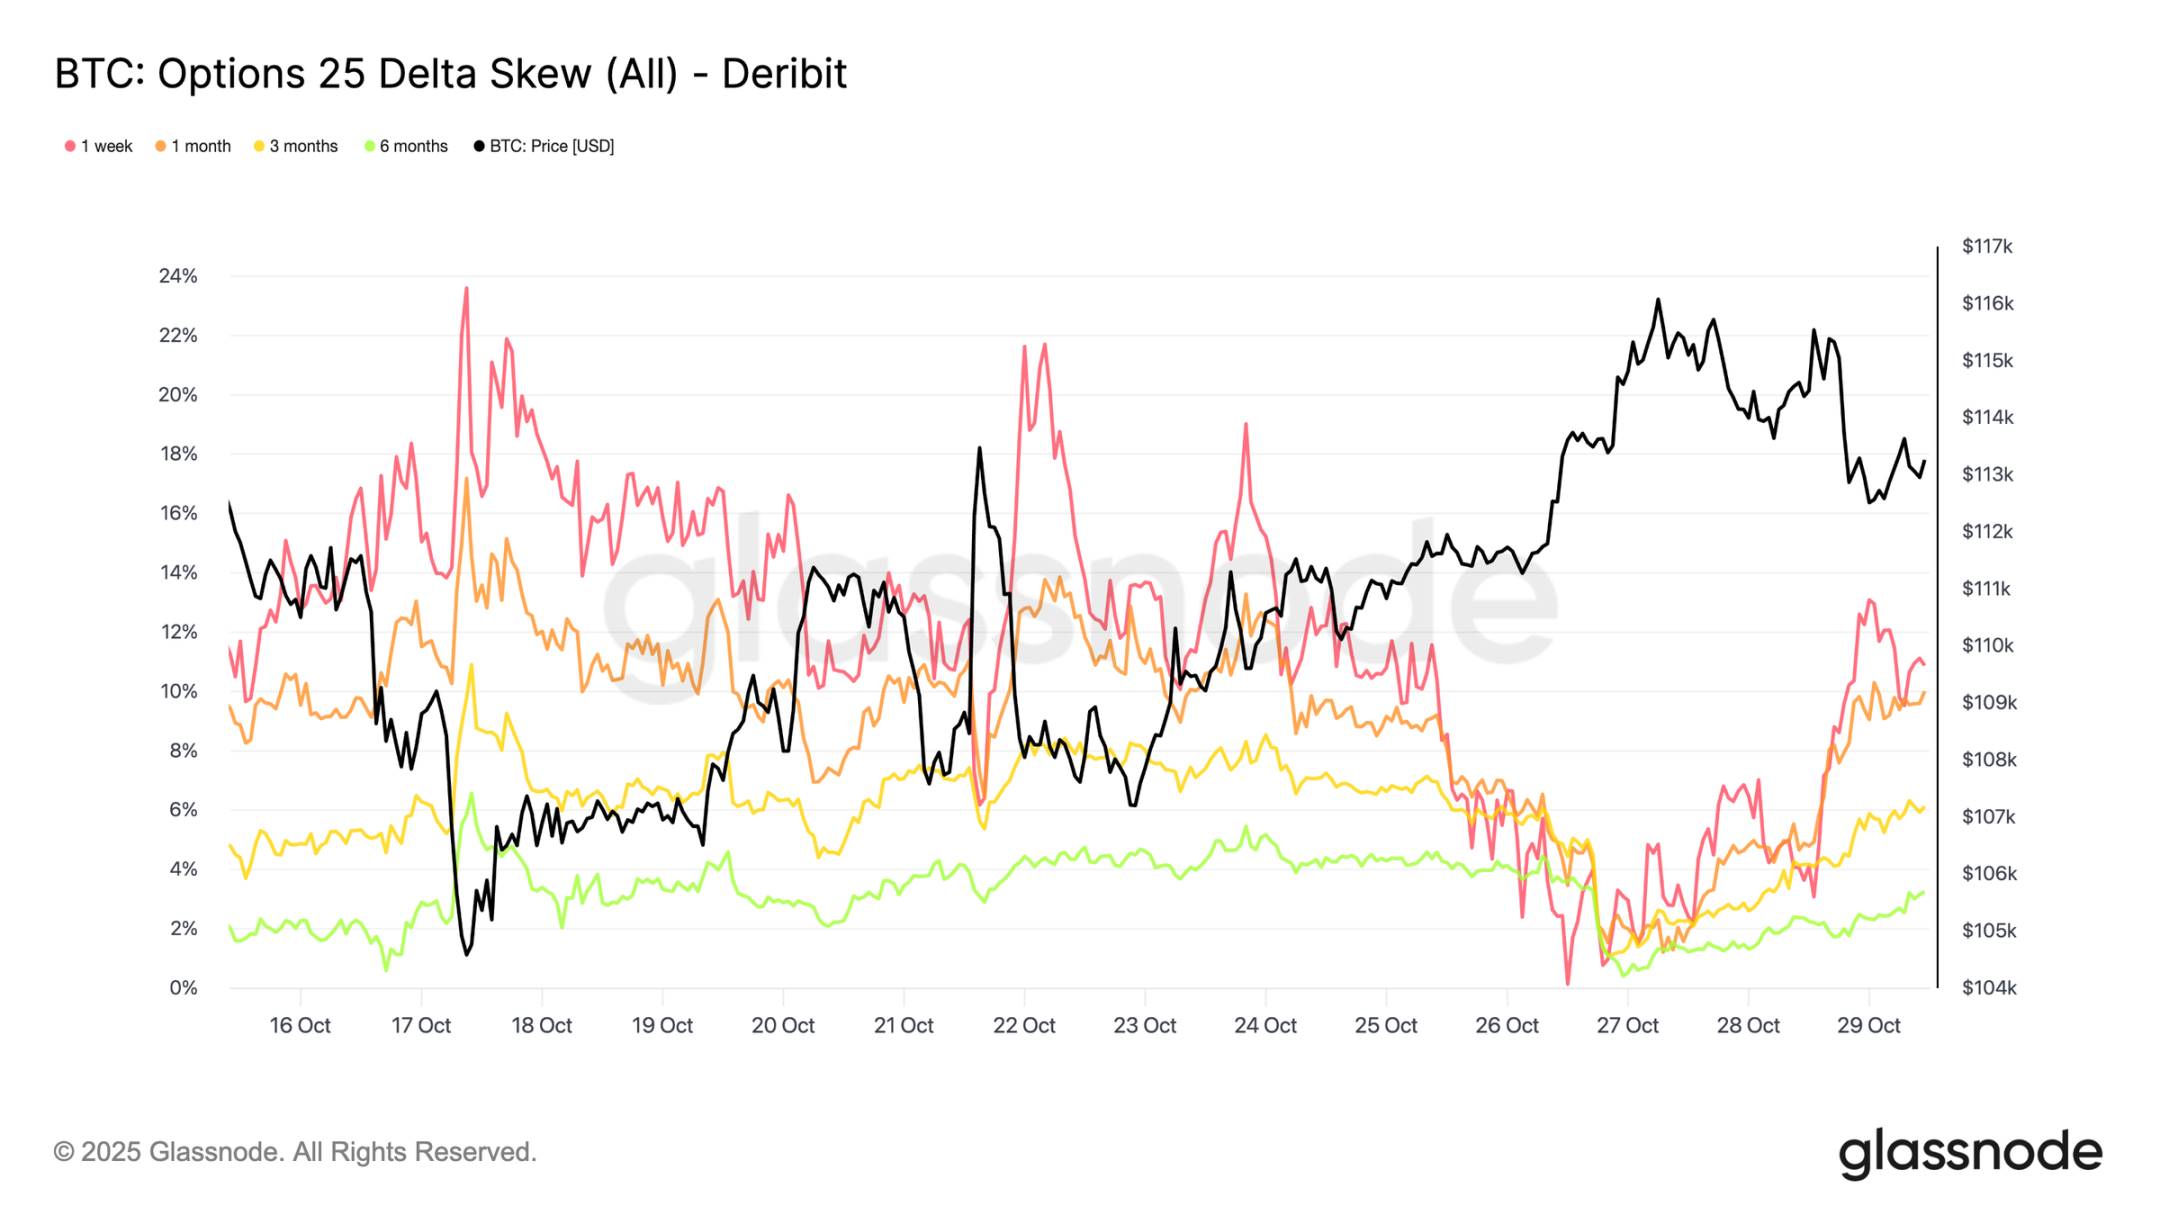
The easing in implied volatility has also translated into a significant shift in 25-Delta skew, a metric measuring the relative cost of puts versus calls. Positive skew indicates premium pricing for put options. After the October washout, 1-week skew spiked above 20%, signaling intense demand for downside protection. Since then, it has collapsed to neutral levels, with only a slight bounce-back and far weaker intensity.
Longer-dated contracts, such as 1-month and 3-month tenors, have also reset sharply, showing only modest put premiums. This shift indicates traders have removed much of their downside hedging. Positioning is now closer to "modestly bullish / two-way" rather than "panic lows," consistent with the broader stabilization seen in Bitcoin’s recent price action.
Selective Bullish Positioning
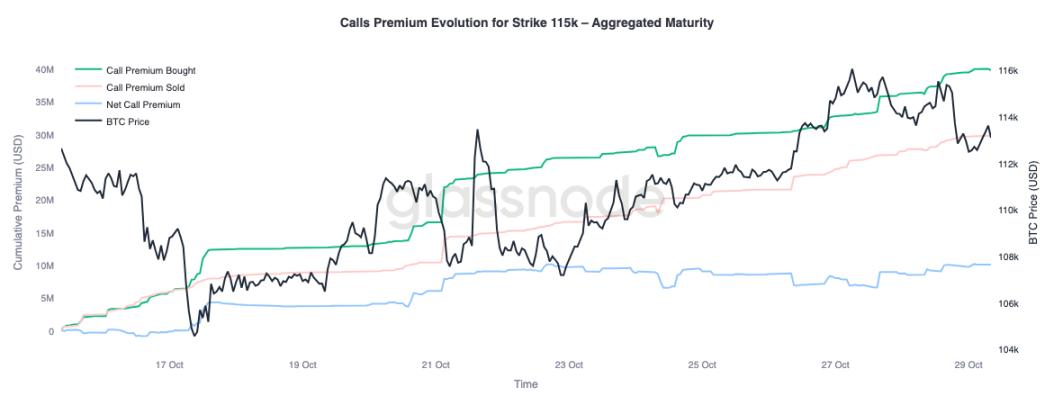
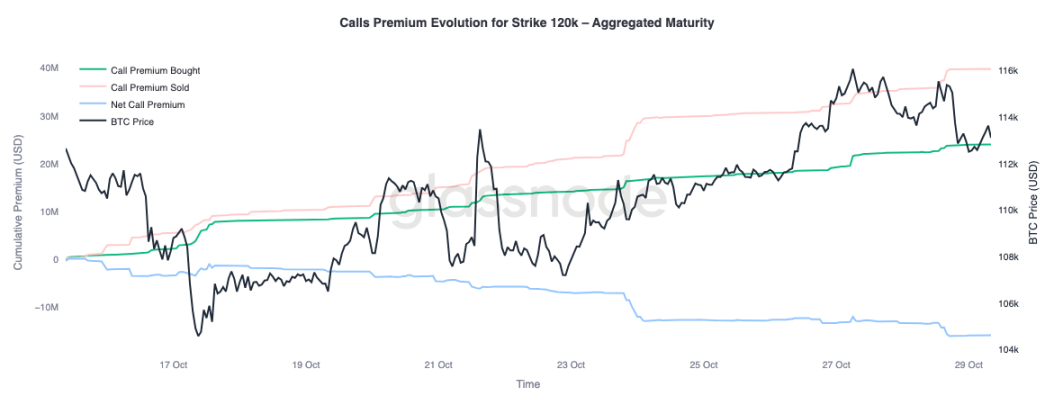
With skew normalizing, attention turns to where traders are allocating premium. Call option activity now varies significantly by strike price. At the $115K strike, net call premium remains positive, indicating traders continue paying for near-term upside exposure amid the recent price recovery. In contrast, at the $120K strike, written call premium exceeds bought calls, resulting in negative net premium.
This setup reflects a stance of "mild rebound, not full breakout." Traders are willing to pay for gains closer to the current spot price but are financing these positions by selling calls at higher strikes. The resulting call spread structure suggests cautious optimism—seeking participation in further upside, but lacking confidence in a full retest of all-time highs.
Market Pricing in Controlled Pullback
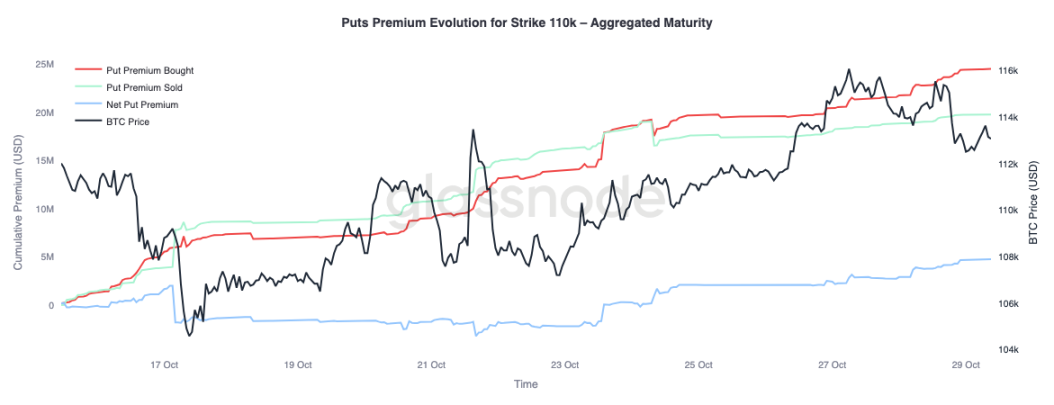
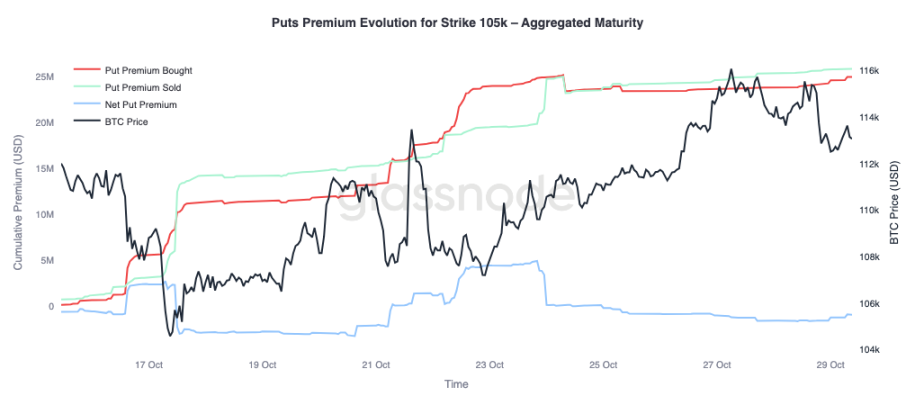
To complete the picture, we can examine the put side of the market. Since October 24, traders have been buying $110K put options as Bitcoin rose, indicating demand for near-term downside protection. At the same time, $105K puts have been more aggressively sold, suggesting participants are willing to collect premium by providing insurance at that deeper strike.
This contrast highlights a market expecting a shallow pullback rather than another major liquidation wave. Traders appear to anticipate possible consolidation near current levels (hedged at $110K), but view a full break below $105K as less likely. Overall positioning supports the view that the worst of October’s deleveraging is behind us, and the market is now focused on range trading and volatility harvesting, rather than defensive hedging against another sharp sell-off.
Conclusion:
The on-chain landscape continues to reflect a market in correction and recalibration. Bitcoin’s failure to sustain above the short-term holder cost basis highlights fading momentum and persistent selling pressure from both short- and long-term investors. Rising long-term holder sell volumes and high exchange transfer activity underscore a phase of demand exhaustion, suggesting the market may require an extended consolidation period to rebuild confidence. Upward recovery is likely to remain constrained until long-term holders resume accumulation.
Turning to the options market, front-end implied volatility has sharply declined, skew has normalized, and option flows now reflect constrained upside exposure and measured downside hedging. Structurally, the crypto options market appears to be transitioning from crisis mode to rebuilding mode, signaling improved stability.
However, the next major catalyst looms ahead—the Federal Reserve meeting. Rate cuts are largely priced in, meaning a dovish outcome would likely keep volatility subdued and skew balanced. Conversely, if the Fed delivers a smaller cut or maintains a hawkish tone, short-term implied volatility could surge again, and 25-Delta skew could widen as traders rush to repurchase protection. Essentially, the market’s current calm is conditional—stable for now, but fragile should the Fed deviate from expectations.
Join TechFlow official community to stay tuned
Telegram:https://t.me/TechFlowDaily
X (Twitter):https://x.com/TechFlowPost
X (Twitter) EN:https://x.com/BlockFlow_News