Beyond TVL: What Are the True Value Metrics for Lending Protocols?
TechFlow Selected TechFlow Selected
Beyond TVL: What Are the True Value Metrics for Lending Protocols?
Key success metrics for the lending market: loan volume and supply of underlying assets.
Author: jake (帅哥杰克)
Translation: TechFlow
The metrics for DeFi have failed, and most of us haven't noticed.
Today, we’ll re-examine this metric from the perspective of lending.
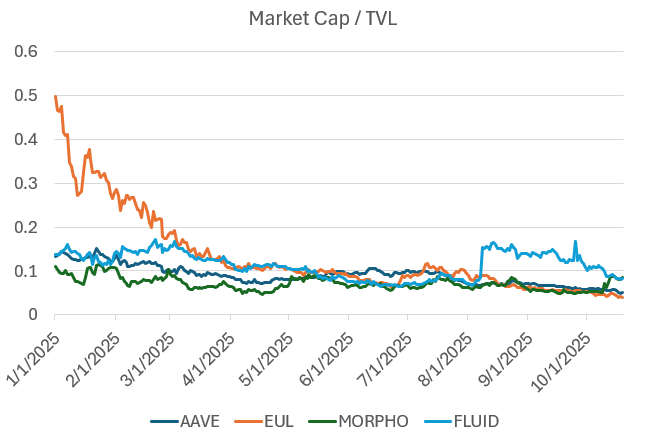
The ratio between lending markets and TVL
As seen here, TVL (Total Value Locked) is commonly used as a benchmark to evaluate lending protocols. However, through conversations with most major DeFi lending teams, we’ve found that TVL obscures more than it reveals, leading risk assessors to incorrect conclusions.
Below are our attempts and findings in moving beyond surface-level growth to explore the core mechanics of DeFi systems:
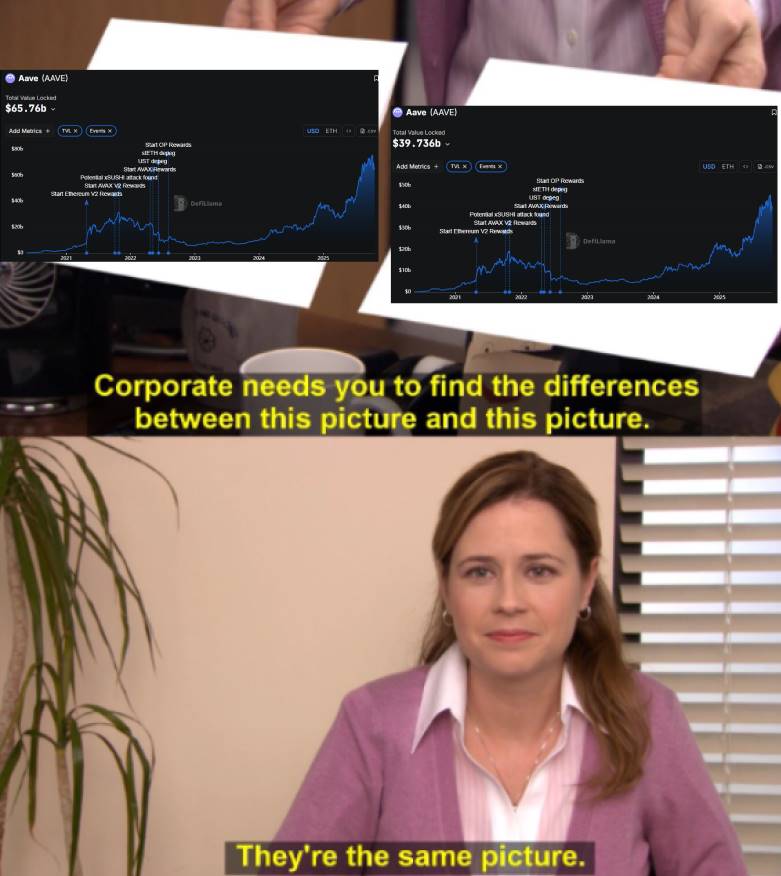
TVL is a poor metric for measuring lending
In 2019, we adopted TVL as a standard. When experimenting with early DeFi protocols (such as Maker, Compound, Uniswap, Bancor, etc.), Scott Lewis and the Defi Pulse team invented TVL to compare different protocols—like comparing apples to oranges. At the time, when only xyk AMMs (constant product automated market makers) existed in the market, TVL was a decent metric. But as the industry matured and we began optimizing capital efficiency (e.g., Uniswap v3, Pendle & Looping, Euler, Morpho, etc.), TVL’s usefulness diminished.
In other words, our design space has shifted from “can we do it” to “how well can we do it”; yet TVL only tracks the former. Clearly, today we need better metrics to measure the latter.
A problem with TVL in lending lies in its ambiguous definition, which may refer to one of two cases:
-
Total supplied capital, regardless of borrowing rate. If $1 billion in capital is deposited into a protocol, the protocol's TVL will show $1 billion, regardless of whether any funds are borrowed.
-
Total supplied capital minus borrowed amount. If $1 billion in capital is deposited and $500 million is borrowed, the protocol’s TVL will show $500 million.
This definitional ambiguity leaves risk assessors confused. Even within these two scenarios, "TVL" may represent entirely different capital bases.
Moreover, both definitions are flawed and fail to reflect the actual health of a protocol:
-
Total supply: Fails to indicate how much actual lending activity the protocol facilitates.
-
Total supply minus borrowed: Does not reflect capital efficiency—it simply rewards idle capital.
An efficient lending protocol should effectively and at scale match lenders and borrowers, but current TVL definitions fail to capture this dynamic.
At best, TVL only gives risk assessors a vague sense of “scale.”
Lending platforms were once used for leveraged trading and risk exposure management, but that has changed.
Lending markets were historically used primarily for leveraged long/short positions. However, with the emergence of Hyperliquid—a KYC-free perpetual futures exchange with reduced counterparty risk—perpetual contracts have become the preferred tool for expressing directional views.
Additionally, lending markets tend to avoid adding lower-rated assets, while decentralized perpetual exchanges compete on who can list such assets faster. For traders, eliminating the need for manual leverage operations and gaining quicker access to new assets represents a significant improvement in user experience.
For comparison, let’s revisit Aave’s asset usage during its early stage—the top assets near the end of the last cycle.
Top Aave Assets (April 26, 2022):
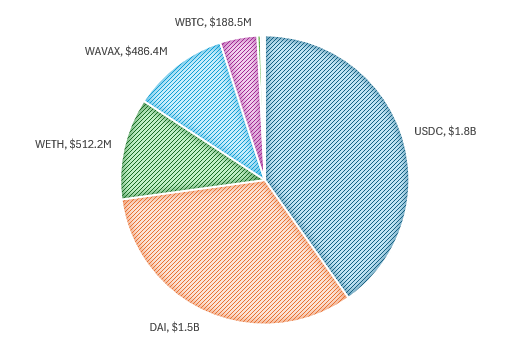
The usage pattern at the time was relatively straightforward:
-
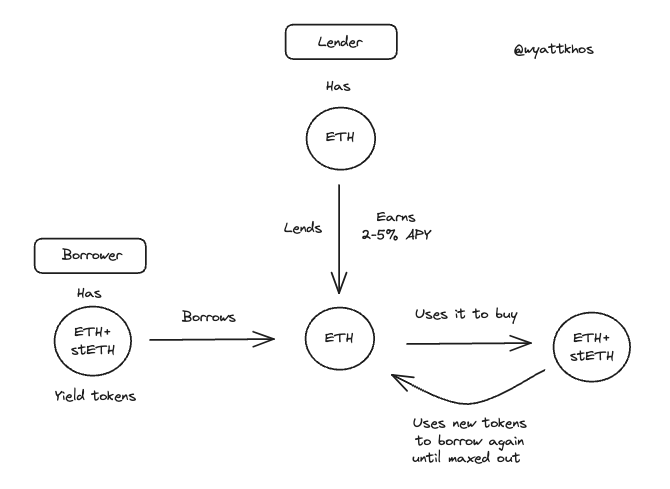
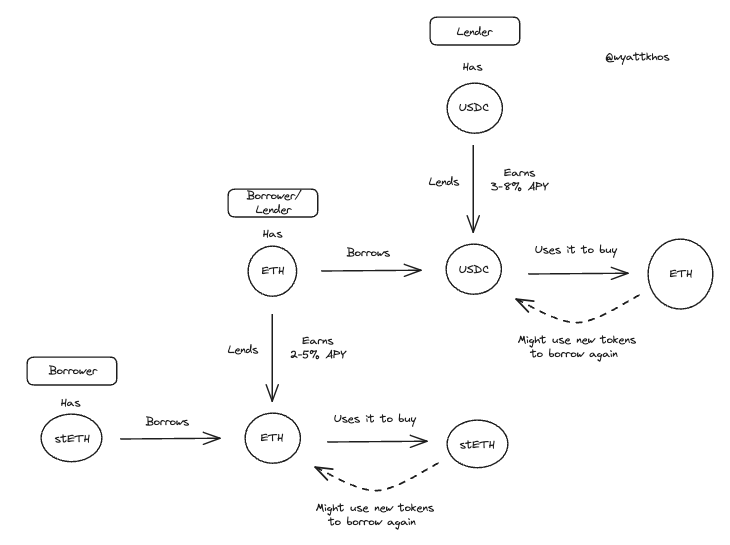
Lenders: Supplied stablecoins (mainly USDC and DAI) to earn yield, typically between 3%-8% APY depending on market conditions.
-
Borrowers: Used blue-chip assets (like BTC or ETH) as collateral to borrow stablecoins, either reinvesting while maintaining exposure or leveraging up to buy more of the same asset.
Typical early Aave user flow:
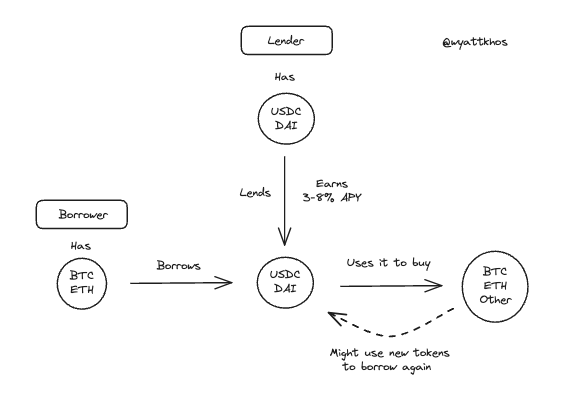
This pattern still exists, but no longer dominates. Perpetual contracts have become a competitive alternative for taking leveraged long/short positions using collateral, pushing lending markets toward other use cases.
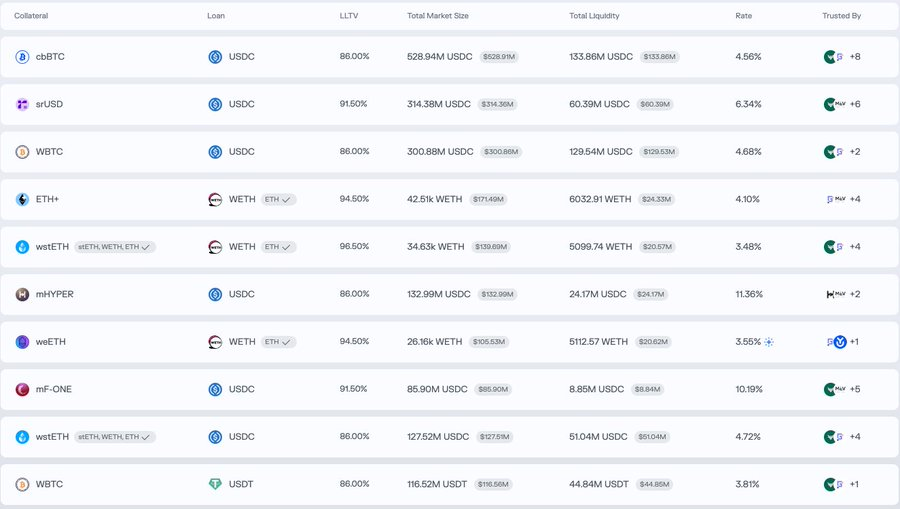
To understand current lending market usage, consider leading markets on Morpho. Beyond BTC markets (like cbBTC and WBTC), the main pairs show different activity patterns—more focused on yield or liquidity optimization rather than directional leverage:
-
Deposit ETH+, borrow WETH
-
Deposit wstETH, borrow WETH
-
Deposit mHYPER, borrow USDC
-
Deposit mF-ONE, borrow USDC

From these examples, we draw the following conclusions.
Yield looping is now the dominant use case in DeFi lending markets
In the Morpho example above, users deposit a yield-bearing asset, borrow its non-yielding counterpart, then use the borrowed funds to purchase more of the original yield-bearing asset—repeating this process to amplify returns.
Here are some real-world looping trade examples:
-
ETH - stETH loop
-
sUSDe/mHYPER - USDC loop
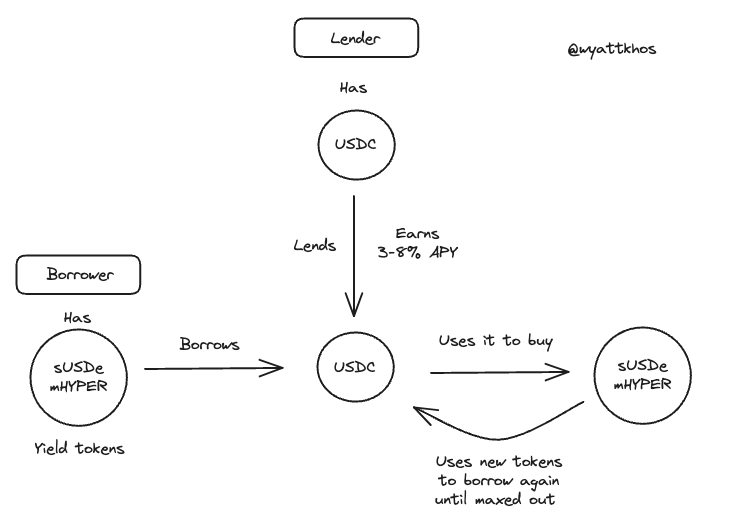
Ethena’s USDe has been a key driver behind the recent surge in yield-looping strategies. These trades are now so common they mainly rely on Aave and Pendle, though they can be replicated with other yield-bearing assets. The sustainability of such strategies depends directly on the quality and stability of the underlying yield. As @shaundadevens clearly described in an August tweet, this market behavior is well understood.
These looping strategies typically combine three components:
-
A yield-generating “stablecoin”
-
Pendle, for yield stripping
-
A lending market, for leverage
However, the scale of these trades is constrained by two key factors:
1 - Liquidity of the underlying asset
There must be sufficient stablecoin liquidity available for borrowing.
2 - Strategy yield must exceed borrowing cost
If borrowing costs approach or exceed base yield, the strategy collapses. Therefore, any new looping strategy must generate yields higher than USDe. Why? Because as shown below, USDe’s yield has effectively become the cost of capital in DeFi, i.e., the risk-free rate. Similarly, ETH’s risk-free rate usually tracks the most reliable ETH yield sources (e.g., staking rewards).
The impact of these related rates on DeFi’s design space cannot be underestimated.
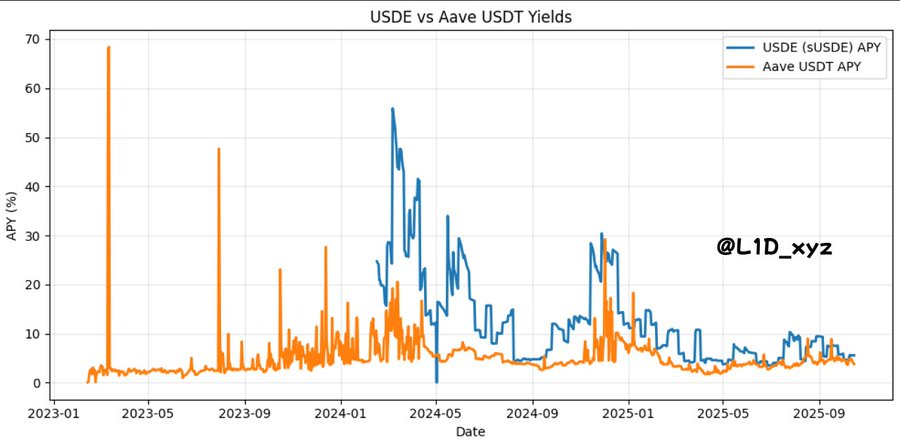
As revealed by @TraderNoah
In other words—though some may find it hard to accept—for now, USDe’s yield can be viewed as our industry’s “Treasury yield.”
There’s a deeper implication here: our digital “nation” is built on speculation, so our “Treasury yield” should naturally also be a proxy for speculation, derived from the yield of underlying trades.
As long as lending protocols maintain ample supply of “base assets” (stablecoins like USDC, USDT, and DAI, and base assets like ETH and wBTC), the “looping” model can drive rapid TVL expansion.
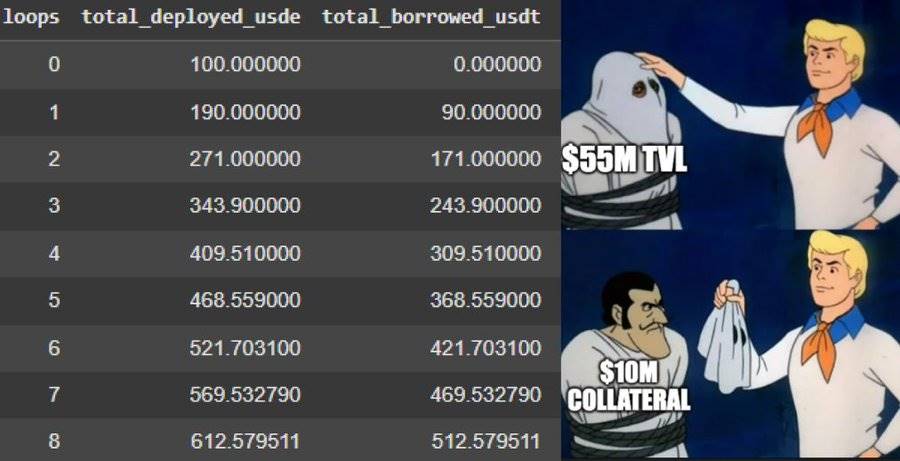
Yet this exposes a flaw in using TVL as a metric for lending protocols: borrowers deposit assets, borrow funds, and redeposit the borrowed capital. This process often repeats five to ten times, limited by loan-to-value (LTV) ratios. The result is artificially inflated TVL data: the protocol counts both the original deposit, the borrower’s initial deposit, and each subsequent redeposit during the loop.
Example: sUSDe - USDC loop (starting with $100)
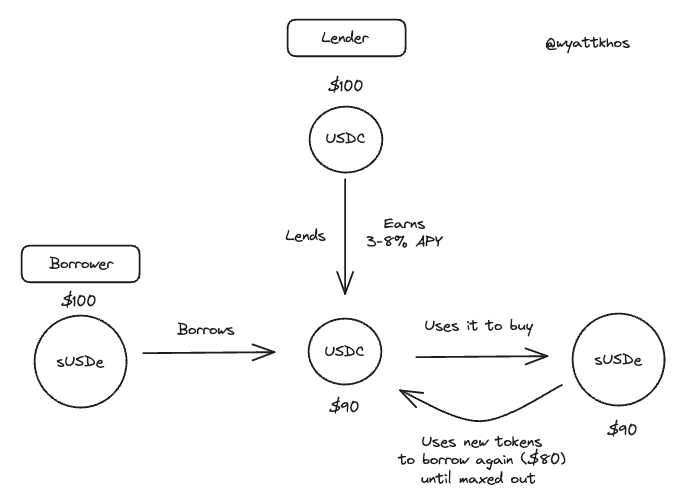
In this case, before the trade, the borrower contributes $100 worth of value to the lending protocol, equaling $100 TVL.
After the trade, when the borrower loops $100, the TVL becomes:
Nonetheless, TVL is merely a proxy for platform supply. But supply itself isn’t a strong metric. More importantly:
Key success metric for lending markets: Borrowed volume vs. base asset supply
Supplied assets that aren’t borrowed generate no income for the protocol—actual lending drives revenue.
As risk assessors, our job is to understand what drives revenue and where the bottlenecks lie. In lending markets, lending out assets via loans and fees powers the business, and the supply of base assets is the bottleneck.
After speaking with industry experts, we found that greater availability of base assets—especially stablecoins—is the core metric for lending market success.
“If we received $200 million in USDC today, it would be fully borrowed by tomorrow.”
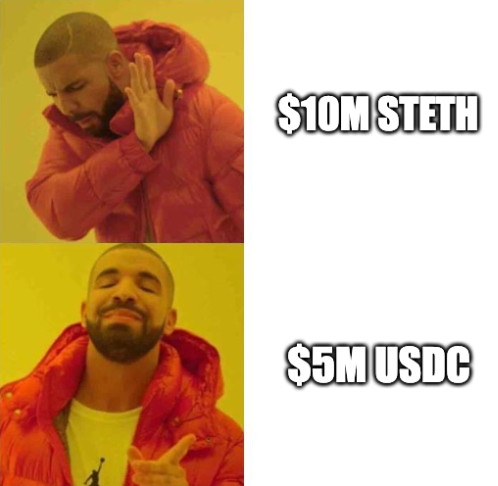
Therefore, deep supply dominated by USDC, along with supply of other assets like ETH and large staked assets, represents the primary value lending markets offer—and what users seek. More stablecoins mean more looping, leading to more activity and fees. If lending markets attract more base assets, they can facilitate more lending matches, attract more users, earn more revenue, and so on.
Conversely, long-tail assets contribute little to lending markets, adding mostly complexity and risk. While they might attract users less sensitive to fees, “there’s no such thing as a free lunch.”
How to attract more base assets?
The answer: Better distribution mechanisms and higher yields on base assets
What creates higher yields on base assets?
This comes down to how borrowers generate yield and what yield levels are considered “safe” in the market.
In many modern lending markets, assets used as collateral by borrowers (e.g., sUSDe used to borrow USDC) can also serve as lendable capital, reused by another user. Depending on the nature of the collateral, it may be useful to others (e.g., ETH) or useless (e.g., stETH).
For example, on Euler, we see very high utilization rates for major base stablecoins (like RLUSD, USDC), while long-tail yield-bearing derivative assets see almost no borrowing activity.
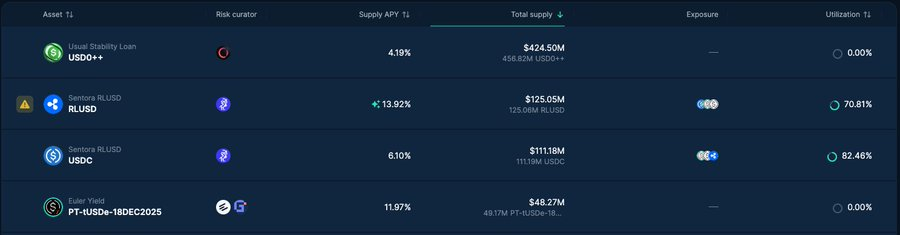
If the proportion of long-tail tokens relative to base assets is too high in a lending market, it suggests there’s more useless capital overall, possibly indicating “liquidity mining” or incentivized idle liquidity.
So, how can protocols become more efficient in their asset supply, lending activity, and preferred trades?
Why asset re-hypothecation (re-collateralization) matters
In lending markets, certain asset pairs clearly have higher utility—or are more “attractive”—than others. Here are specific examples:
Suppose User 1 deposits stETH (staked ETH) to borrow ETH and buy more stETH. This is a reasonable and feasible trade, provided the user can borrow ETH at a rate below stETH rewards. However, it’s unlikely other users would want to borrow the stETH supplied by User 1. For the lending protocol, this trade makes sense, but in this case, that’s where it ends.
Now consider another scenario: User 2 deposits ETH to borrow USDC and uses the borrowed USDC to buy more ETH. This is far more “attractive” to the lending protocol. Why? Because User 1’s entire transaction chain can now directly utilize the ETH deposited by User 2. In other words, User 2’s action enables additional looping transactions. When base assets (like ETH or USDC) are scarce, User 2’s behavior allows the lending protocol to support two full looping cycles, whereas User 1’s only supports one.
Example lending flows for User 1 and User 2:
This is what truly drives “capital efficiency” and asset utilization. Generally, if a protocol can generate more trading activity between base assets—such as depositing BTC to borrow USDC, or depositing ETH to borrow USDC—it becomes highly valuable, as it enables layered activity atop the initial transaction.
The degree of systemic leverage is hard to measure, and that’s dangerous
To summarize, our most concerning finding is this: across all interconnected lending, chained transactions, and looping trades, it seems nearly impossible to accurately determine how much leverage is being used system-wide.
For example, if a protocol has $1 billion in stETH with a 75% LTV, the composition could be any of the following:
-
$500 million was originally deposited stETH, and another $500 million is borrowed funds.
-
$300 million was originally deposited stETH, and another $700 million is borrowed funds.
We lack good methods to determine the exact breakdown, so we can only guess: if a massive liquidation event or broad market downturn causes users to withdraw, how much of that asset would actually be sold off?

To our sharper readers—if you have solid methods for identifying systemic leverage levels, we’d love to hear from you.
Join TechFlow official community to stay tuned
Telegram:https://t.me/TechFlowDaily
X (Twitter):https://x.com/TechFlowPost
X (Twitter) EN:https://x.com/BlockFlow_News