Why Have Market Makers Become Drivers of Chaos Behind the Cryptocurrency Crash?
TechFlow Selected TechFlow Selected
Why Have Market Makers Become Drivers of Chaos Behind the Cryptocurrency Crash?
Market makers enjoy all the privileges of providing liquidity without bearing any responsibilities.
Author: YQ
Translation: TechFlow
In my previous three-part analysis of the October 10–11 cryptocurrency liquidation storm, I examined oracle failures, infrastructure collapse, and potential coordinated attack vectors. Today, I will focus on perhaps the most critical yet underestimated aspect: how market makers—entities meant to provide market stability—became the primary catalysts behind creating an unprecedented liquidity vacuum, turning what could have been a manageable correction into a $19 billion disaster.
Understanding Market Makers: The Gap Between Theory and Reality
Before analyzing the October crash, it's essential to understand the theoretical role of market makers. In traditional financial markets, market makers act as intermediaries, continuously providing bid and ask quotes for financial instruments. They profit from the spread between these prices while delivering a crucial service: liquidity.
Theoretically, the roles of market makers include:
-
Continuous price discovery: Maintaining two-way quotes that reflect fair market value
-
Liquidity provision: Ensuring traders can buy or sell at any time without significantly impacting prices
-
Volatility mitigation: Absorbing temporary supply-demand imbalances
-
Market efficiency: Arbitraging price differences across platforms to maintain uniform pricing
In cryptocurrency markets, market makers operate similarly but face unique challenges:
-
24/7 operation with no downtime
-
Liquidity fragmented across hundreds of exchanges
-
Extreme volatility compared to traditional assets
-
Limited regulatory oversight and obligations
-
Technical infrastructure required for high-frequency trading
Under normal conditions, this system functions relatively well. Market makers earn modest spreads while providing necessary liquidity. However, the events of October 10–11 revealed the consequences when incentives diverge from responsibilities.
Timeline of Liquidity Disappearance
During the October crash, the precision with which market makers withdrew suggests coordinated behavior rather than mere panic. Below is a detailed timeline of liquidity disappearance:
-
20:00 UTC (4:00 PM EDT): Trump officially announces 100% tariffs on Chinese imports via social media. Bitcoin begins falling from $122,000. Market makers still hold positions but start widening spreads—a standard defensive move
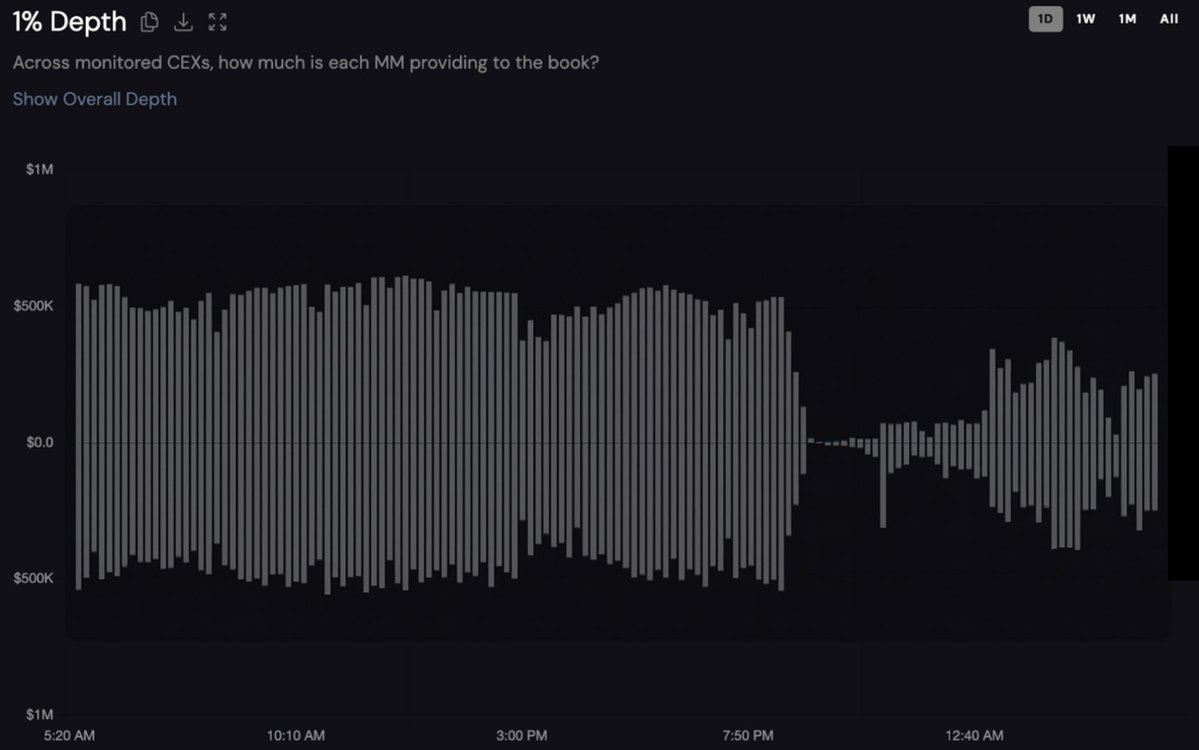
Bidirectional 1% depth chart over the past 24 hours for an unnamed token on Binance. Buy orders are below the x-axis, sell orders above. Data source: Coinwatch
-
20:40 UTC: Real-time tracking data reveals the beginning of catastrophic liquidity withdrawal. Market depth for a major token starts plummeting from $1.2 million.
-
21:00 UTC: Critical turning point. As U.S. trading commences, macroeconomic conditions deteriorate sharply. Institutional participants pull liquidity, bid-ask spreads widen, and order book depth thins. At this stage, market makers shift from defensive positioning to full retreat.
-
21:20 UTC: Chaos peaks. Amid a global wave of liquidations, nearly all tokens hit bottom around this time. Market depth for tracked tokens drops to just $27,000—a 98% decline. When prices fall to $108,000, liquidity providers stop defending levels; some altcoins drop by 80%.
-
21:35 UTC: As the fiercest selling pressure subsides, market makers cautiously return. Within 35 minutes, aggregate bid-ask depth across centralized exchanges (CEX) recovers to over 90% of pre-event levels—but only after maximum damage has occurred.
This pattern reveals three key insights:
-
Market makers had a 20–40 minute warning window before fully withdrawing.
-
Liquidity withdrawal was synchronized across multiple firms.
-
Liquidity returned only after profitable re-entry points emerged.
When Insurance Funds Fail: The ADL Chain Reaction
When market makers abandon their posts and liquidations sweep through order books, exchanges activate their final line of defense: Auto-Deleveraging (ADL). Understanding this mechanism is crucial to grasping the full scope of October’s disaster.
How ADL Works on Centralized Exchanges
ADL is the third and final layer in the liquidation hierarchy:
-
Layer One – Order Book Liquidation: When a position falls below maintenance margin, the exchange attempts to close it via the order book. If successfully liquidated at a price better than the bankruptcy price (insurance fund = 0), the surplus flows into the insurance fund.
-
Layer Two – Insurance Fund: If order book liquidity is insufficient, the insurance fund absorbs losses. This fund accumulates profits from successful liquidations during normal periods and acts as a buffer against bad debt.
-
Layer Three – Auto-Deleveraging (ADL): When the insurance fund cannot cover losses, the exchange forcibly closes profitable opposing positions.
ADL Ranking Systems
Binance’s ADL Mechanism
Binance uses a complex ranking formula: ADL Rank Score = Position PnL Percentage × Effective Leverage
Where:
-
Position PnL Percentage = Unrealized Profit / abs(Position Nominal Value)
-
Effective Leverage = abs(Position Nominal Value) / (Account Balance – Unrealized Loss + Unrealized Profit)
Bybit’s Approach
Bybit’s method is similar to Binance’s but includes additional safeguards. They use a five-light indicator to show your percentile rank:
-
5 Lights = Top 20% (Highest ADL Priority)
-
4 Lights = 20%-40%
-
3 Lights = 40%-60%
-
2 Lights = 60%-80%
-
1 Light = Bottom 20% (Lowest ADL Priority)
The most successful traders—those with the highest profits and leverage—are prioritized for forced liquidation. This is the cruelest aspect of the ADL mechanism.
The October ADL Disaster
The scale of Auto-Deleveraging (ADL) on October 10–11 was unprecedented:
-
Hyperliquid: Triggered cross-insurance fund ADL for the first time in two years, affecting over 1,000 wallets.
-
Binance: ADL widely triggered.
-
Bybit: Reported over 50,000 short positions deleveraged, totaling $1.1 billion.
-
BitMEX: An exception, with only 15 contracts triggering ADL, thanks to its large insurance fund.
ADL activation timing closely correlates with market maker withdrawal. Between 21:00 and 21:20 UTC, order book liquidity dried up, preventing orderly liquidations, rapidly depleting insurance funds and triggering ADL.
Case Study: The Catastrophic Ripple Effect
Below is a typical hedge portfolio’s experience during those critical 35 minutes:
-
21:00 UTC: Trader holds:
-
BTC Long: $5 million, 3x leverage
-
DOGE Short: $500,000, 15x leverage (profitable hedge position)
-
ETH Long: $1 million, 5x leverage
-
-
21:10 UTC: Market makers withdraw; DOGE price plummets, making the short position highly profitable. However, due to high leverage and profit combination, ADL is triggered.
-
21:15 UTC: DOGE short is forcibly closed, removing hedge protection from the portfolio.
-
21:20 UTC: With hedge protection gone, BTC and ETH long positions are sequentially liquidated. Final loss: entire portfolio wiped out.
This pattern repeated thousands of times across the market. Many carefully balanced positions were forcibly closed by ADL, causing hedges to fail, leaving exposed long or short positions vulnerable to liquidation, resulting in devastating losses.
Why Market Makers Failed: Misaligned Incentives
The synchronized withdrawal of liquidity exposed a fundamental structural flaw. Market makers faced multiple incentives to abandon the market:
-
Asymmetric Risk vs. Reward: During extreme volatility, potential losses from maintaining quotes far exceed normal spread profits. A market maker quoting $1 million in depth might earn $10,000 in spread profits under normal conditions but face losses up to $500,000 during a crash.
-
Information Advantage: Market makers see overall order flow and position distribution. When they detect heavy long bias in the market (e.g., 87% of positions are long), they know the direction of the impending collapse. Knowing a massive sell-off is coming, why provide buy-side liquidity?
-
No Legal Obligation: Unlike traditional exchanges where designated market makers have regulatory requirements, crypto market makers can withdraw at any time. There are no penalties for abandoning the market during crises.
-
Arbitrage Opportunities: Crash data shows that retreating market makers shifted to arbitrage between exchanges. When price gaps exceeded $300 across platforms, arbitrage profits far surpassed those from traditional market making.
The Destructive Feedback Loop
The interaction between market maker withdrawal and Auto-Deleveraging (ADL) created a catastrophic feedback loop:
-
An initial shock (Trump tariff announcement) triggers selling;
-
Market makers anticipate a potential crash and choose to withdraw;
-
Liquidations cannot be completed normally due to empty order books;
-
Insurance funds rapidly deplete absorbing bad debt;
-
ADL activates, forcibly closing profitable positions;
-
Deleveraged traders must re-hedge, increasing sell pressure;
-
More liquidations trigger, looping back to step 3.
This cycle continued until leveraged positions were almost entirely eliminated. Data shows overall open interest dropped by approximately 50% within hours.
The Truth About Market Structure
The October 10–11 disaster was not primarily caused by excessive leverage or regulatory failure, but by misaligned incentives within market structure. When those responsible for maintaining order profit more from chaos than stability, chaos becomes inevitable.
Timeline data shows market makers did not panic—they executed a coordinated retreat at optimal moments to minimize their own losses and maximize subsequent opportunities. This rational behavior under current incentive structures produced irrational outcomes for the market as a whole.
Rebuilding Trust Through Accountability
The October 2025 liquidity crisis exposed a critical weakness in cryptocurrency markets: when mandatory liquidity support is most needed, voluntary liquidity provision fails. The $19 billion in liquidations was not merely the failure of over-leveraged traders, but the inevitable result of a systemic issue—market makers enjoy all the privileges of liquidity provision without bearing any responsibility.
Solutions already exist:
-
Graded Responsibility System: Align benefits with obligations;
-
Insurance Funds Sized to Actual Risk: Avoid overly optimistic assumptions;
-
ADL Combined With Circuit Breakers: Prevent cascading liquidations;
-
Real-Time Transparency of Market Maker Activity: Enhance trust.
What’s truly missing is the will to implement them. Unless crypto exchanges prioritize long-term stability over short-term fee revenue, such “unprecedented” events will continue to occur with frustrating frequency.
The 1.6 million accounts liquidated on October 10–11 paid the price for this structural failure. The question remains: will the industry learn from their sacrifice, or continue waiting for the next group of traders to discover, when crisis hits, that the market makers they relied on vanish like smoke, leaving only cascading liquidations and forced closures of profitable positions?
The above analysis is based on existing market data, cross-platform price comparisons, and established market behavior patterns. Views expressed are personal opinions, informed by available information but do not represent any entity’s stance.
Join TechFlow official community to stay tuned
Telegram:https://t.me/TechFlowDaily
X (Twitter):https://x.com/TechFlowPost
X (Twitter) EN:https://x.com/BlockFlow_News