

Academic research supports institutional prediction: BTC worth $3 million in 5 years?
TechFlow Selected TechFlow Selected
Academic research supports institutional prediction: BTC worth $3 million in 5 years?
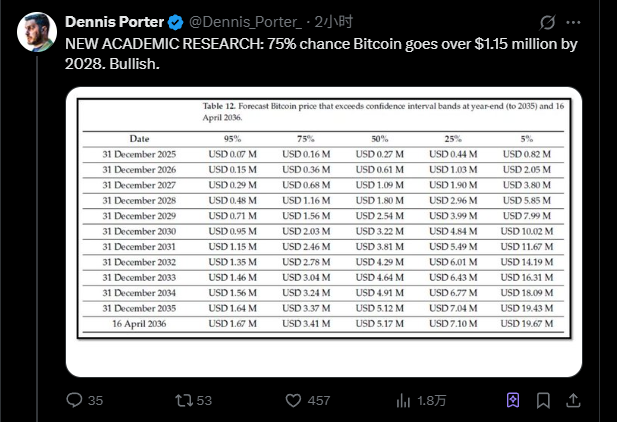
$1 million, possibly arriving in 2028.
Author: TechFlow
The one-day Binance Life carnival has ended.
After the hype fades, a few people achieve big results, while most are left with regret and self-reflection.
Compared to the short-term disappointment of missing out on a trending meme coin, the long-term inability to hold BTC for steady gains is another kind of recurring regret that resurfaces every so often.
For example, during the National Day holiday, the following prediction chart frequently appeared in social media discussions. Even buying BTC three years ago and holding it ever since would still yield solid returns today.

Perhaps the question still on steady investors' minds is: as the bellwether of the crypto market, how high can BTC go?
Previously, MicroStrategy predicted Bitcoin would reach $2.4 million by 2036, while ARK Invest made an even more aggressive forecast of $3.8 million by 2030. These numbers have long been criticized as overly optimistic or driven by bias.
But recently, a relatively more neutral and rigorous academic study has provided theoretical support for these predictions.
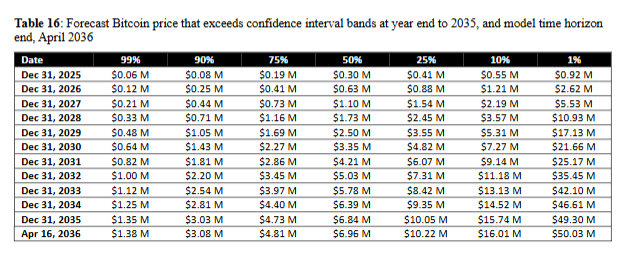
A new paper from Satoshi Action Education (a nonprofit research organization) shows that based purely on supply and demand analysis, there is a 75% probability Bitcoin will exceed $4.81 million by 2036. This is 25% higher than even the most aggressive institutional forecasts.
At the same time, the study also predicts a 50% chance BTC will surpass $3.35 million by 2030, not far off from ARK's $3.8 million projection.
While theoretical research doesn't necessarily reflect real-world outcomes, understanding different analytical approaches—rather than blindly following price calls—can help inform asset allocation decisions.
$1 million could arrive by 2028
First, here are several key conclusions from the study.
There is a 75% probability Bitcoin will exceed $4.81 million by April 2036, with a median estimate around $6 million, corresponding to a market cap of approximately $125 trillion—about 6–8 times the current global gold market cap.
More importantly, timing.
The study suggests the most likely window for Bitcoin to break $1 million is between late 2027 and late 2028. Specifically, under the 50% probability (median) scenario, Bitcoin reaches $1.1 million by the end of 2027.
Under the 75% probability range, this milestone occurs within 2028. This timeline broadly aligns with ARK Invest’s projection of $3.8 million by 2030.
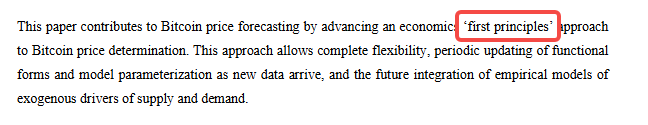
Different from institutional forecasts, this study focuses primarily on changes in Bitcoin’s supply and demand—the first principles of economics.
To be more precise: it doesn’t look at historical price trends, nor does it assume Bitcoin will capture a fixed share of gold’s or other assets’ market value.
Instead, it solely calculates how the supply-demand equilibrium evolves over time, based on the fixed cap of 21 million coins (supply), combined with observable purchasing behaviors (demand), such as ETF inflows, corporate purchases, miner accumulation, etc.
The biggest advantage of this method is that all key variables can be continuously tracked and verified.
Daily net ETF inflows are publicly available via financial terminals like Bloomberg; exchange balances can be monitored in real-time using on-chain data; long-term holder ratios are tracked by analytics platforms like Glassnode and CryptoQuant.
Notably, the findings of this supply-demand model align closely in magnitude with institutional forecasts that use entirely different methodologies.
MicroStrategy’s Bitcoin24 model, which assumes a gradually declining growth rate in Bitcoin’s price, also projects a base case of $2.4 million by 2036.
Institutions are buying at 10x the rate of new supply
Against shrinking supply is surging demand. The study compiled daily purchase volumes across major buyer groups:
U.S. spot Bitcoin ETFs had an average daily net inflow of about 2,900 BTC in July 2025. As of July 29, the 11 ETFs collectively held approximately 1.485 million BTC, or 7.1% of total supply. Among them, BlackRock’s IBIT holds over 730,000 BTC.
On the corporate side, as of July 28, the top 100 public companies held over 923,000 BTC combined. MicroStrategy (now renamed Strategy) alone holds over 607,000 BTC, continuing to accumulate at roughly 1,000 BTC per day. Some mining firms are also stockpiling output: Marathon mined 950 BTC in May 2025 but sold none, resulting in a net monthly accumulation equivalent to about 31 BTC per day.
Adding up ETF inflows, corporate purchases, miner hoarding, and retail buying, the study estimates that 5,000–6,000 BTC are exiting circulation daily.
After the fourth halving, miners produce only 450 new coins per day. This means daily demand exceeds daily supply by 11–13 times.
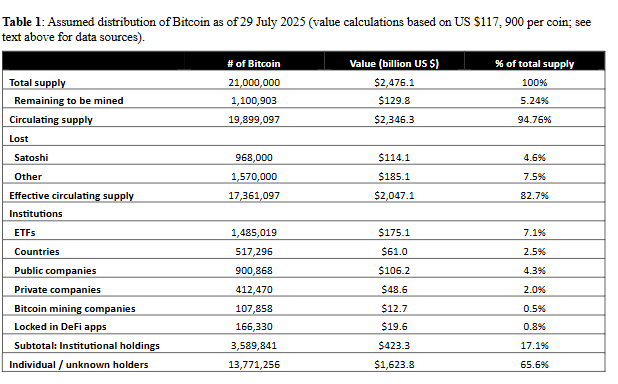
But a more critical question is: of the 19.9 million BTC already mined, how much is truly circulating in the market?
As of July 29, 2025, 19.9 million BTC have been mined, with the remaining 1.1 million to be released slowly over the next 115 years.
The research team estimates: approximately 970,000 BTC mined early by Satoshi Nakamoto have never moved and are widely believed inaccessible; conservatively, around 1.57 million BTC are permanently lost due to lost private keys; among the remaining 17.36 million "effective circulating supply," 14.4 million BTC have not moved on-chain for over 155 days and are classified as "non-liquid supply."
These 14.4 million "sleeping" Bitcoins represent the largest uncertainty.
The study assumes 40% (about 5.76 million BTC) will permanently exit circulation, possibly used as corporate strategic reserves, DeFi collateral, or long-term locked assets for credit purposes.
Based on this, the supply that could realistically return to the market is about 8.64 million BTC, plus the known 3 million BTC currently on exchanges, resulting in a total liquid supply of approximately 11.64 million BTC.
This supply-demand imbalance isn’t theoretical—it’s already happening, and accelerating.
On-chain data shows non-liquid supply increased from 13.9 million on January 1, 2025, to 14.37 million on June 26, equating to about 2,650 BTC entering long-term holding each day. Statistics show 70–90% of BTC transferred out of exchanges remain unmoved for over 155 days.
Once they leave exchanges, they’re unlikely to return anytime soon.
A similar supply contraction occurred in 2019–2020: Bitcoin steadily flowed out of exchanges, tightening liquid supply.
In August 2020, MicroStrategy began buying; Square entered in October; prices then accelerated from $10,000 to $69,000 by early 2021. The current contraction is even faster.
If ETF and corporate buying continues, combined with reduced miner output, the decline in liquid supply will be steeper than in the previous cycle.
At current pace, price acceleration may occur in 3–5 years
The study’s core finding is: when liquid supply drops below 2 million BTC, prices may enter a phase of nonlinear growth.
Why 2 million?
Through simulations of varying daily BTC withdrawal rates, the study found that when fewer than 2 million tradable BTC remain in the market, each new buy order significantly pushes up the price, and rising prices further incentivize holders to keep囤币 (hoard), creating a self-reinforcing positive feedback loop.
Once this threshold is reached, each new purchase by incoming buyers disproportionately impacts price.
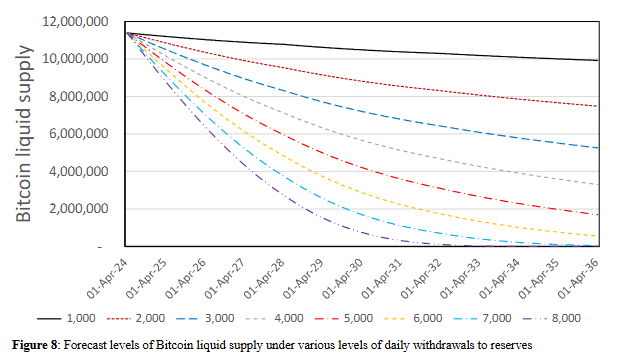
Different withdrawal scenarios projected to 2036:
-
If 1,000 BTC exit circulation daily (far below current levels), 9.92 million liquid BTC remain by 2036, with a price of ~$1.39 million and annualized return of 29.11%—a relatively mild growth path.
-
If 2,000 BTC exit daily (close to the study’s baseline assumption), 7.48 million remain, price reaches $1.6 million, annualized return 30.64%.
-
If 4,000 BTC exit daily, 3.3 million remain, price hits $2.41 million, annualized return 35.17%.
-
If 6,000 BTC exit daily (around current actual levels), liquid supply drops to 560,000, price surges to $5.86 million, annualized return 45.57%. This is near the tipping point.
From a time perspective, at current speeds, this critical threshold could be reached in 3–5 years.
The study shows that if daily withdrawals stay at 6,000 BTC, liquid supply will fall below 2 million by end of 2029; if withdrawal speed increases to 7,000 BTC/day, this point arrives earlier, by 2028–2029.
Even more telling is the change in price trajectory.
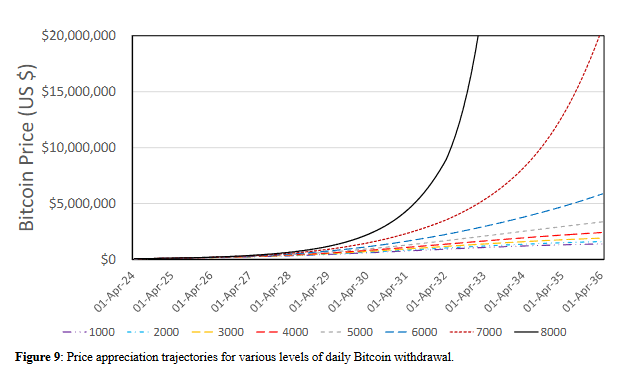
In all scenarios with daily withdrawals below 6,000 BTC, the price curve follows a relatively smooth upward trend.
But once withdrawals hit 7,000 BTC/day, the curve begins to bend sharply upward starting in 2032;
At 8,000 BTC/day, this curvature appears as early as 2030, becoming almost vertical after 2032.
Sell pressure concerns: Will the 14.4 million sleeping BTC wake up?
The study doesn’t claim price acceleration is guaranteed. The biggest uncertainty lies in:
How many of the 14.4 million BTC that haven’t moved in over 155 days will re-enter the market as prices rise?
The study assumes 40% (about 5.76 million BTC) will permanently exit circulation—used as corporate reserves, DeFi collateral, or simply lost forever.
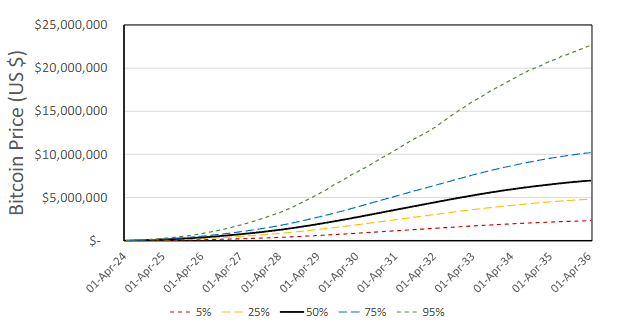
But this assumption may not hold. So the paper ran 10,000 simulations, varying initial liquid supply randomly between 5 million and 13 million BTC. Results showed:
Even in the most optimistic case (13 million liquid), there’s still a 50% chance Bitcoin exceeds $6 million by 2036.
The second variable is whether buyers will “flinch.” When Bitcoin rises from $120k to $500k, then to $1 million, will institutions maintain their current pace of buying 2,900 BTC per day?
The study sets a parameter for this: if price triples, buyers halve their purchase volume, then 2036 price might only reach $1.39 million.
Currently, institutional buyers appear insensitive to price.
During Bitcoin’s rise from $65k to $118k (an 81% increase), ETF and corporate buying rhythms remained largely unchanged. If this pattern persists, price increases may not curb demand.
Which BTC indicators should you watch?
The value of this study lies not just in a price number, but in providing a framework of measurable indicators.
Since all key model variables rely on public data, investors can track in real-time which direction the market is heading.
The study recommends monitoring four core indicators:
-
Exchange Bitcoin balances
Platforms like Glassnode and CryptoQuant update Bitcoin holdings across major exchanges daily. A sustained decline approaching 3 million BTC (current level) signals tightening liquid supply.
More crucially, monitor the rate of decline. If monthly reductions exceed 100,000–150,000 BTC, at current pace, we could approach the 2 million critical zone within 3–5 years.
-
ETF net inflow data
Financial terminals like Bloomberg publish daily fund flows for the 11 U.S. spot Bitcoin ETFs. Sustained daily net inflows above 2,000–3,000 BTC is itself a strong signal.
It means institutional demand remains strong despite rising prices. Conversely, sustained ETF outflows may indicate growing price sensitivity and market self-correction.
-
Long-term holder supply ratio
On-chain analytics track the percentage of BTC that hasn’t moved in over 155 days. Currently, this stands at about 72% (14.4M / 19.9M).
If this ratio keeps rising past 75%, it means more coins are exiting circulation. More importantly, watch the pace: in the first six months of 2025, non-liquid supply grew from 13.9M to 14.37M (~2,650 BTC/day). If this accelerates to 3,000–4,000 BTC/day, caution is warranted.
-
Daily net BTC withdrawal from circulation (aggregate calculation)
Add ETF inflows, disclosed corporate purchases, and miner accumulation, then subtract new supply (mining rate, ~450 BTC/day) to roughly estimate daily BTC withdrawal from circulation.
If this figure stabilizes at 5,000–6,000 BTC, we’re in the study’s mid-range scenario; if it exceeds 7,000 BTC for months, we may be nearing the trigger for accelerated price growth.
Of course, the study has limitations. Factors like derivatives and credit intermediaries aren’t fully incorporated. And all predictions rest on one assumption: no major black swan events, such as protocol flaws or regulatory bans.
Yet even accounting for uncertainties, the direction of supply-demand fundamentals is clear:
Daily new supply of 450 BTC is protocol-guaranteed; institutions buying thousands daily is public data; shrinking liquid supply is visible on-chain.
Returning to the opening question: how high can Bitcoin go?
Overall, the study doesn’t give a definitive answer, but reveals a mechanism:
When a fixed cap of 21 million meets ever-growing institutional demand, prices may enter a nonlinear growth phase. A 75% probability points to $4.81 million by 2036, but more important are intermediate milestones—like $1 million by 2028, or $3.35 million by 2030.
Three years ago, anyone who bought and held BTC at any price is still profitable today.
Perhaps years from now, looking back, today’s $120,000 price will become another “how could I have thought that was expensive?” moment. Or perhaps the market will prove, in time, that models are just models.
The answer lies in time. But at least now, you know which numbers to watch.
Join TechFlow official community to stay tuned
Telegram:https://t.me/TechFlowDaily
X (Twitter):https://x.com/TechFlowPost
X (Twitter) EN:https://x.com/BlockFlow_News


